Total fluorescence and fluorescence scanning
Intrinsic fluorescence can be measured on the J-1500 or J-1700 CD spectrometers, with either the Peltier thermostatted single cell holders (PTC-510 and PTC-517) or automatic 6-position Peltier turret cell changer (MPTC-513). A simple low-cost system for detection of total fluorescence is available using a secondary detector and high-pass filters (FDT-538 and FST-470), allowing the user to select the excitation wavelength while detecting the emission at the wavelengths above the cut-off filter. This allows for simple, yet sensitive, detection of fluorescence changes during titration or thermal ramp experiments.
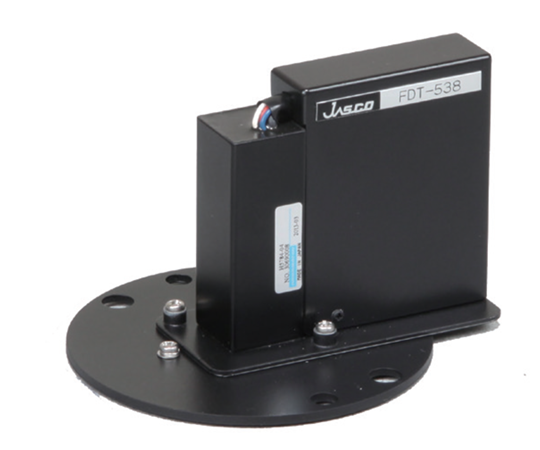
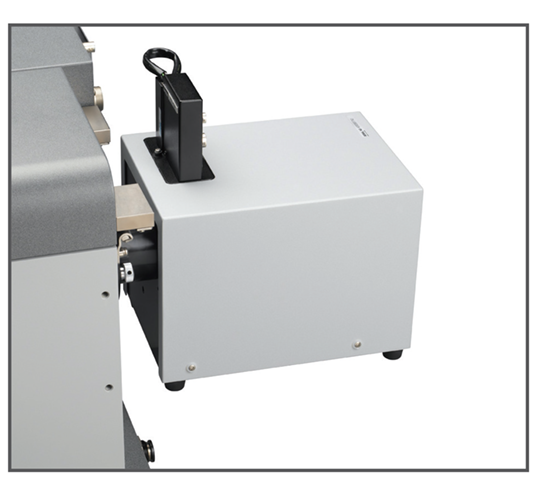
Alternatively, fluorescence data can be acquired by using the optional scanning emission monochromator (FMO-522) and emission detector (FDT-538). Excitation and fluorescence emission spectra can be scanned by fixing the emission or excitation wavelengths, respectively.
• Fluorescence scanning can be coupled with the titration and thermal ramping capabilities
• With the MPTC-513, CD and fluorescence data can be collected, simultaneously or separately, on up to six samples
• With the HTCD Plus, high-throughput fluorescence scanning is also available.
Application
Thermal denaturation of lysozyme measured with CD and fluorescence spectroscopies
Lysozyme, a globular protein found in the white of a hen’s egg, is a model protein used to investigate the denaturation of proteins at high temperature. The secondary structure of lysozyme comprises about 38 % α-helix and 10 % β-sheet.
Chicken egg-white lysozyme (1 mg) was dissolved in 15 mL of deionized water. The thermal denaturation of the protein was monitored using the J-1500 CD spectrophotometer equipped with an MPTC-513 automatic 6-position Peltier turret cell changer and an FMO-522 emission monochromator for detection of fluorescence. CD and fluorescence spectra were automatically measured at 5 °C intervals from 20 to 95 °C. After the final measurement at 95 °C, the sample temperature was returned to 20 °C and a final spectrum was collected.
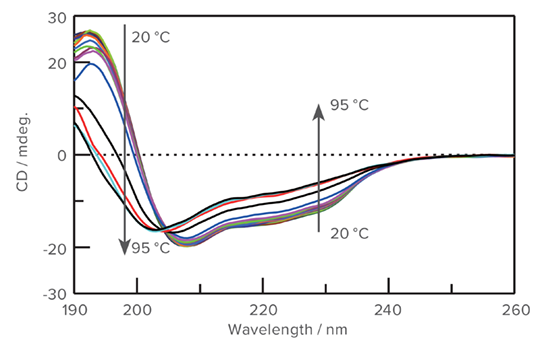
Thermal denaturation measured with CD spectroscopy
Left: As the temperature increases, the intensity of the CD spectra decreases and the minimum at 208 nm blue-shifts to 203 nm.
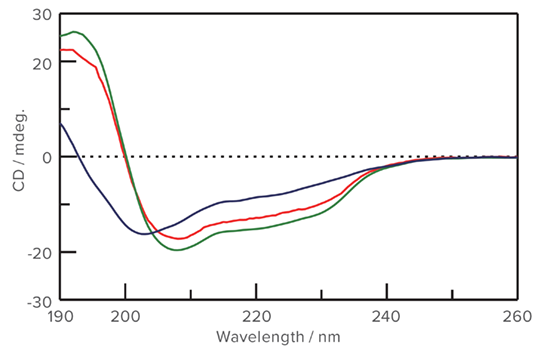
Right: Upon completion of the melt, the temperature is re-equalibrated at the initial 20 °C. Comparison of the CD spectra measured at 20 °C before and after the melt demonstrates that while the protein does refold, it does not recover its original structure. (Green: 20 °C initial / Blue: 95 °C / Red: 20 °C final)
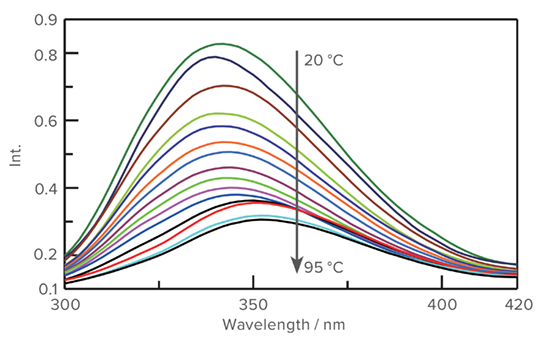
Fluorescence data for the thermal denaturation of Iysozyme from 20 to 95 °C
Left: As the protein undergoes thermal denaturation, the fluorescence decreases in intensity and the emission maximum red-shifts from 338 to 347 nm. As with the CD data, the largest shift occurs between 75 and 80 °C.
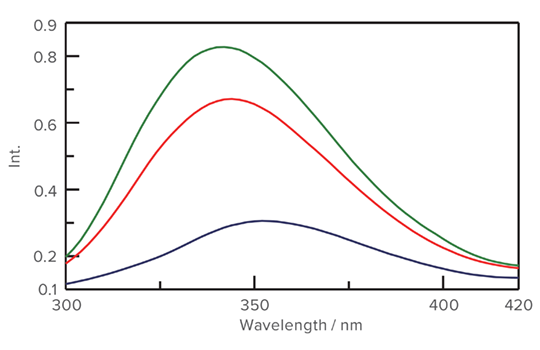
Right: A comparison of the protein fluorescence spectra measured at 20 °C before and after thermal denaturation supports the CD results, which indicate that the Iysozyme structure does not return to its initial native state after denaturation. (Green: 20 °C initial / Blue: 95 °C / Red: 20 °C final)