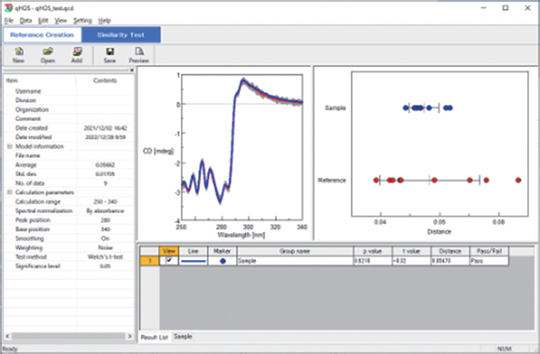
qHOS program
The qHOS can statistically determine the significant difference between spectra, considering various error factors and with the following features
• Statistical similarity evaluation
• Robust evaluation using noise weighting method
• Student, Welch, TOST t-test implementation
• Auto concentration correction
• Orthogonal similarity assessment
• Regulatory compliance with Spectra Manager™ 2.5 CFR
Application
Spectral identity studies of therapeutic antibodies
While the tertiary structure of Herceptin® and MabThera® , which are different therapeutic agents, are not identical, the structure of MabThera® and its biosimilar, RIABNI™, are statistically determined to be identical.

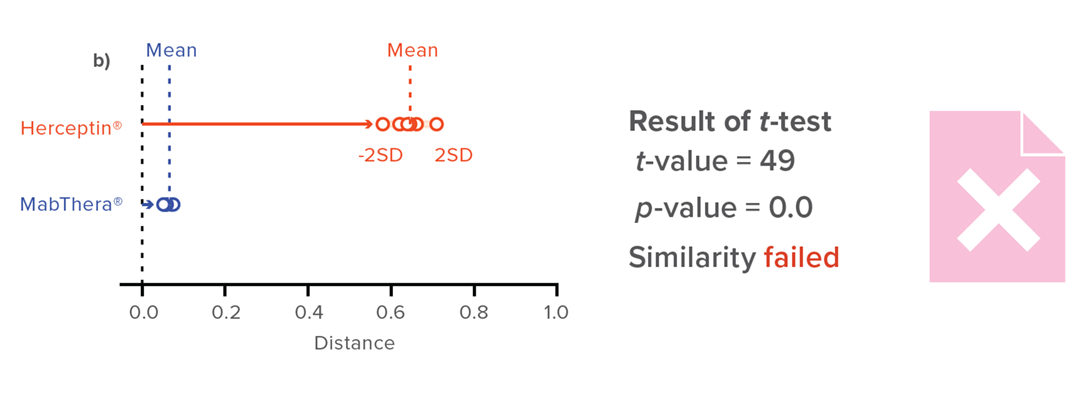
Results of HOS similarity assessment for different antibody drugs
a) mean spectra of MabThera® (blue), Herceptin® (red), and standard deviation for MabThera® (gray).
b) Distance and test results for MabThera® (blue) and Herceptin® (red).
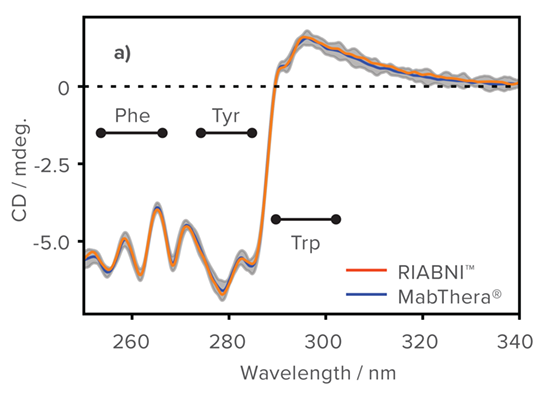
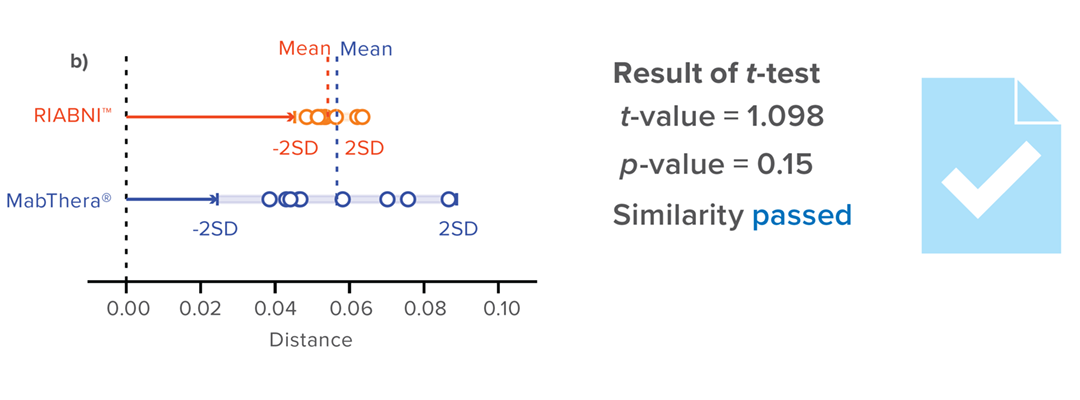
Results of HOS similarity assessment for Rituximab innovator (blue) and biosimilar (red)
a) mean spectra of MabThera® (blue), RIABNI™ (red), standard deviation for MabThera (gray).
b) distances and test results for MabThera® (blue) and RIABNI™ (red).