The MSV-5000 series is a microscopic spectrophotometer system providing transmittance/reflectance measurements of a microscopic sample area with a wide wavelength range from ultraviolet to near-infrared.
A broad range of applications including the collection of transmittance/reflectance spectra of a sample, measurement of the band gap and film thickness of semiconductors, evaluation of the optical characteristics of functional crystals and the color analysis of microscopic samples can be easily implemented using the MSV-5000 series.
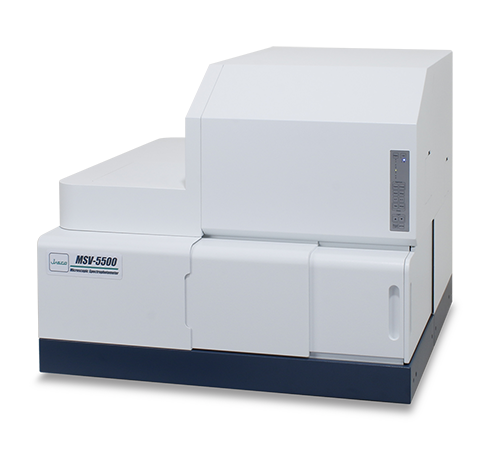
MSV-5500 UV/VIS Microscopic Spectrophotometer
Lineup
MSV-5500: Standard model 200 – 900 nm coverage with PMT
MSV-5700: Broadband model 200 – 2700 nm coverage with PMT/PbS
MSV-5800: NIR high-sensitivity model 200 – 1600 nm coverage with PMT/InGaAs
Features of MSV-5500/5700/5800
Transmittance/Reflectance measurement of a 10 μmφ area in the UV-Visible/NIR region
The small measurement area can be used for the evaluation of semiconductor devices and optical elements, and also for R&D of functional materials.
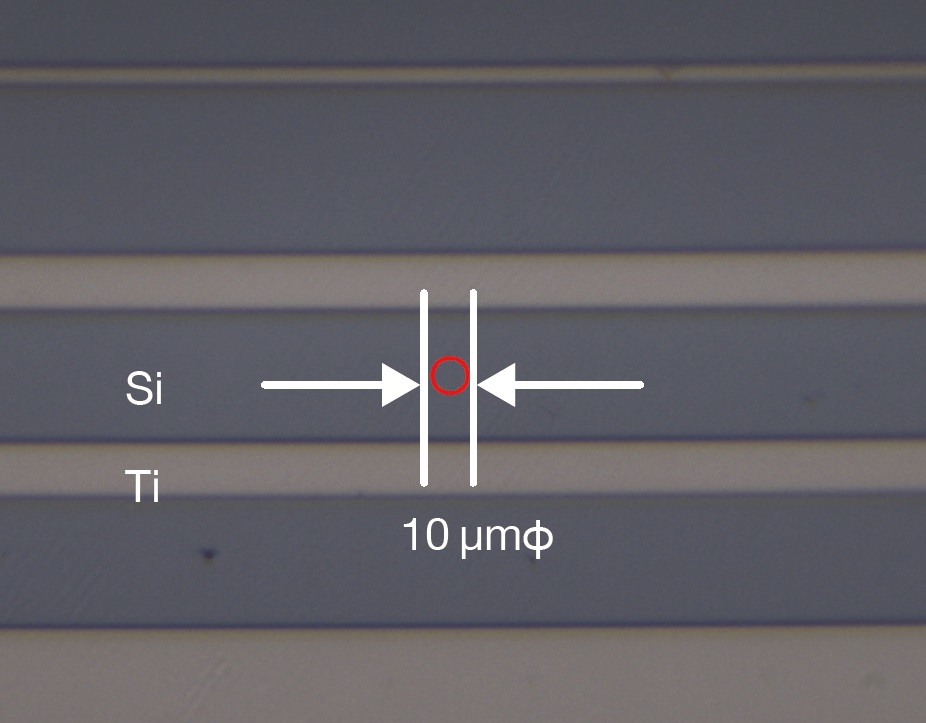
Observation view
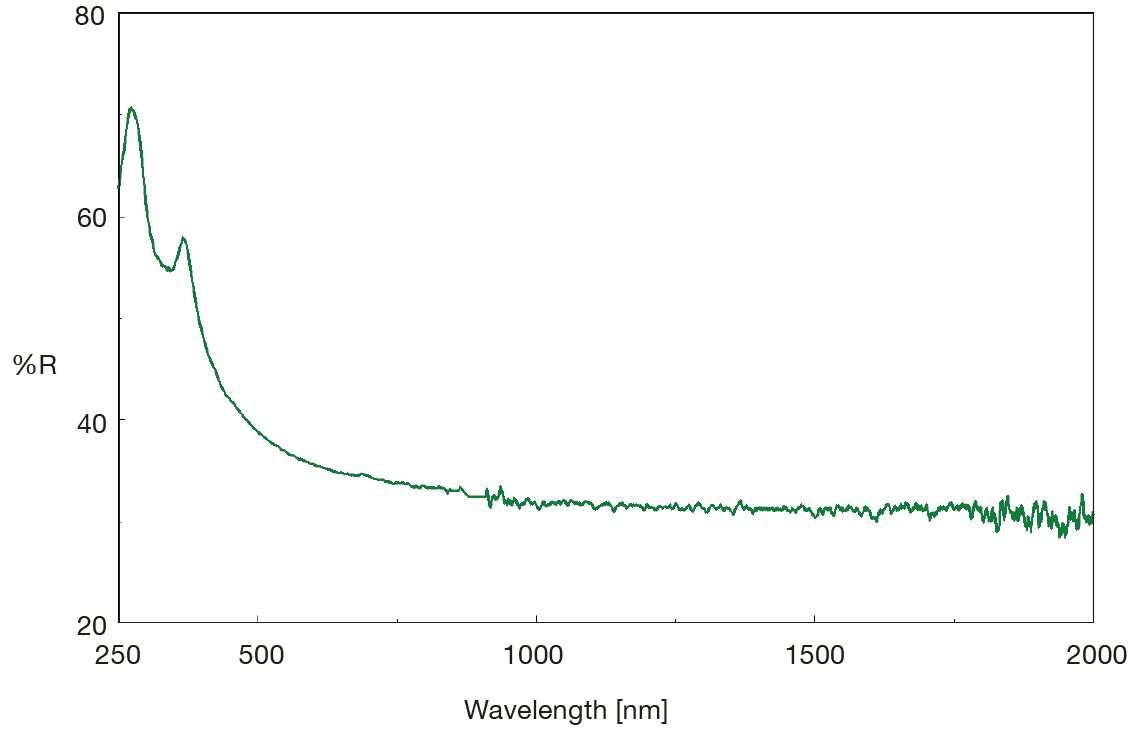
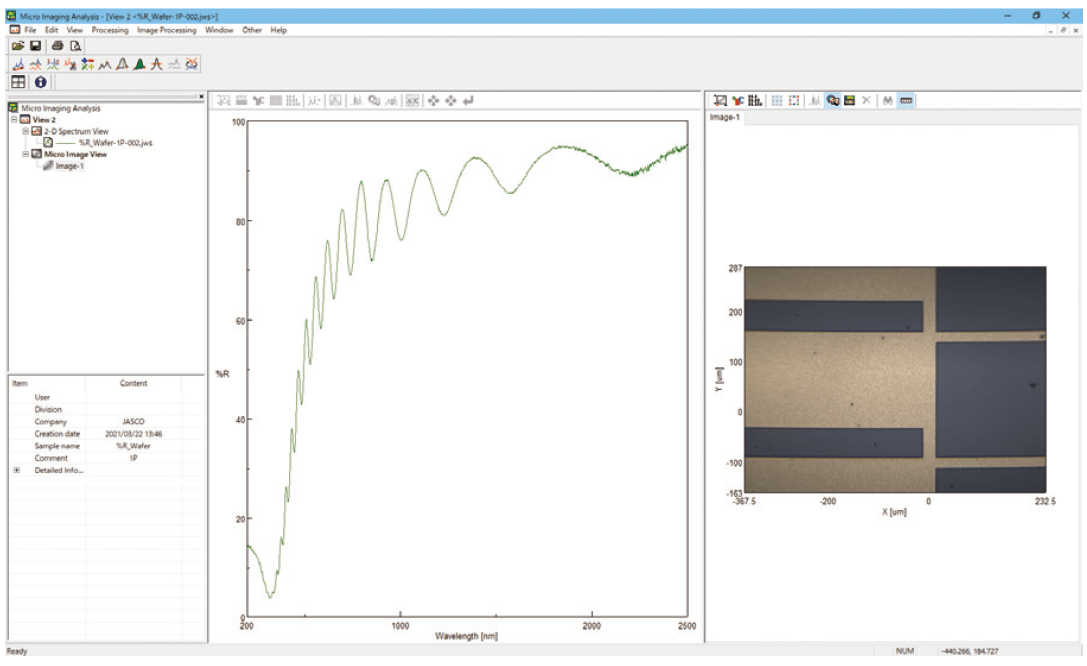
Reflectance spectrum of Silicon dioxide (SiO2) on Si substrate
Excellent absorbance linearity
MSV-5500/5700/5800 microscopic spectrophotometers, which irradiate the sample with the monochromatic light, can provide quantitative information that conventional microscope spectroscopy cannot. Dark correction function also enables the measurement of sample with high absorbance.
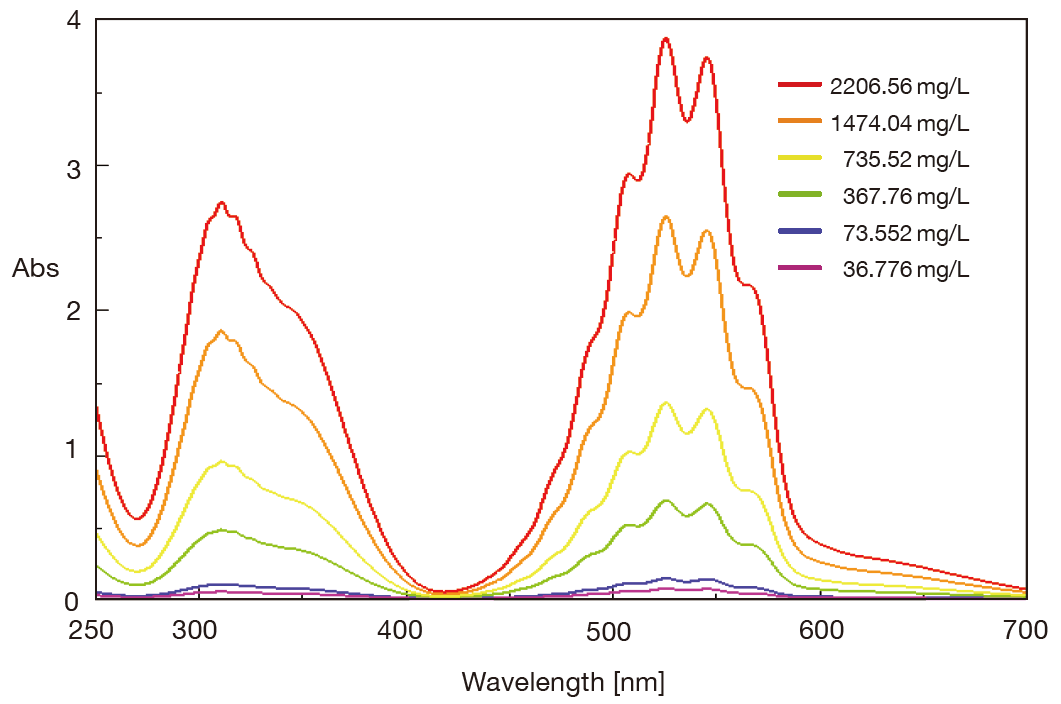
Absorption spectra of KMnO4
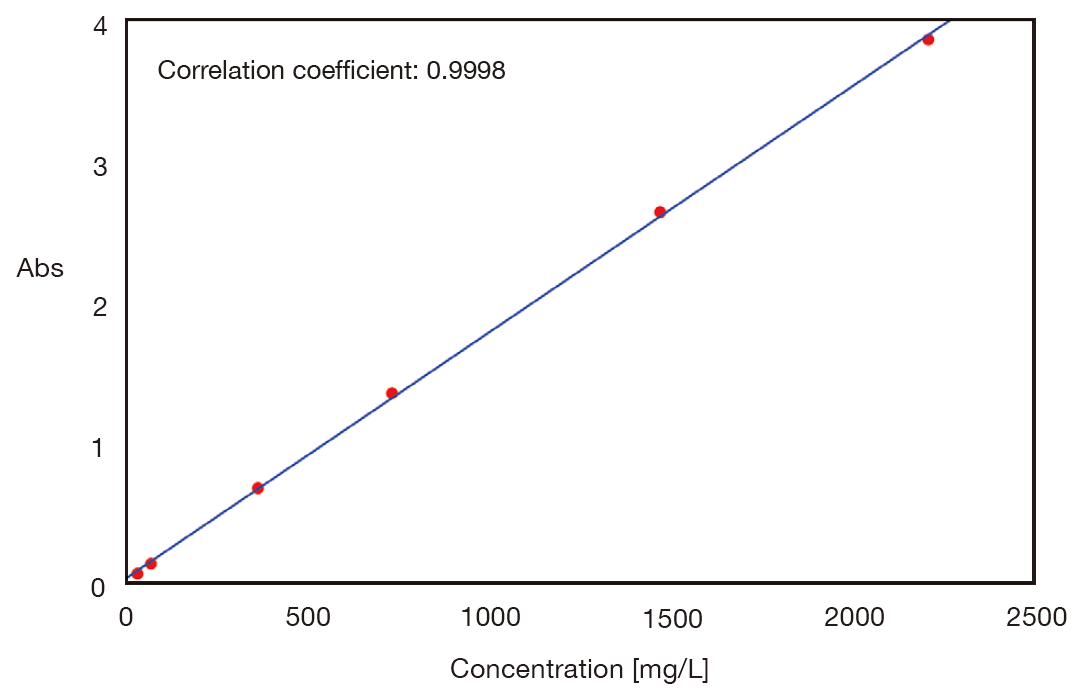
Calibration curve
High wavelength resolution and accuracy
The optical system in the MSV-5500/5700/5800 utilizes a Czerny-Turner mount monochromator, which is well suited to the measurement of spectra that include transitions with narrow bandwidths. For example, the absorption spectrum of gas samples with consecutive sharp peaks can be obtained at high resolution (bandwidth: 0.1 nm), and for the samples with absorption that varies significantly across a narrow wavelength range (such as color filters).
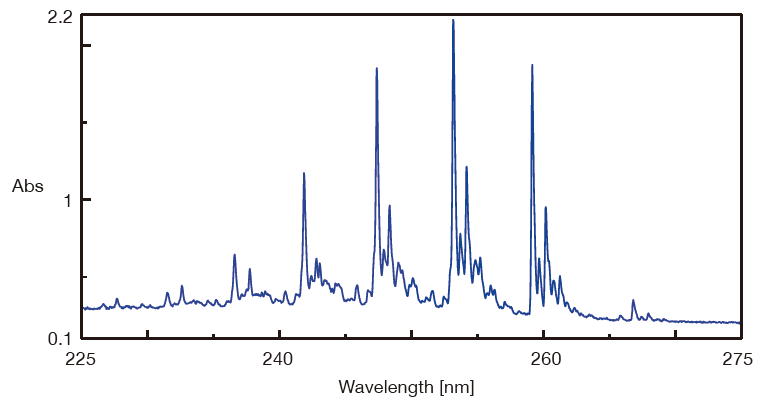
Absorption spectrum of benzene gas (1 mm cell)
Photometric stability by double beam optics
Double-beam optics allow the monitoring of light through the sample and reference simultaneously; this reduces fluctuations in the measured photometric value, providing a more accurate and stable long-term measurement such as time course of sample mapping.
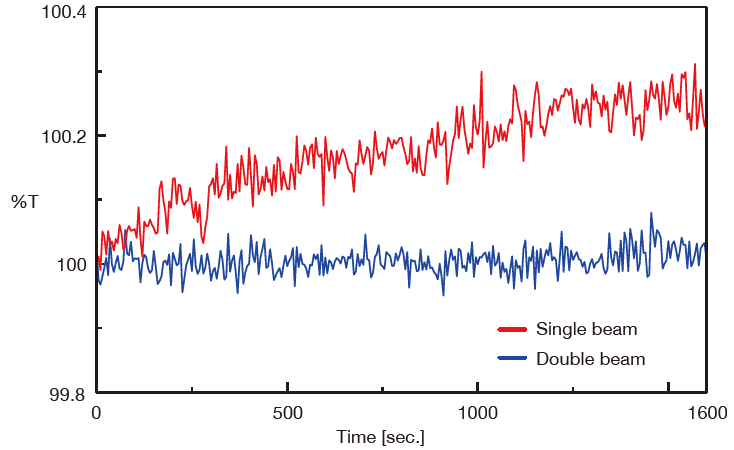
Baseline variation (at 200 nm)
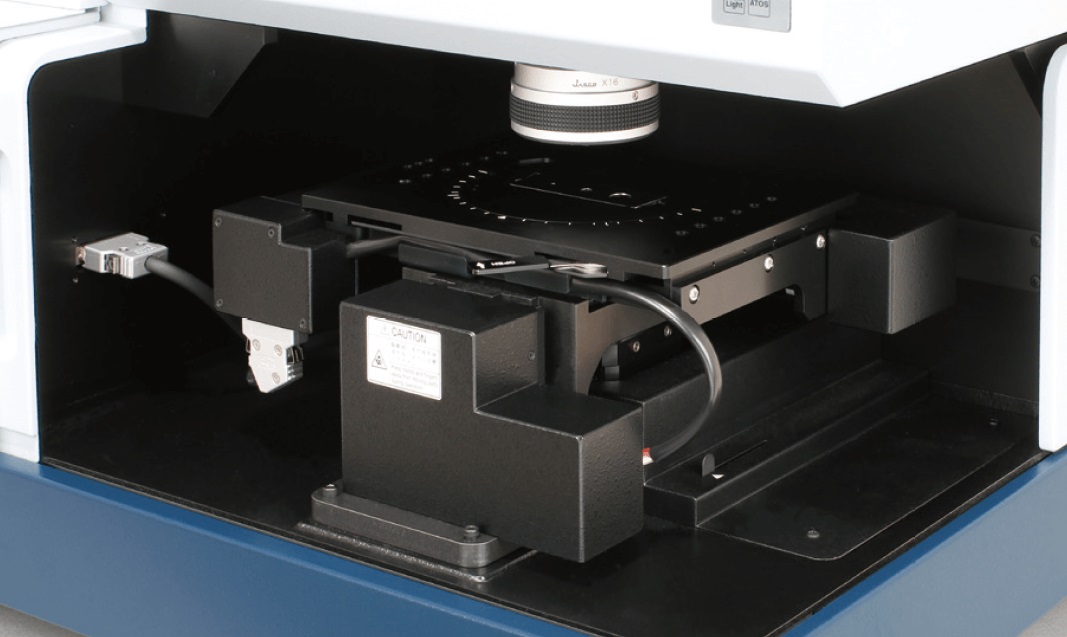
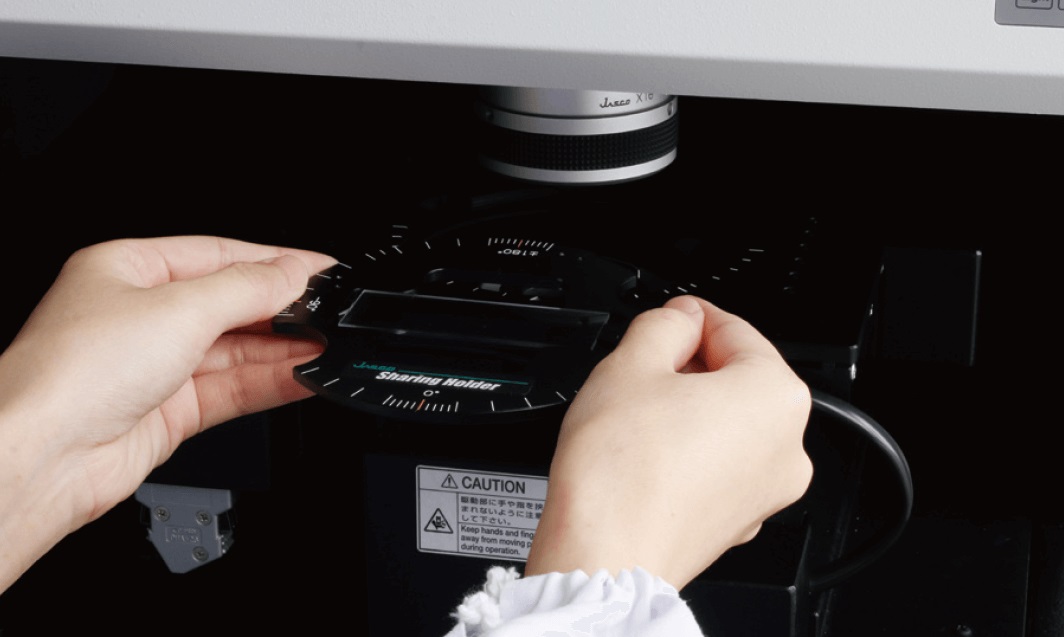
Large sample compartment
The large sample compartment with shading door provides ‘easy-to-see’ operation, making it simple to mount the sample, and eliminates external light from the measurement environment.
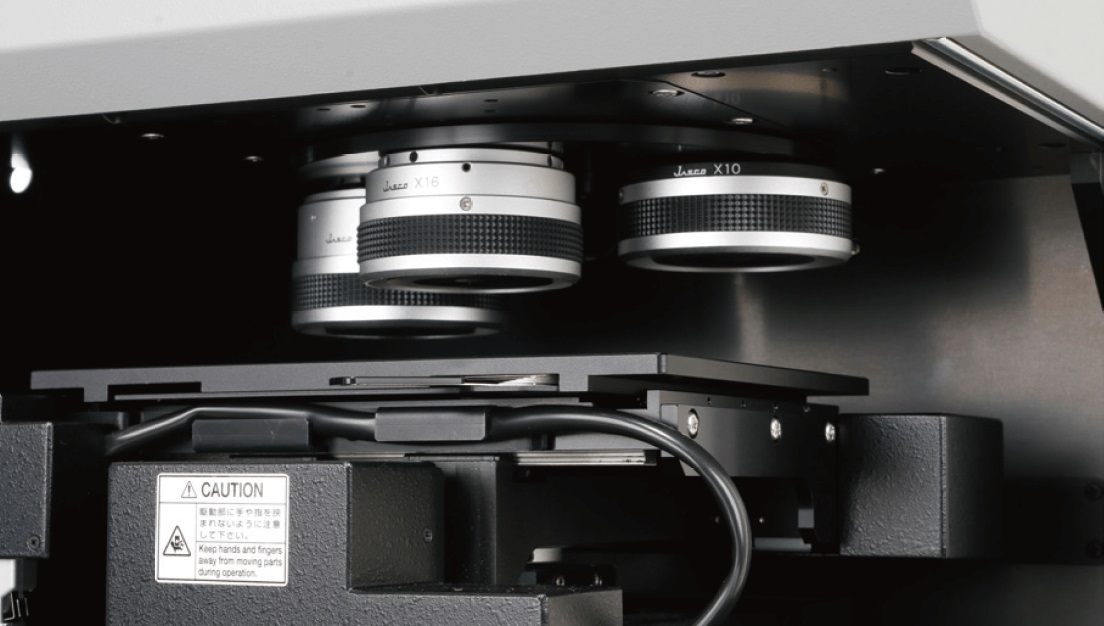
4-position motor-driven revolver
Up to 4 cassegrain objectives (or refractive objective lenses) can be mounted on the automatic revolver. Observation and measurement of the sample can be made using different magnifications, helping the user to identify and set the measurement point with great accuracy.
Observation of measurement point by ATOS function
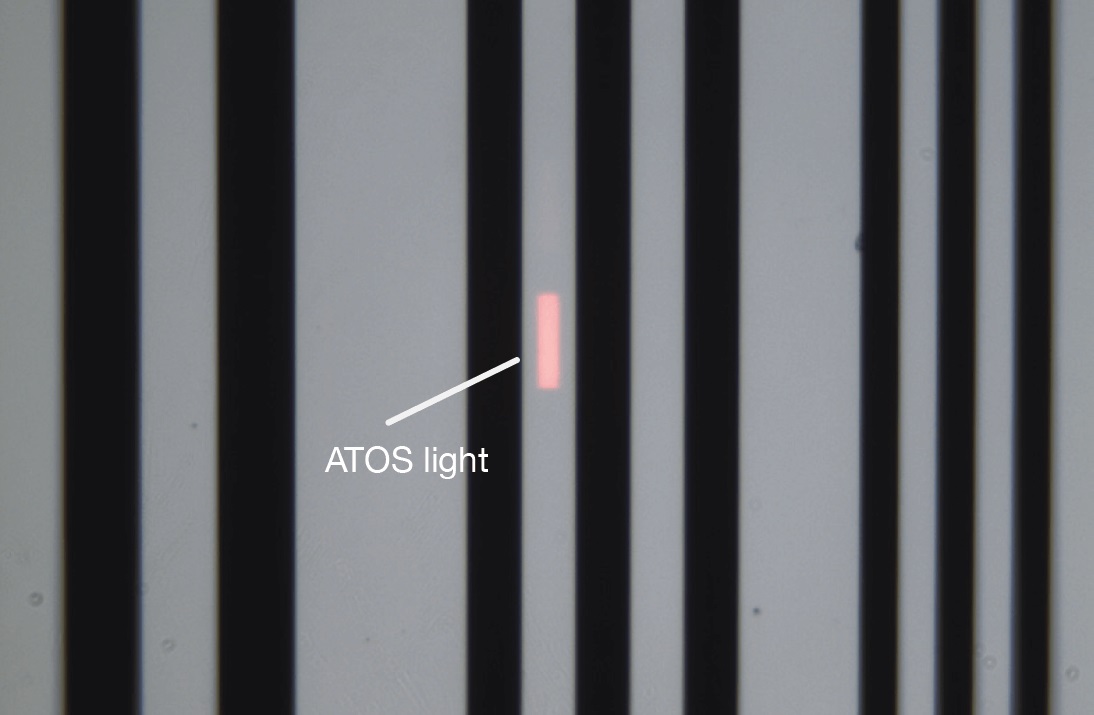
ATOS projects an optical image of the photometric aperture onto the sample’s microscope image; this provides the user with a visual reference point of the measurement position.
Polarization observation
Polarization observation can be used to exploit the differences in a sample’s polarization to improve visualization using color, even when the sample appears colorless and transparent.
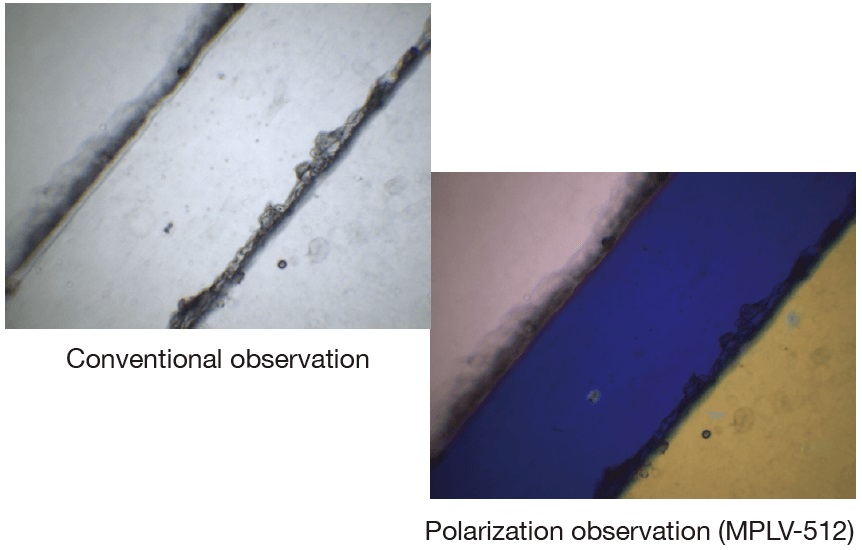
Observation view (piled resin tapes)
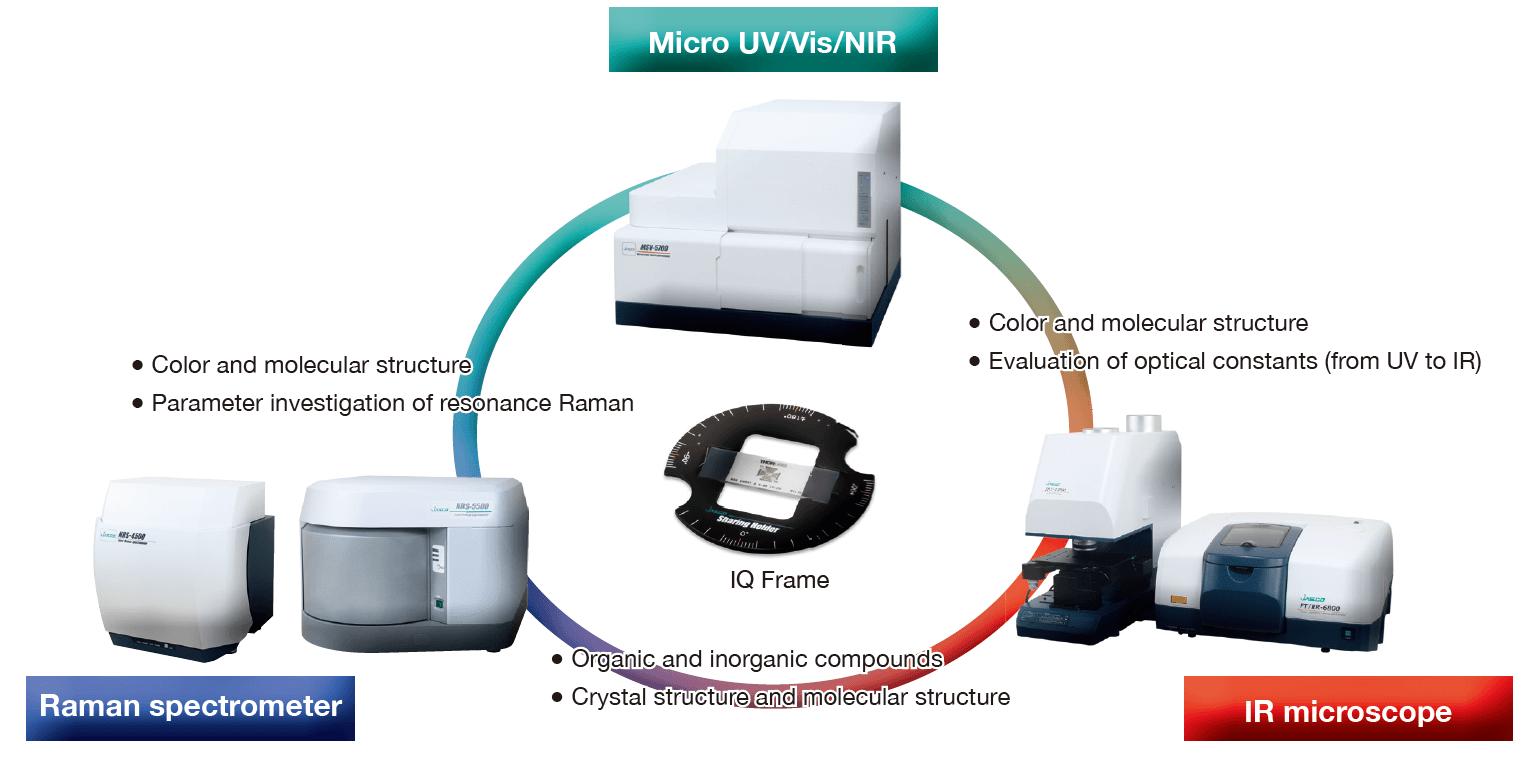
IQ Frame
Using IQ Frame the sample can be moved between different microscopes such as IR, Raman and UV/Vis-NIR to provide measurement and analysis at exactly the same position for correlating and comparing data from different spectroscopic techniques.
Micro imaging analysis
The [Micro Imaging Analysis] program is used to analyze the data from any of the measurement modes, including spectra acquired from single, multi-point or mapping. As standard, many data processing functions are included (such as peak detection, peak height/area calculation, etc.). Also included are two standard application programs for color analysis and film thickness analysis. Mapping measurement data can be visualized easily using image views (such as color 3D view, contour view, color-coded view, etc.), and a single spectrum can be selected from the mapping data for further analysis, saving or export as an individual data file.
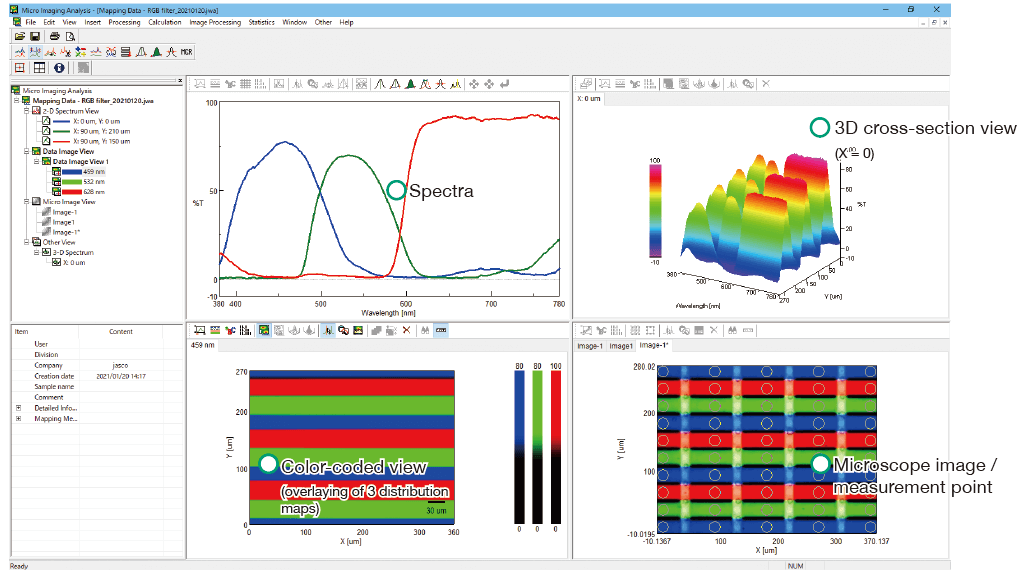
[Micro Imaging Analysis] program
Data processing
Peaks can be identified automatically, and peak heights can also be calculated.
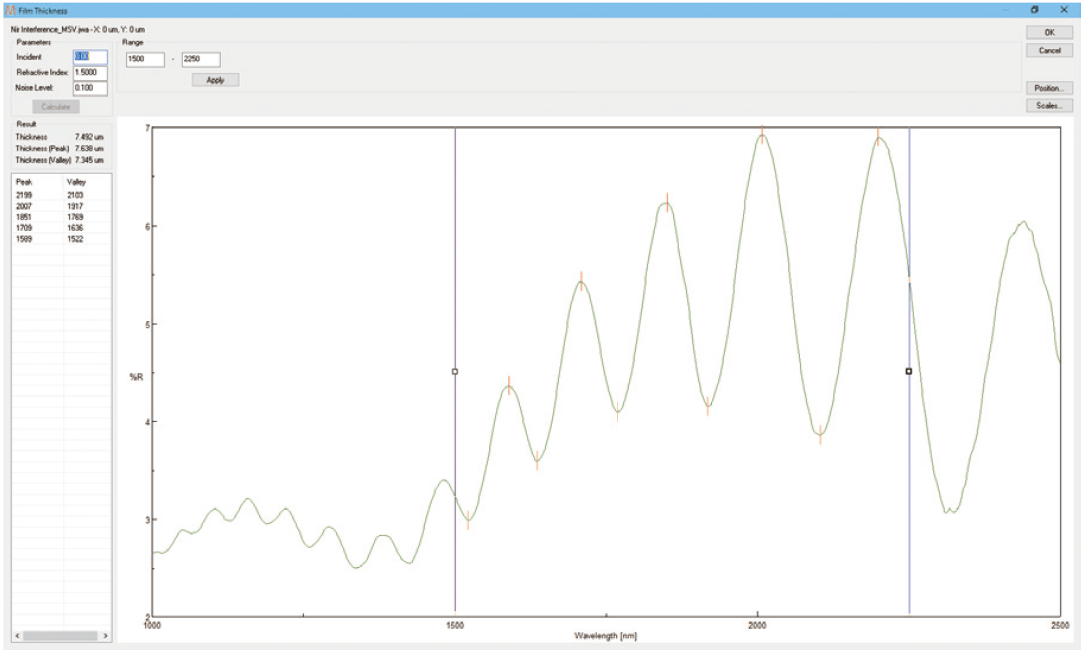
Film thickness calculation
Film thickness can be calculated from the wavelength of the interference fringes in a sample spectrum.
Optional software
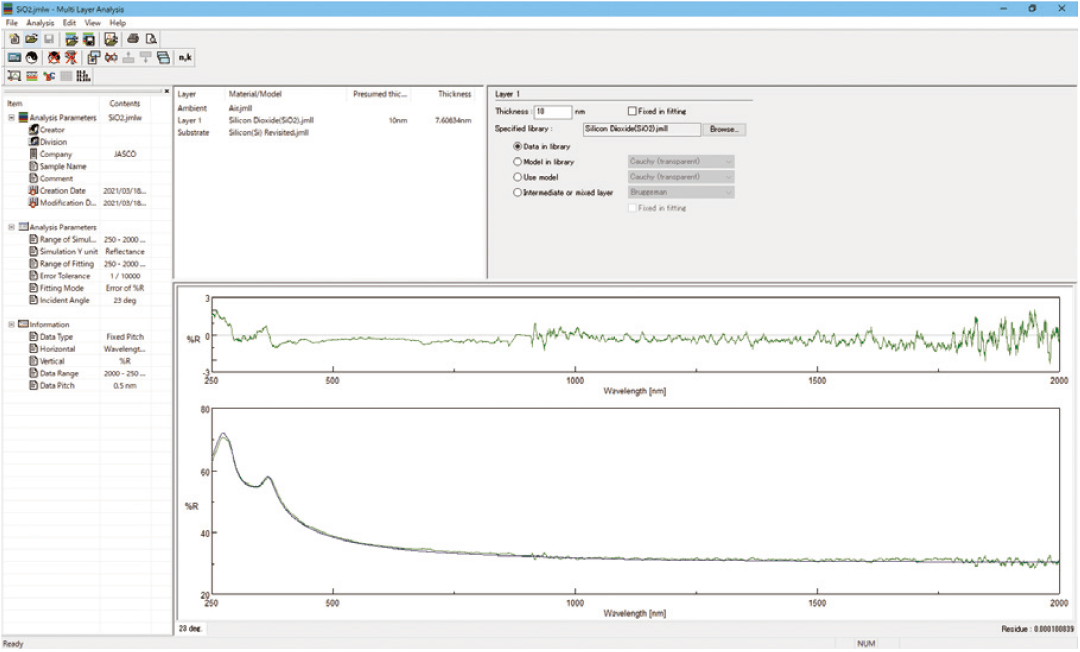
[Multi Layer Film Thickness Analysis] program
Advanced analysis can be made for the calculation of thickness and optical constants (n, k) in multi-layer films.
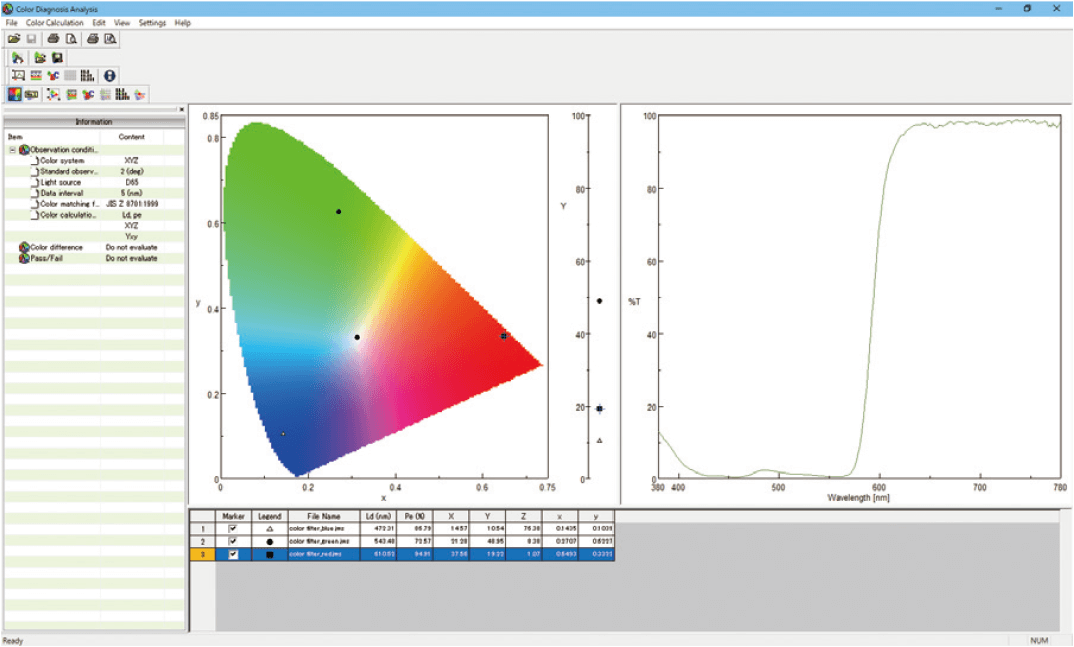
[Color Diagosis] program
Color calculation can be made using one of the standard methods to define color coordinates, the results are also plotted on a color system graph (chromaticity plot), and pass/fail evaluation against standard values is also included.