ThermaFit3D Program
ThermaFit3D program provides deeper insights into multi-state protein and nucleic acid denaturation by analyzing the entire spectrum, delivering results that single wavelength monitoring cannot achieve.
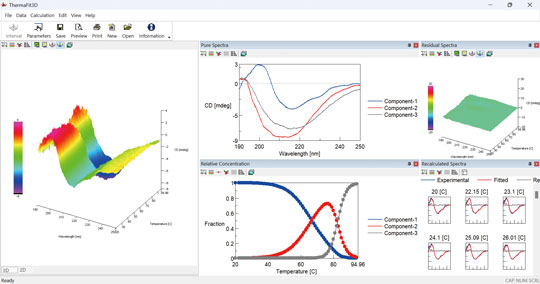
By applying MCR-ALS constrained by thermodynamic models to temperature-dependent CD spectra (3D CD spectra), it is possible to obtain spectra of pure components, concentration profiles of each component, and thermodynamic parameters for each phase transition (Tm, ΔH, ΔS). ThermaFit3D automatically provides residual spectra, helping confirm the reliability of every analysis.
Developed through joint research with Ikebukuro Tsugawa Asano Laboratory at Department of Biotechnology and Life Science, Tokyo University of Agriculture and Technology. For details of analysis using ThermaFit3D program, please refer to the following paper:
Functional and Structural Analyses of Diverse G-Quadruplex and Non-G-Quadruplex Structures Formed by Guanine-Rich Nucleic Acids: A Study on the Insulin Aptamer. doi:10.1002/smll.202501336.
Application
Deconvolution of Mixed -state structure in Insulin-Binding Aptamer
Beyond canonical double-helical structure, nucleic acids are capable of adopting diverse high-order structures, including triplex and quadruplex. Furthermore, it has been reported that these higher-order structures exist in equilibrium states and dynamically change in response to the surrounding conditions. However, extracting information from complex, mixed samples is not straightforward. ThermaFit3D analyzes CD data to break down complex higher-order structures and reveal their proportions.
Using ThermaFit3D program reveals that the insulin-binding aptamer, previously assumed to adopt a single conformation, actually forms five distinct structures in equilibrium.
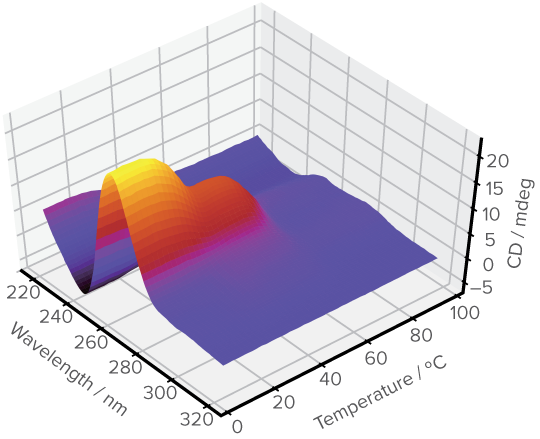
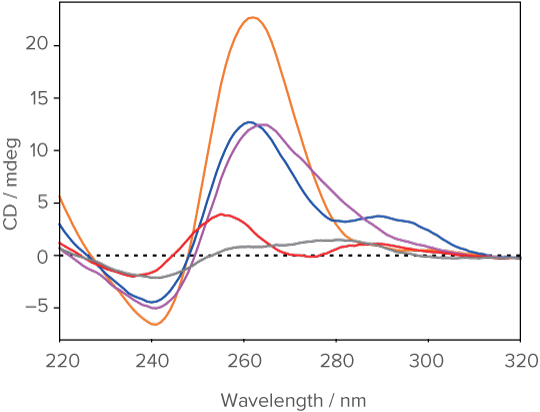
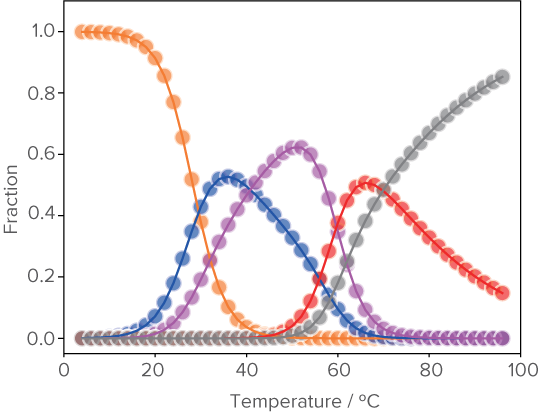
Analysis result of mixed structural states in insulin-binding aptamers
left) Temperature-dependent CD Spectra (3D CD Spectra), center) Spectra of pure components , and right) Concentration profiles
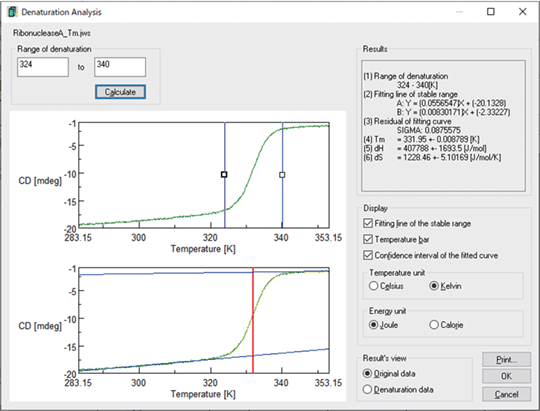
Denatured protein analysis program
This program evaluates a single protein substance in solution that is in equilibrium at a certain temperature, and enables calculation of the thermodynamic parameters (Tm, ΔH, ΔS) of its protein from the data with variable temperatures.
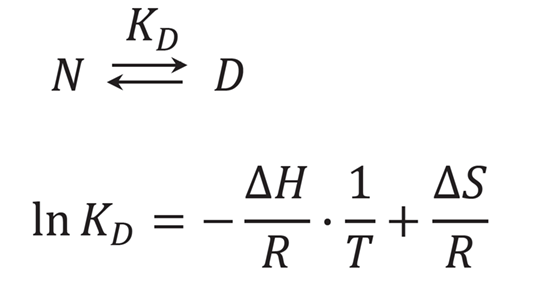
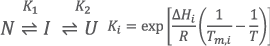
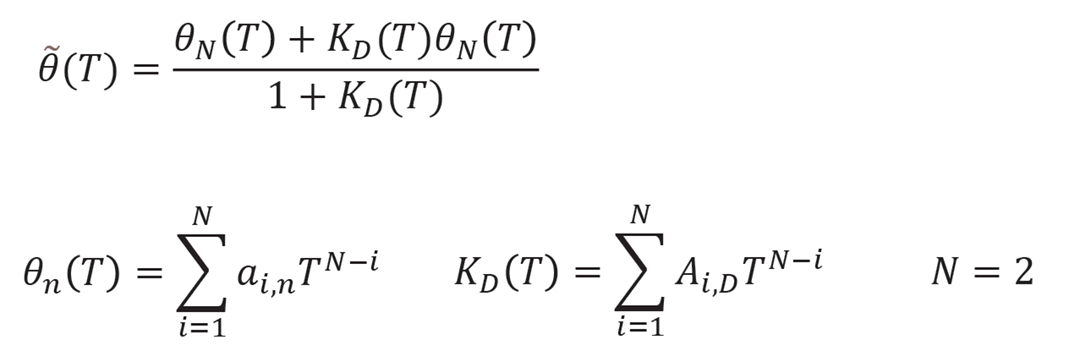
KD is the ratio of [N] and [D], and is calculated by using the experimental data, which is the measured CD values θi as a function of temperature Ti. This program approximates θi by the following equation, and calculates the KD.
Application
Denaturation study of the VHH antibody
Figure shows the denaturation curve of the CD at 217 nm which refl ects changes in β-sheet structure of the VHH antibody. Comparing the denaturation temperatures, it can be seen that the thermal stability of the samples decreases in the following order: No. 3, 1, and 2.
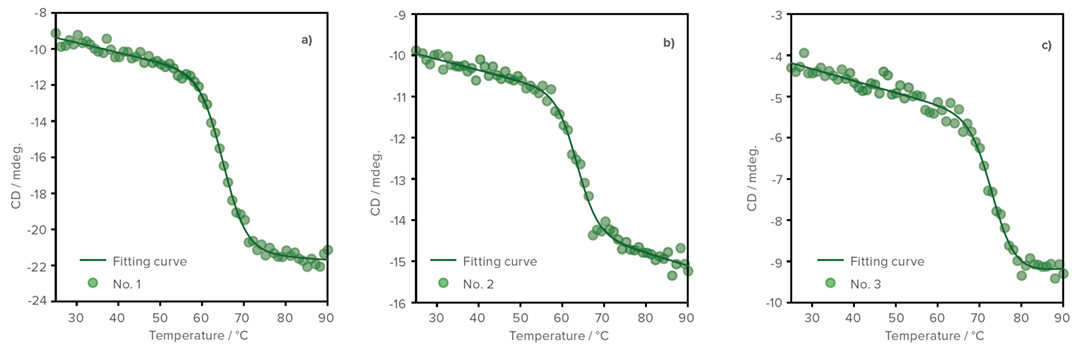
Temperature vs. CD denaturation curves
Anti-SARS-Cov-2 VHH antibody a) No. 1 (0.4 mg/mL), b) No. 2 (0.28 mg/mL), and c) No. 3 (0.2 mg/mL).