Introduction
IR Microscope has been widely used for the identification of object or for imaging measurement because of the capability of molecular structure analysis of the small object. The microscope ATR method not only makes measurement easy since no sample pre-treatment is necessary, but also is a power tool for the sample or particles as small as less than 5 mm, such as filler, which is in principle difficult to measure by the ordinary transmission / reflection method. However the normal microscope ATR method is not suitable for the measurement in case that sample moves or is crashed when the prism touches sample tightly, since the sample has to be located in the center of the prism while the direct observation of sample is impossible by such method. Microscope IRT-5000 and IRT-7000 are equipped with the standard smart mapping function, which enables the correct measurement even if the sample is not center-located. Furthermore, the Clear-View ATR (series of ATR-5000-S) is developed for observation of the sample even when the prism touches tightly the sample. This report describes the measurement of tiny object (the black particles in the facial cleanser) as a model sample of filler being contained in the fluid sample by using IRT-5000 and Clear-View type ATR (ATR-5000-SS).
By this experiment, the molecular structure of the black particles was clearly determined, and hence the functionality of the particles was estimated.
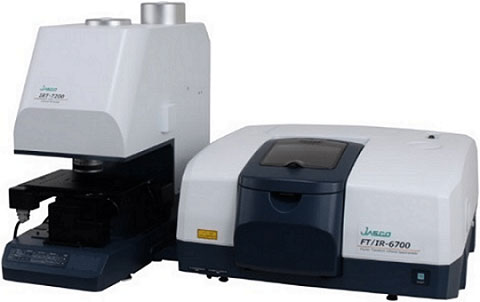
FTIR spectrometer with IR microscope
Experimental
The black particle in the liquid of the paste of the facial cleanser being marked by the red square as shown in Figure 1 was measured.
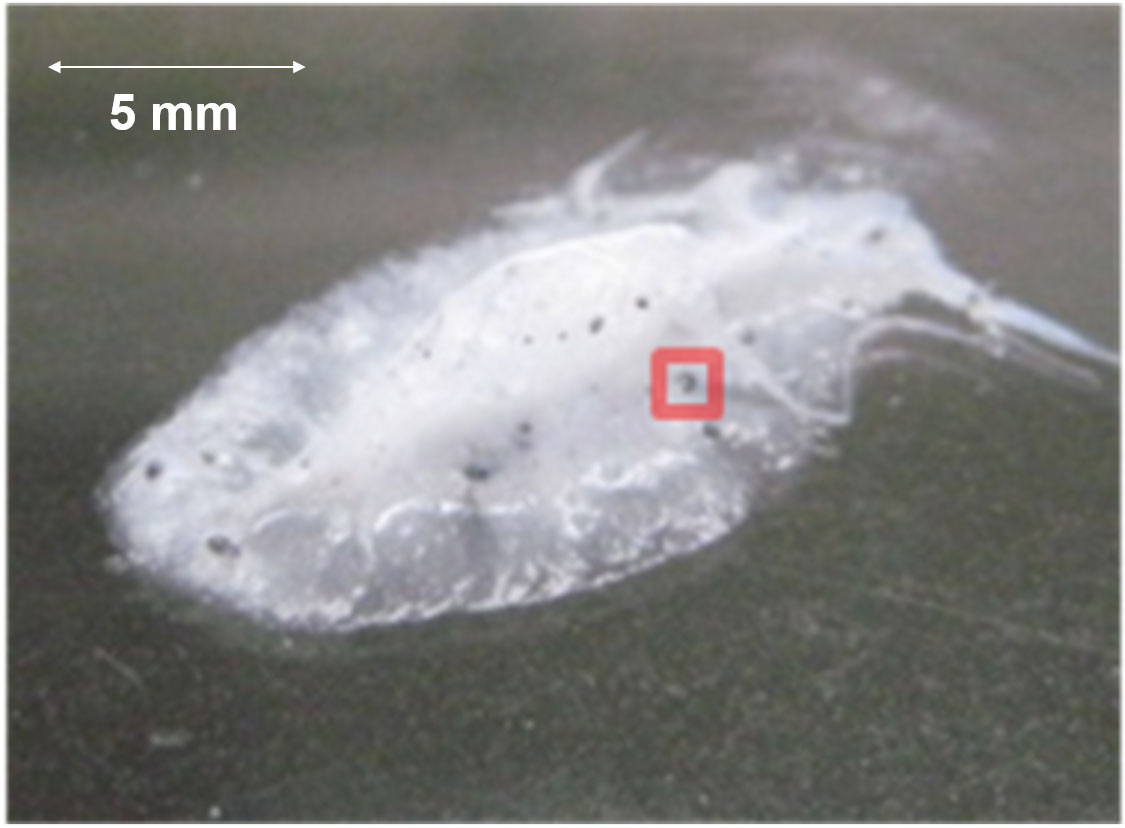
Figure 1. photo of facial cleanser
Measurement conditions
Instrument: FT/IR-6600+IRT-5200
Detector: Narrow-band MCT
Resolution: 8 cm-1
Accumulation: 16 times
Objective: ATR-5000-SS (ZnS Prism)
Measurement spot: 37 x 37 (Smart mapping)
Aperture size: 5 x 5 µm
Measurement area: 180 x 180 µm
The observation image in Figure 2 shows the state when ATR prism is touching the sample tightly. The scattered black particles due to tight contact can be observed through the clear-view ATR. IRT-5000 smart mapping function makes it possible to start the mapping measurement when viewing the sample.
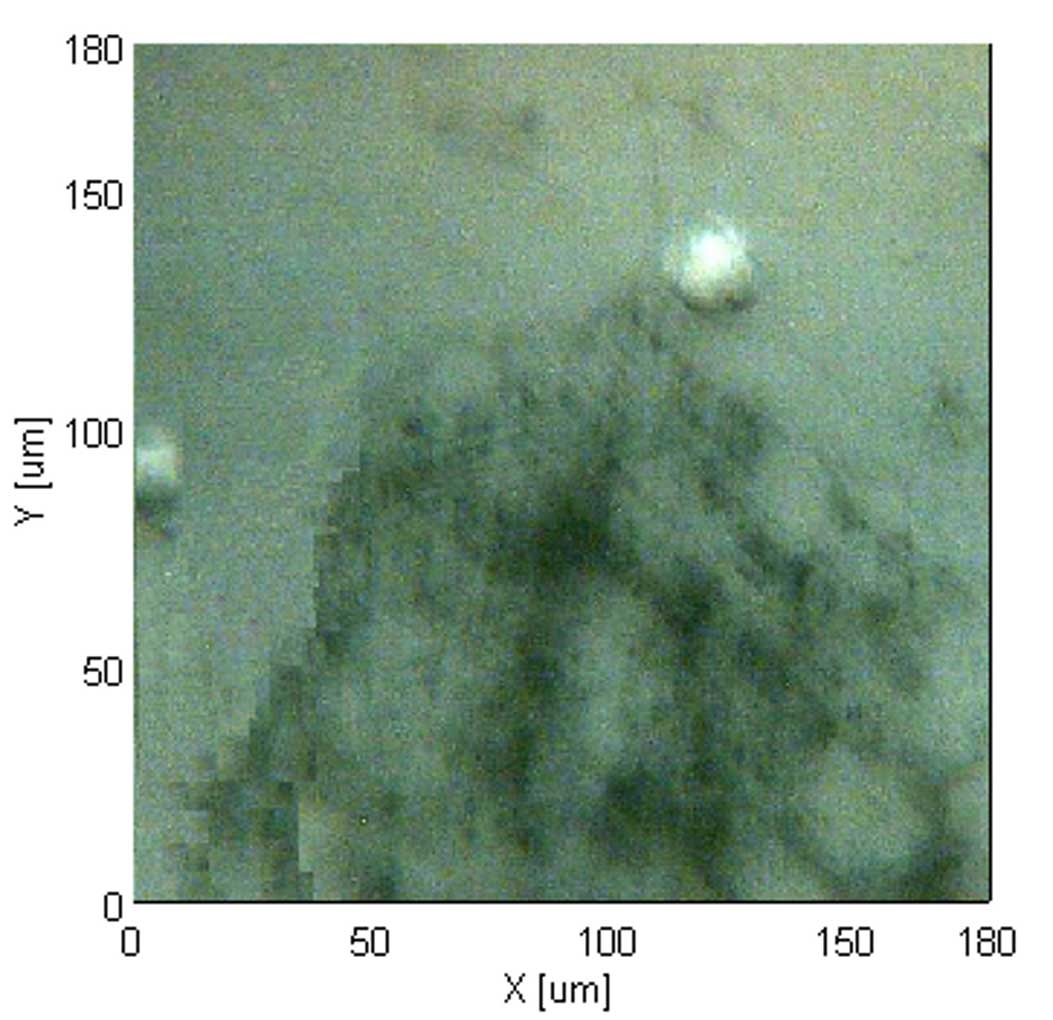
Figure 2. ATR-5000-SS Observation image
Results
Spectra of the paste part and black particles are shown in Figure 3 (Those spectra are processed by ATR correction for the possibility of abnormal dispersion).
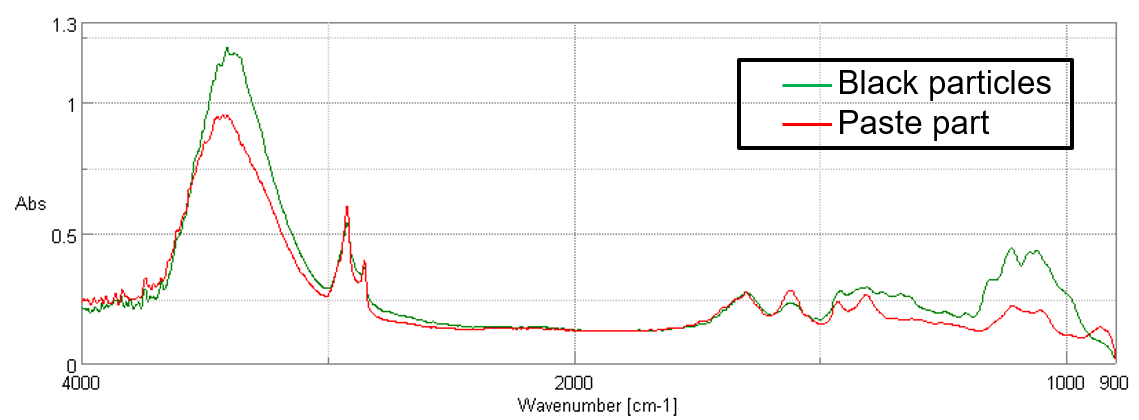
Figure 3. Spectra of the paste part and black particles (After ATR correction)
Judging from the spectra, the main component of both can be identified as Glycerin. The result of further database search for the subtraction of two spectra shows that the cellulose is contained in the black particle (Figure 4).
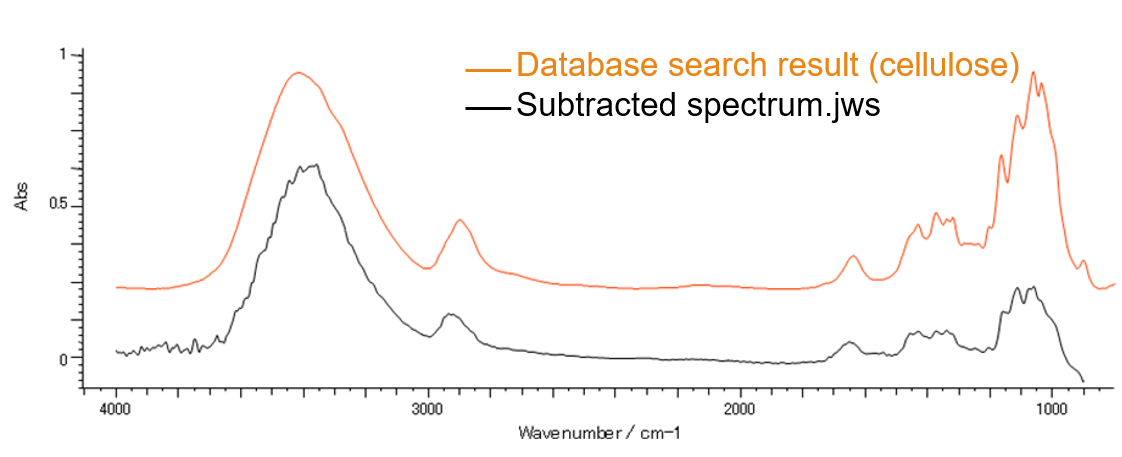
Figure 4. Database search result of the subtracted spectrum of Figure 3
The contour plot of the peak height at 1056 cm-1 ascribed to glycoside bond of cellulose is shown in Figure 5. It is confirmed that the cellulose is evenly distributed to where the black particles are scattered as seen in the observation image.
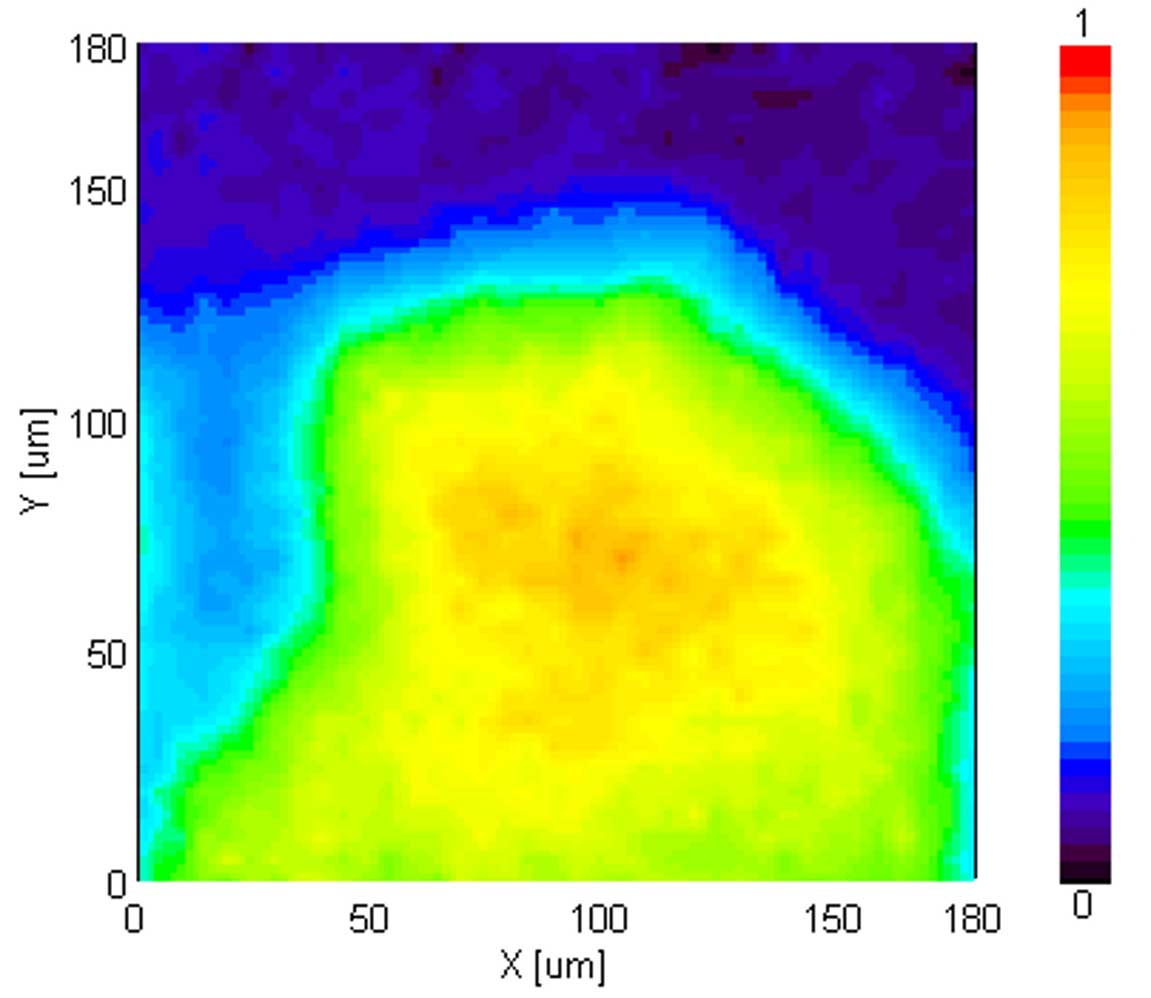
Figure 5. Peak of Cellulose(1056 cm-1) Contour plot of peak height


