Introduction
Infrared (IR) and Raman spectroscopies, each of which has its own unique characteristics, can be used in a complementary manner to analyze the structure of molecules from their molecular vibrations. IR spectroscopy is suitable for analyzing organic materials because of a large amount of information that can be acquired as well as abundant spectra in databases available. On the other hand, Raman spectroscopy shows higher spatial resolution than IR spectroscopy with its ease of measuring low wavenumber region, making it suitable for the analysis of smaller samples and inorganic materials. Therefore, measuring the same position by both methods should allow multifaceted analysis of the molecule. When measuring the same position by different microscopies, IQ Frame can be conveniently used because it can move to the same position with high positional accuracy at micron levels.
In this application note, we show measuring the same region of plastic particles collected on a membrane filter using IR and Raman microscopies.
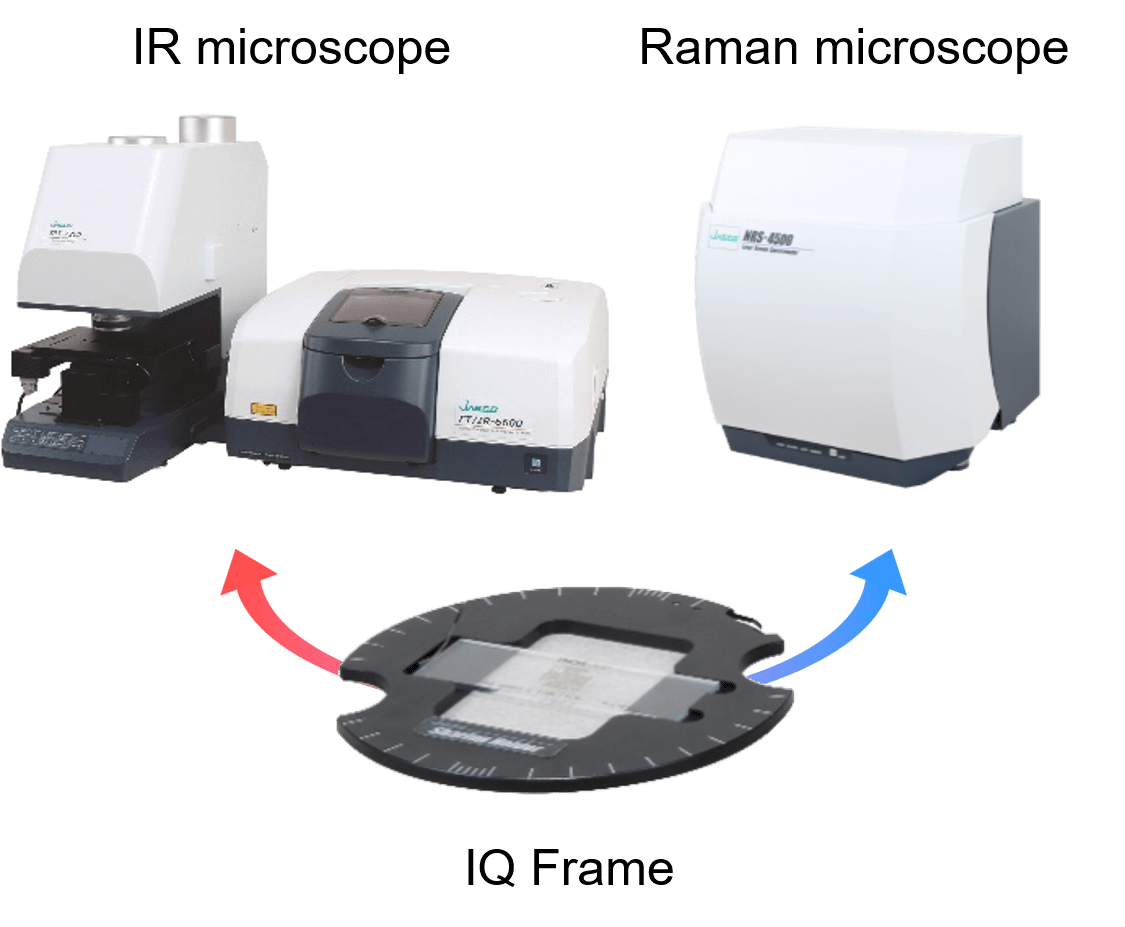
Fig. 1 Microscope configuration example and IQ Frame
Experimental
Plastic particles were dispersed in an organic solvent and then suction-filtered to collect them on a Teflon (PTFE) membrane filter. The filter was dried and then its same region was measured by high-speed imaging using IR and Raman microscopes. The region measured was approximately 530 x 300 μm, with IQ Frame used for aligning the region between the microscopes.
*Pretreatments such as chemical treatment (e.g., decomposition of organic materials with H2O2) and the separation by specific gravity (e.g., using NaI solution) etc. were applied to the plastics collected from the environment as necessary before the suction filtration.
Measurement conditions
<IR microscope>
Measurement method: Transmittance
Detector: Linear array MCT (16CH)
Resolution: 8 cm-1
Accumulation: 100
<Raman microscope>
Ex wavelength: 532 nm
Objective lens: 20x
Exposure time: 0.1 seconds
Accumulation: 1
Results
Results of imaging measurements on the same region by IR and Raman microscopes
Figure 2 shows optical and chemical images as well as typical spectra obtained with the IR and Raman microscopes. The optical images confirm that the same region could be measured by IR and Raman microscopes. A database search for spectra revealed that the IR microscope specifically found the base material information for polyethylene (PE) particles, while Raman microscope specifically detected yellow and blue components of pigments in the particles. The chemical images were generated using the peak height of the key band of each component as indicated by arrows in the spectra. The chemical images confirmed that even small particles of μm levels in sizes, which are difficult to detect by IR microscope, could be detected by Raman microscope. Thus, the combinatorial analysis with IR and Raman microscopes allowed us to obtain a wealth of information that are unable to obtain with either microscope only.
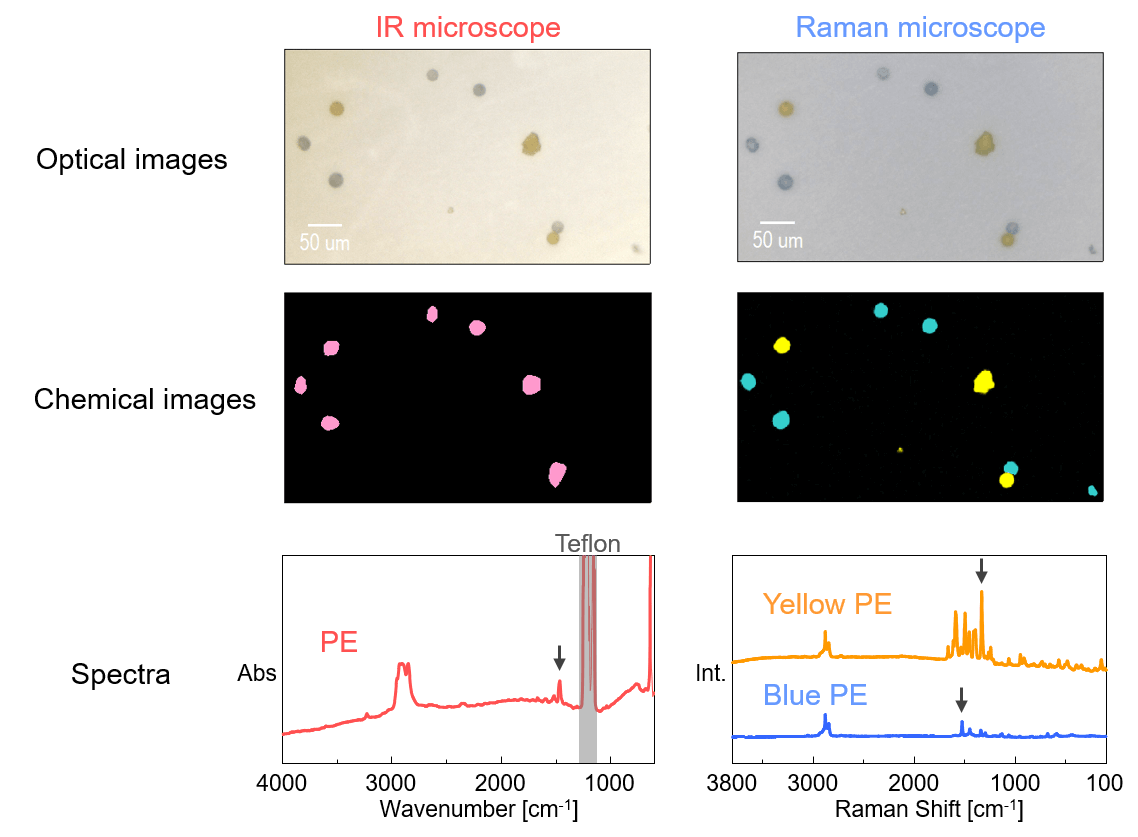
Fig. 2 Imaging measurement results
Results of particle analysis
Figure 3 shows the results of measuring particle sizes based on the chemical image obtained from the measurement by Raman microscope, as well as the histograms of size distribution with calculated ratios of components. A stacked histogram by sizes confirmed that the blue PE tends to be more uniform than yellow PE in sizes. Although only visually countable small number of particles could be detected in this experiment, this analysis method is particularly effective for detecting a large number of particles.
A software for analyzing particle sizes, JASCO Particle Analysis (JPA), was used to measure particle sizes as well as generating histograms with calculated ratios of components. The JPA performs particle analysis on not only on optical images but also on chemical images. Its ability to acquire particle information for each component facilitates the generation of stacked histograms and the calculation of the ratio of components.
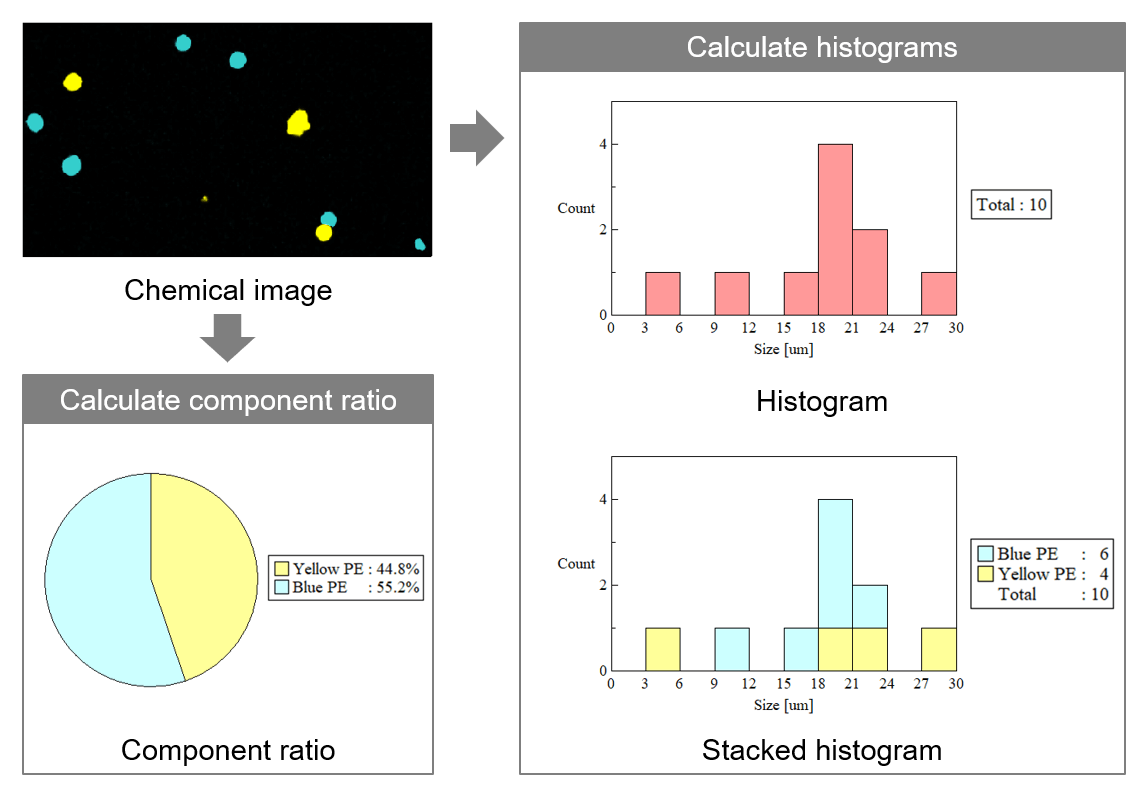
Fig. 3 Particle analysis results
Conclusion
We collected plastic particles in liquid on a membrane filter and measured them by IR and Raman microscopes. The use of IQ Frame enabled easy and quick measurement of the same region with different microscopes. The JPA is convenient to use for particle analysis. We believe that this analysis method provides a wide variety of utilities, including the analysis of foreign materials in liquids such as beverages or chemicals, as well as the analysis of microplastics.


