Introduction
Foreign small substances in a liquid are sometimes measured after being collected on a suction filtration membrane. The pore size of the membrane filter can determine the size of the substances. This method can be applied to the collection of foreign small substances in oil, contaminants in beverages, and microplastics in the sea and rivers among other things. The recovered samples can be measured by infrared (IR) microscope or Raman microscope.
This article shows the accurate results of IR microscope imaging measurement of the residue in well water deposited on a suction filtration membrane.
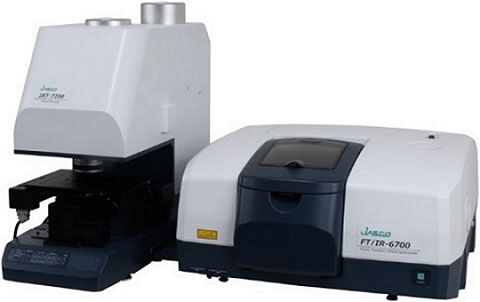
IR microscope system (FT/IR-6700 + IRT-7200)
Experimental
<Sampling methods>
- 5 L of well water was suction filtrated.
- For suction filtration, used the suction filtration set shown in Figure 1 and an aspirator.
- Details of membrane filter used
- Material : Teflon (PTFE)
- Size : ϕ25 μm
- Pore size : 10 μm
- The membrane filter that the residue was collected was dried and used for measurement.
* Before suction filtration, perform pretreatment if necessary.
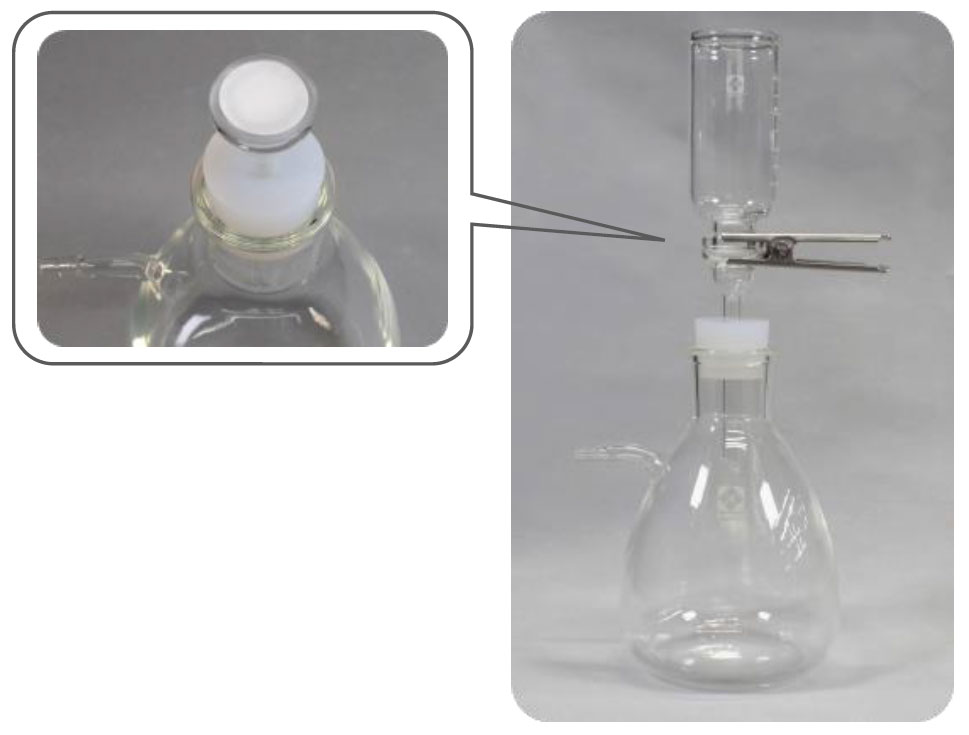
Figure 1 With the membrane filter attached to the suction filtration set
<Measurement conditions>
Main unit : FT/IR-6600 + IRT-7200
Measurement method : Transmittance
Detector : Linear array MCT (16CH)
Resolution : 8 cm-1
Accumulation : 32 times
Measurement region : 400 x 400 μm
Results
As a result of imaging measurement by IR microscope, cellulose was detected in this measured area. This cellulose is presumed to be the fragmentation of plant pieces that has fallen into the well over time. Figure 2 showed the representative spectrum obtained by imaging measurement and its database search result, and Figure 3 showed the observed image and result of creating a chemical image of cellulose using the peak height indicated by the arrow in the spectrum. Although the presence of cellulose cannot be identified from the observation image, the distribution of cellulose could be visualized by measuring by IR microscope and creating chemical image.
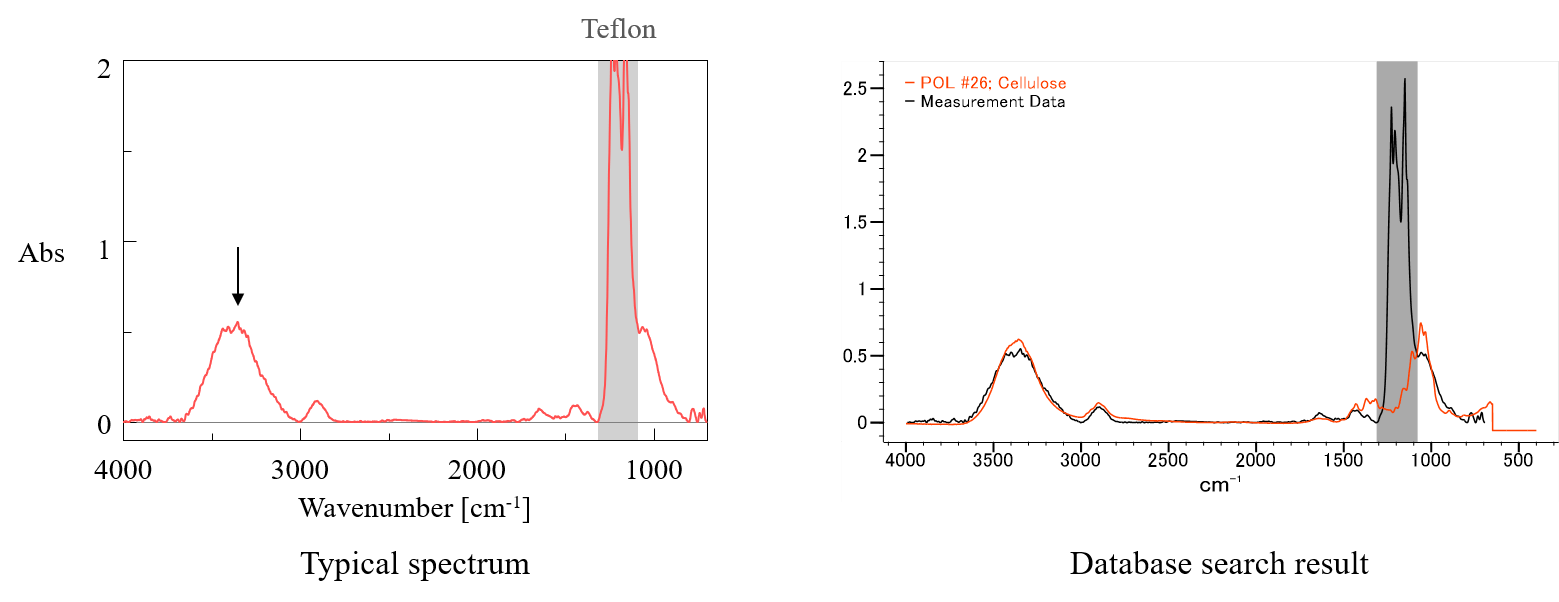
Figure 2 Spectrum and database search result
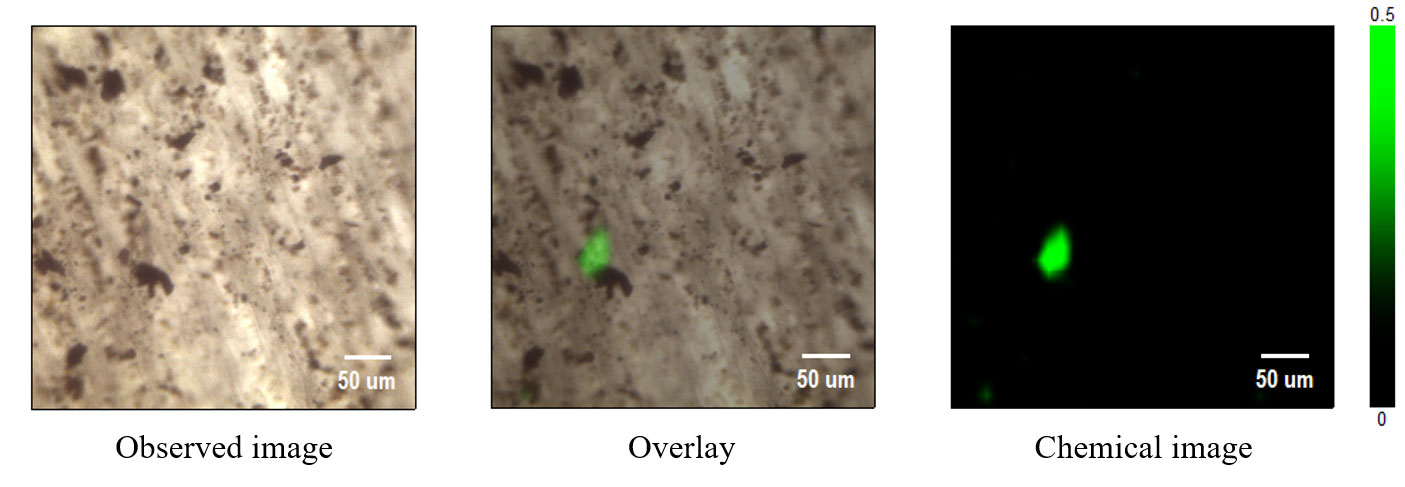
Figure 3 Observed image and chemical image
Conclusion
It was shown that an example of measuring a sample collected by suction filtration with IR microscope. For small samples of several μm, measurement by Raman microscope after sampling in the same way may be effective. The sampling and measurement methods shown here are effective for easily and quickly collecting and analyzing small substances in liquids that were difficult to collect visually or under a microscope.


