Introduction
Phenols are used as preservatives, and the phenols that flow into raw tap water from factory wastewater react with chlorine used as a disinfectant and produce chlorophenols. Chlorophenols give drinking water bad smell and taste, so they are one of the water quality standards defined by the Water Supply Act in Japan from the viewpoint of preventing the generation of bad smell. Solid-phase extraction-liquid chromatography-mass spectrometry has been adopted as the measurement method.
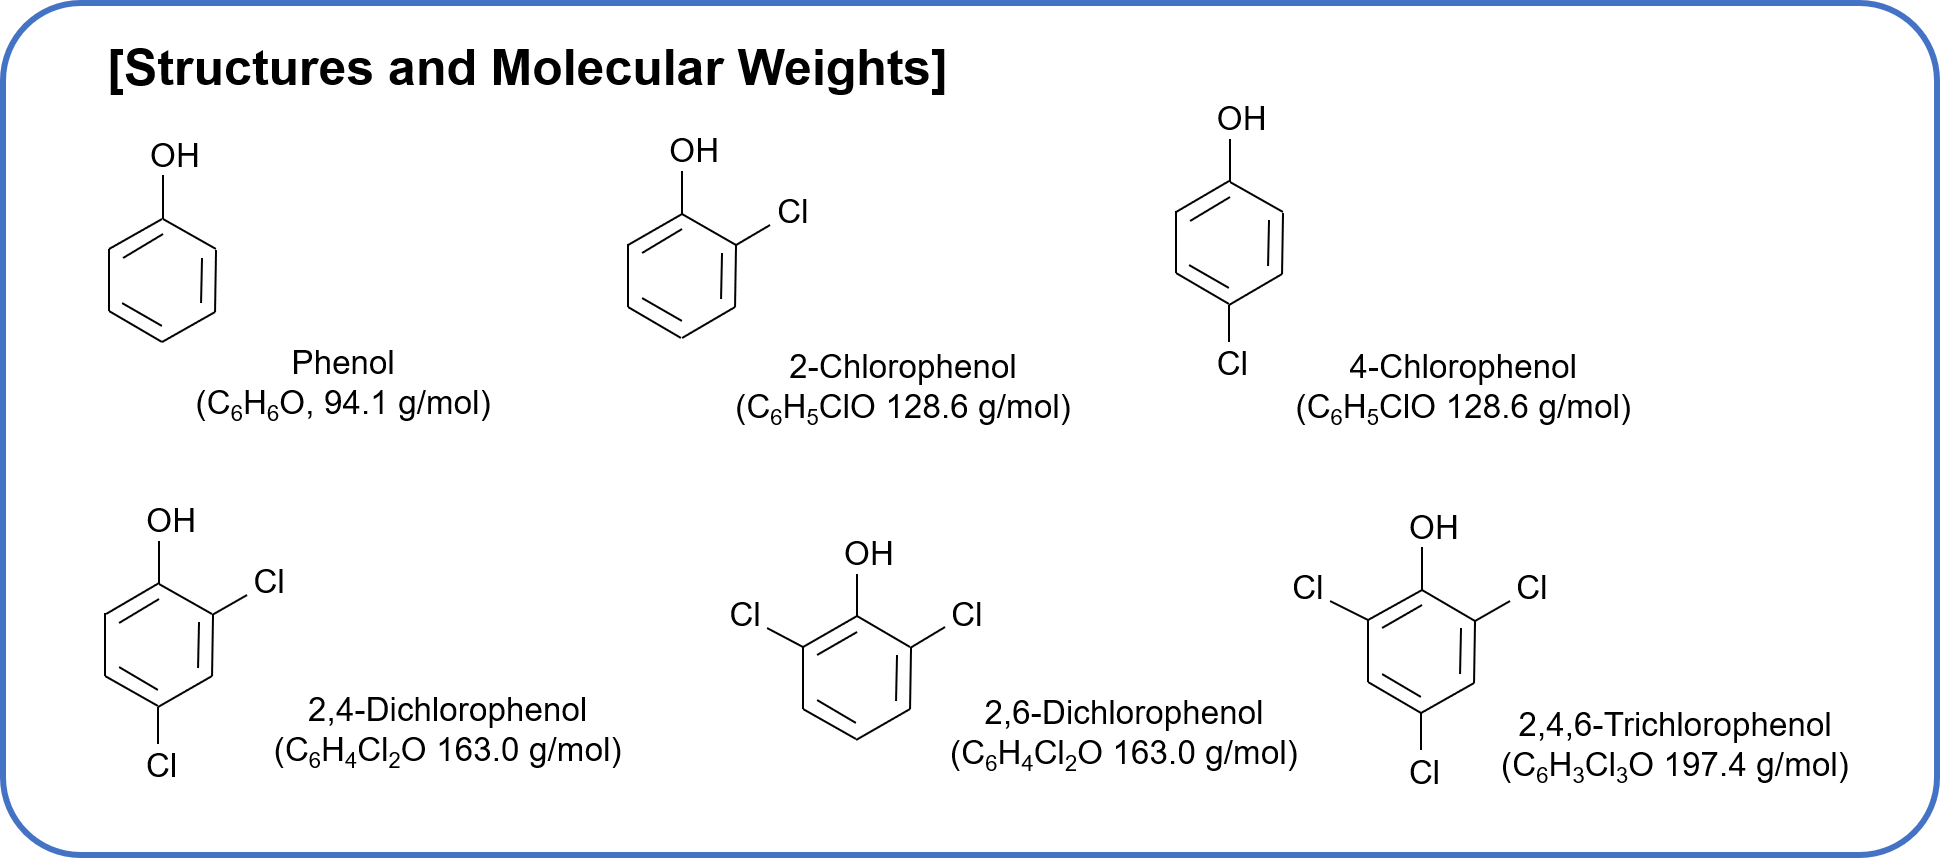
The standard value for phenols is 0.005 mg/L or less for the total of phenol, 2-chlorophenol, 4-chlorophenol, 2,4-dichlorophenol, 2,6-dichlorophenol, and 2,4,6-trichlorophenol (converted to phenol). In addition, the quantification limit is 0.0005 mg/L, one-tenth of the standard value, and the reproducibility is 20 % or less.
In this report, we examined the measurement of phenols in tap water by LC/MS/MS using a SCIEX triple quadrupole mass spectrometer (Tripe Quad™ 3500) as a detector, and also conducted recovery tests by solid-phase extraction (SPE).
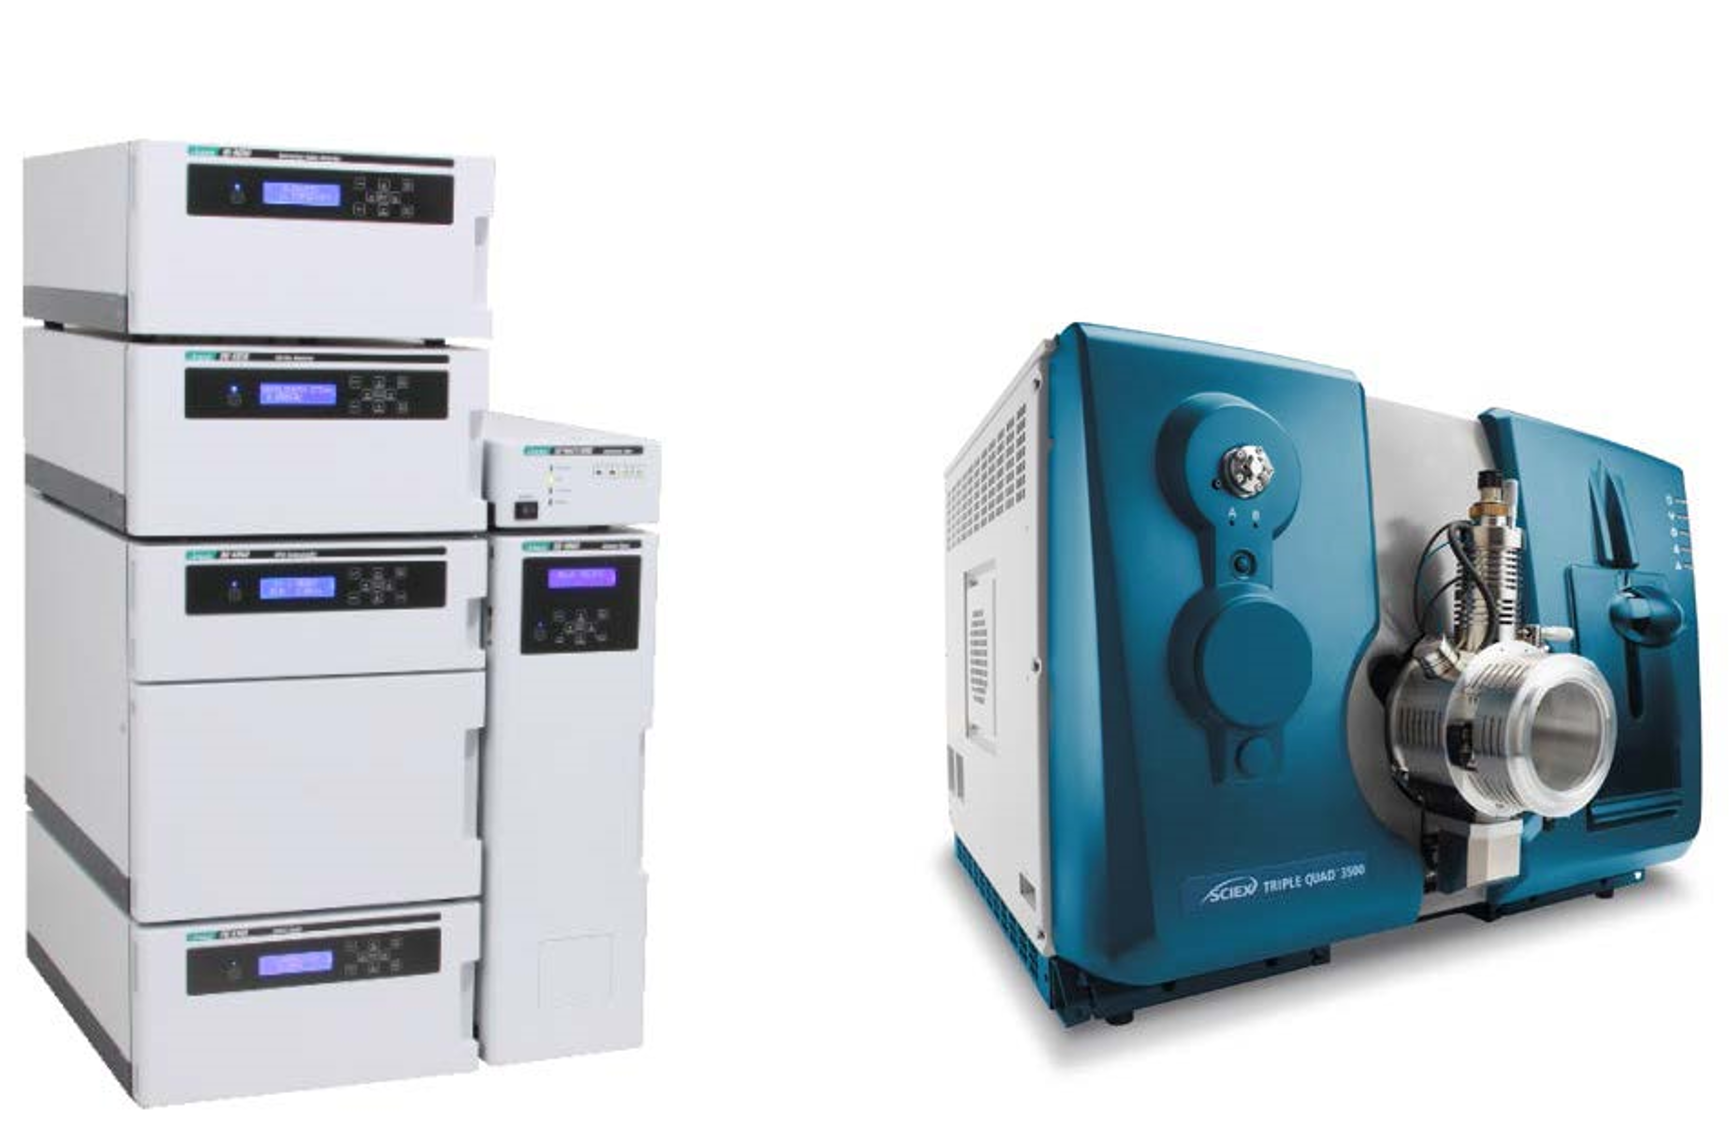
LC-4000 HPLC system (left) and Tripe Quad™ 3500 triple quadrupole mass spectrometer (right)
Experimental
[HPLC Conditions]
Column: InertSustain C18 HP (2.1 mm I.D. x 100 mm L, 3 µm)
Eluent A: Water
Eluent B: Methanol
Gradient: A/B = 60/40 (0.00 min.)
–> 10/90 (6.00 min.)
–> 10/90 (8.00 min.)
–> 60/40 (8.05 min.) , 1 cycle; 12 min.
Flow rate: 0.4 mL/min.
Column temp.: 40 ºC
Injection volume: 50 µL
Standard: Mixture of phenol, 2-chlorophenol, 4- chlorophenol, 2,4-dichlorophenol, 2,6- dichlorophenol, and 2,4,6-trichlorophenol in 20 % methanol (4 µg/L, 10 µg/L, 20 µg/L, 40 µg/L, 80 µg/L each)
[MS Conditions]
Ionization: APCI, Negative
Temperature: 400 ºC
MRM:
Q1/Q3 (93.0/65.0) for phenol
Q1/Q3 (126.9/90.9) for chlorophenol
Q1/Q3 (160.8/124.9) for dichlorophenol
Q1/Q3 (194.8/158.7) for trichlorophenol
Keywords
phenols, water quality standard, SPE, triple quadrupole mass spectrometer, LC/MS/MS
Results
Figure 1 shows the measurement result of standard mixture of 6 phenols (4 µg/L each). Since the test water (tap water) is finally concentrated by 50 times with SPE as described below (refer to Figure 3), the range of the calibration curve was also set to the concentration after 50 times concentration.
The concentrations per one component calculated from the reference values are shown in Table 1. In this experiment, the minimum and maximum concentrations of each component were set to 4 µg/L and 80 µg/L, respectively, and calibration curves were prepared at a total of five points (Figure 2). All components showed good linearity with more than 0.9999 of correlation coefficients (r) in the range of 4 µg/L to 80 µg/L.
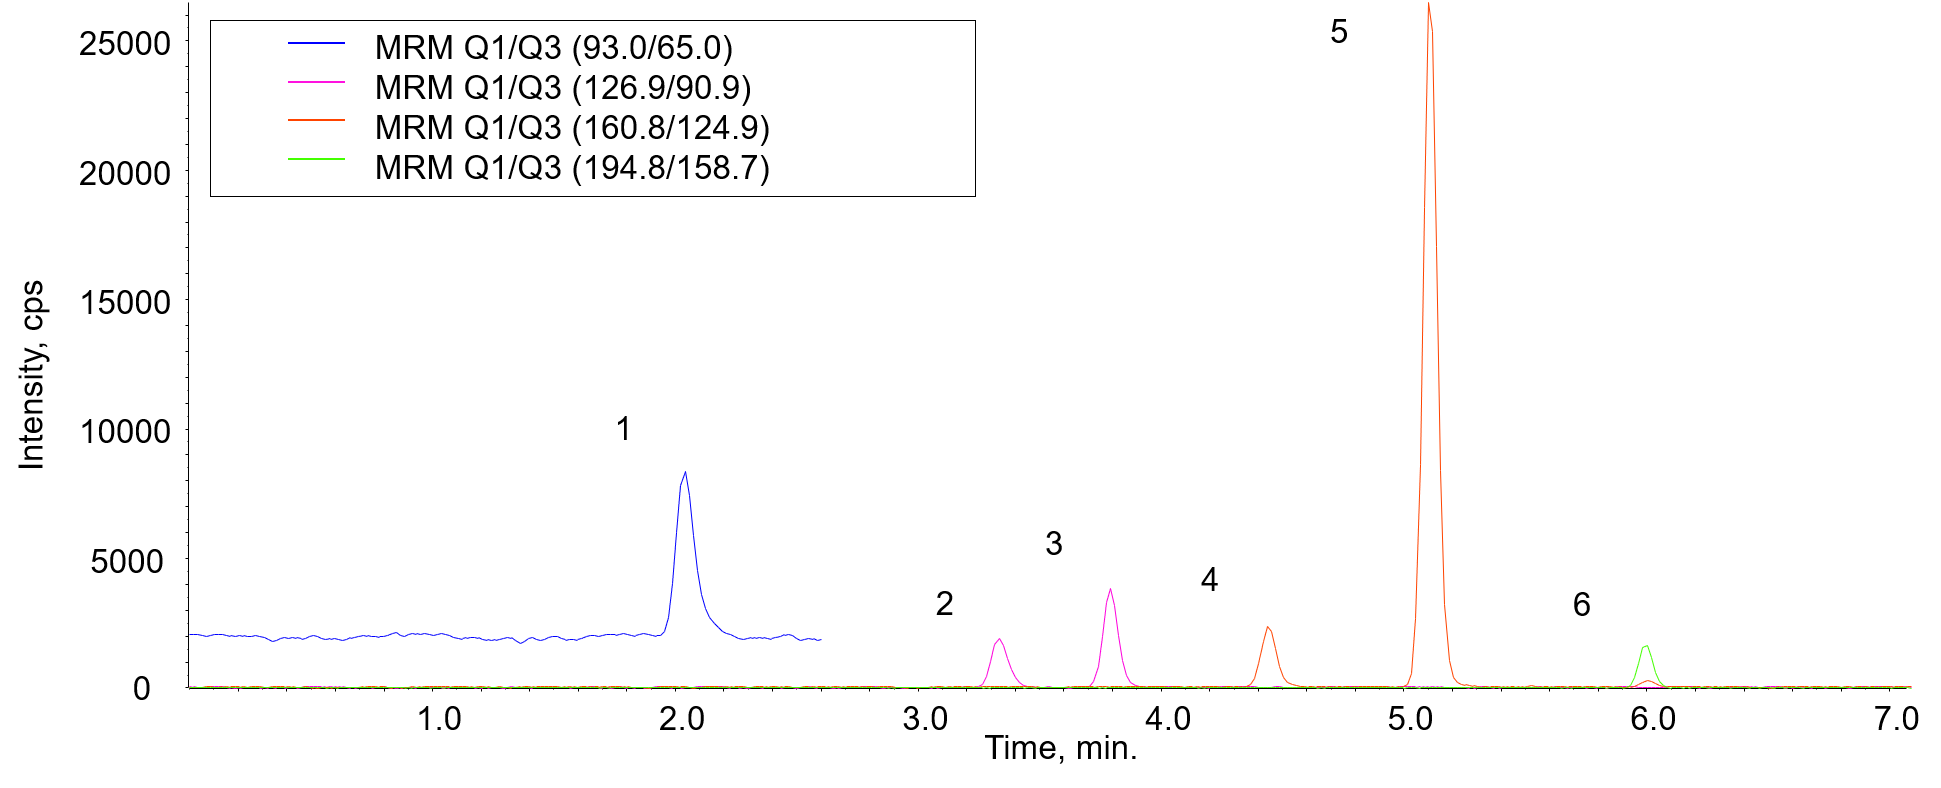
Fig. 1 Chromatograms of standard mixture of 6 phenols (4 µg/L each)
1: Phenol, 2: 2-Chlorophenol, 3: 4-Chlorophenol, 4: 2,6-Dichlorophenol, 5: 2,4-Dichlorophenol, 6: 2,4,6-Trichlorophenol
Table 1 Concentration range of calibration curves calculated from standard values of 6 phenols
| Concentration of test water | Concentration after concentrating by 50 times | ||
| Standard values | Sum of 6 components | 0.005 mg/L | 0.25 mg/L |
| 1 component | 0.833 µg/L | 41.6 µg/L | |
| One-tenth of standard values | Sum of 6 components | 0.0005 mg/L | 0.025 mg/L |
| 1 component | 0.0833 µg/L | 4.16 µg/L | |
| Range of calibration curves | Sum of 6 components | 0.0005 – 0.01 mg/L | 0.025 – 0.5 mg/L |
| 1 component | 0.0833 – 1.66 µg/L | 4.16 – 83.3 µg/L | |
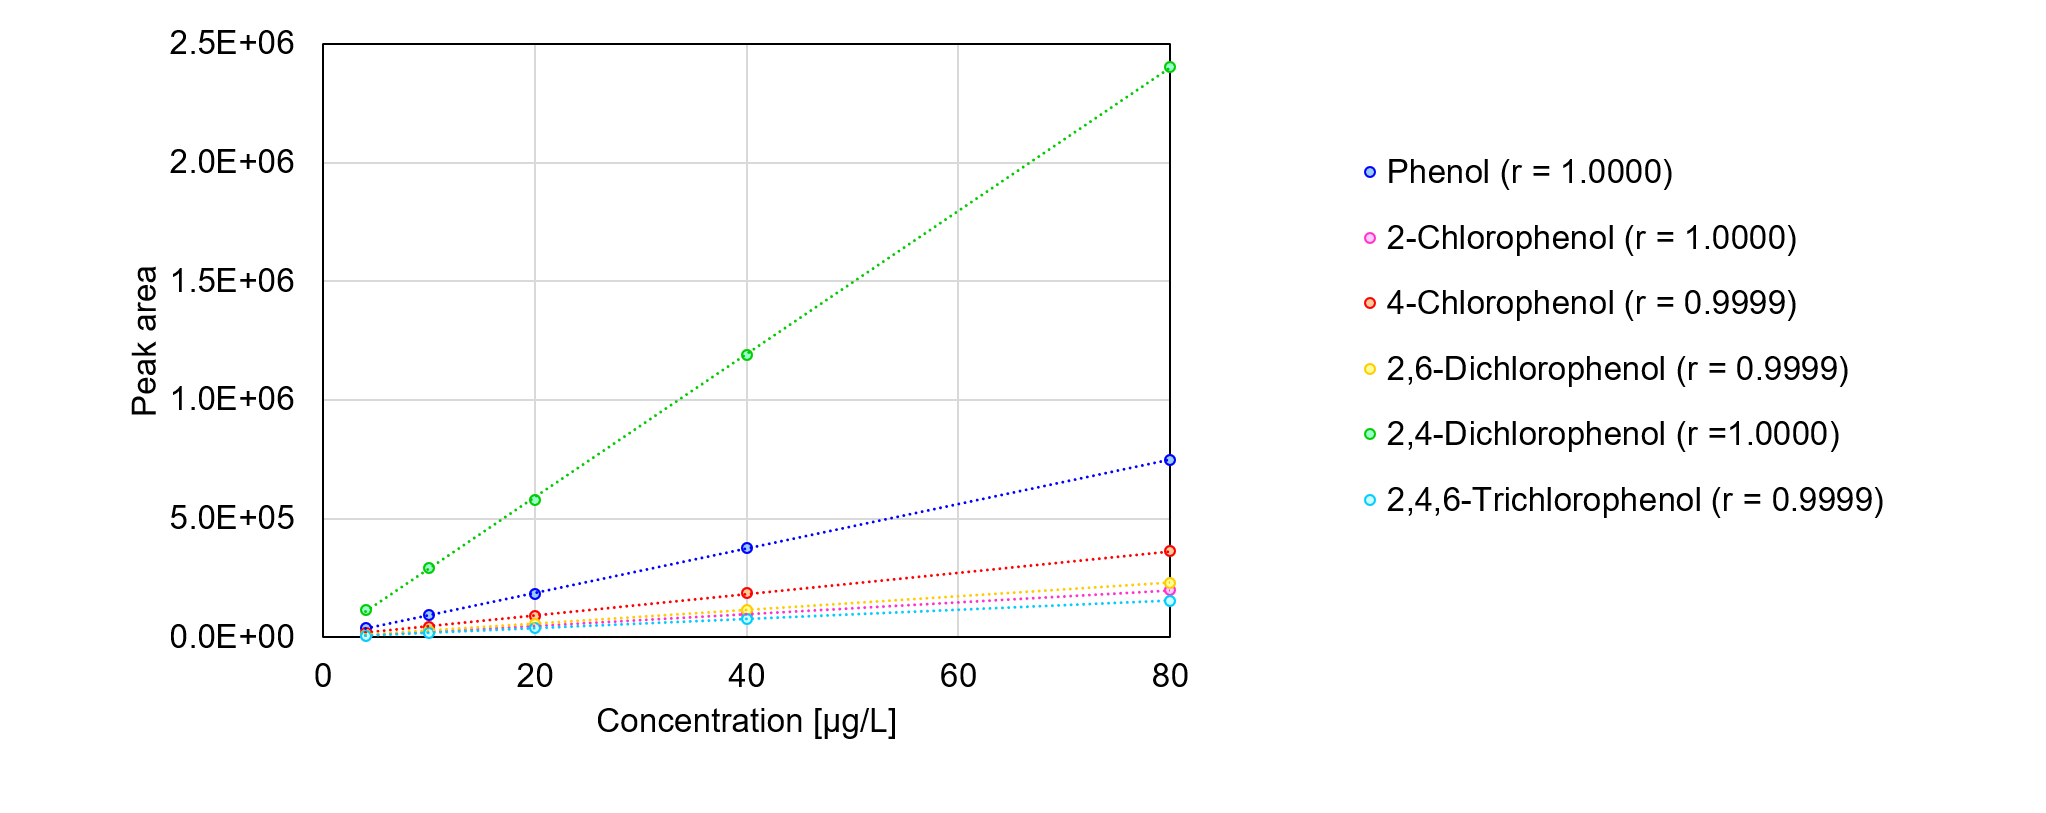
Fig. 2 Calibration curves of 6 phenols
Tables 2-1 and 2-2 show the reproducibilities of 6 phenols at 4 µg/L (one-tenth of the standard value) and at 40 µg/L (standard value), respectively. At both concentrations of all of the components, good reproducibilities of retention time and peak area were obtained with less than 0.1 % and less than 3.5 %, respectively.
Table 2-1 Reproducibilities of retention time and peak area for 6 phenols at 4 µg/L (n = 5)
| Number of Injection | Phenol | 2-Chlorophenol | 4-Chlorophenol | 2,6-Dichlorophenol | 2,4-Dichlorophenol | 2,4,6-Trichlorophenol | ||||||
| tR [min.] | Peak area | tR [min.] | Peak area | tR [min.] | Peak area | tR [min.] | Peak area | tR [min.] | Peak area | tR [min.] | Peak area | |
| 1 | 2.036 | 38279 | 3.327 | 9384 | 3.784 | 16775 | 4.432 | 10165 | 5.093 | 109970 | 5.987 | 7074 |
| 2 | 2.034 | 37435 | 3.328 | 9071 | 3.783 | 17482 | 4.435 | 10316 | 5.095 | 110363 | 5.988 | 7088 |
| 3 | 2.035 | 36444 | 3.327 | 9140 | 3.783 | 17132 | 4.434 | 9931 | 5.095 | 109513 | 5.991 | 7180 |
| 4 | 2.036 | 34962 | 3.330 | 9292 | 3.784 | 17096 | 4.436 | 10274 | 5.097 | 107687 | 5.993 | 7091 |
| 5 | 2.039 | 36556 | 3.333 | 9161 | 3.787 | 17683 | 4.439 | 10006 | 5.099 | 109612 | 5.992 | 6998 |
| Average | 2.036 | 36735 | 3.329 | 9210 | 3.784 | 17234 | 4.435 | 10138 | 5.096 | 109429 | 5.990 | 7086 |
| SD | 0.0018 | 1238 | 0.0024 | 126 | 0.0018 | 355 | 0.0026 | 167 | 0.0023 | 1029 | 0.0025 | 65 |
| RSD [%] | 0.09 | 3.37 | 0.07 | 1.37 | 0.05 | 2.06 | 0.06 | 1.65 | 0.04 | 0.94 | 0.04 | 0.91 |
Table 2-2 Reproducibilities of retention time and peak area for 6 phenols at 40 µg/L (n = 5)
| Number of Injection | Phenol | 2-Chlorophenol | 4-Chlorophenol | 2,6-Dichlorophenol | 2,4-Dichlorophenol | 2,4,6-Trichlorophenol | ||||||
| tR [min.] | Peak area | tR [min.] | Peak area | tR [min.] | Peak area | tR [min.] | Peak area | tR [min.] | Peak area | tR [min.] | Peak area | |
| 1 | 2.036 | 355478 | 3.328 | 96217 | 3.784 | 180911 | 4.434 | 109138 | 5.096 | 1155512 | 5.992 | 73093 |
| 2 | 2.037 | 346721 | 3.329 | 96440 | 3.784 | 177898 | 4.436 | 108470 | 5.097 | 1138848 | 5.993 | 74427 |
| 3 | 2.039 | 353827 | 3.334 | 96966 | 3.788 | 177861 | 4.440 | 106588 | 5.100 | 1162063 | 5.995 | 73903 |
| 4 | 2.039 | 348322 | 3.336 | 95948 | 3.790 | 178218 | 4.440 | 108454 | 5.101 | 1138471 | 5.995 | 75093 |
| 5 | 2.038 | 359943 | 3.333 | 96558 | 3.787 | 180877 | 4.440 | 105689 | 5.100 | 1135895 | 5.994 | 74405 |
| Average | 2.038 | 352858 | 3.332 | 96426 | 3.786 | 179153 | 4.438 | 107668 | 5.099 | 1146158 | 5.994 | 74184 |
| SD | 0.0014 | 5391 | 0.0033 | 381 | 0.0026 | 1595 | 0.0027 | 1458 | 0.0020 | 11814 | 0.0013 | 742 |
| RSD [%] | 0.07 | 1.53 | 0.10 | 0.40 | 0.07 | 0.89 | 0.06 | 1.35 | 0.04 | 1.03 | 0.02 | 1.00 |
Figure 3 shows the pretreatment procedure for the concentration of test water (tap water) by SPE. SPE cartridge used was InertSep Slim-J PLS-3 filled with nitrogen-containing methacrylate-styrene divinylbenzene polymer (manufactured by GL Sciences).
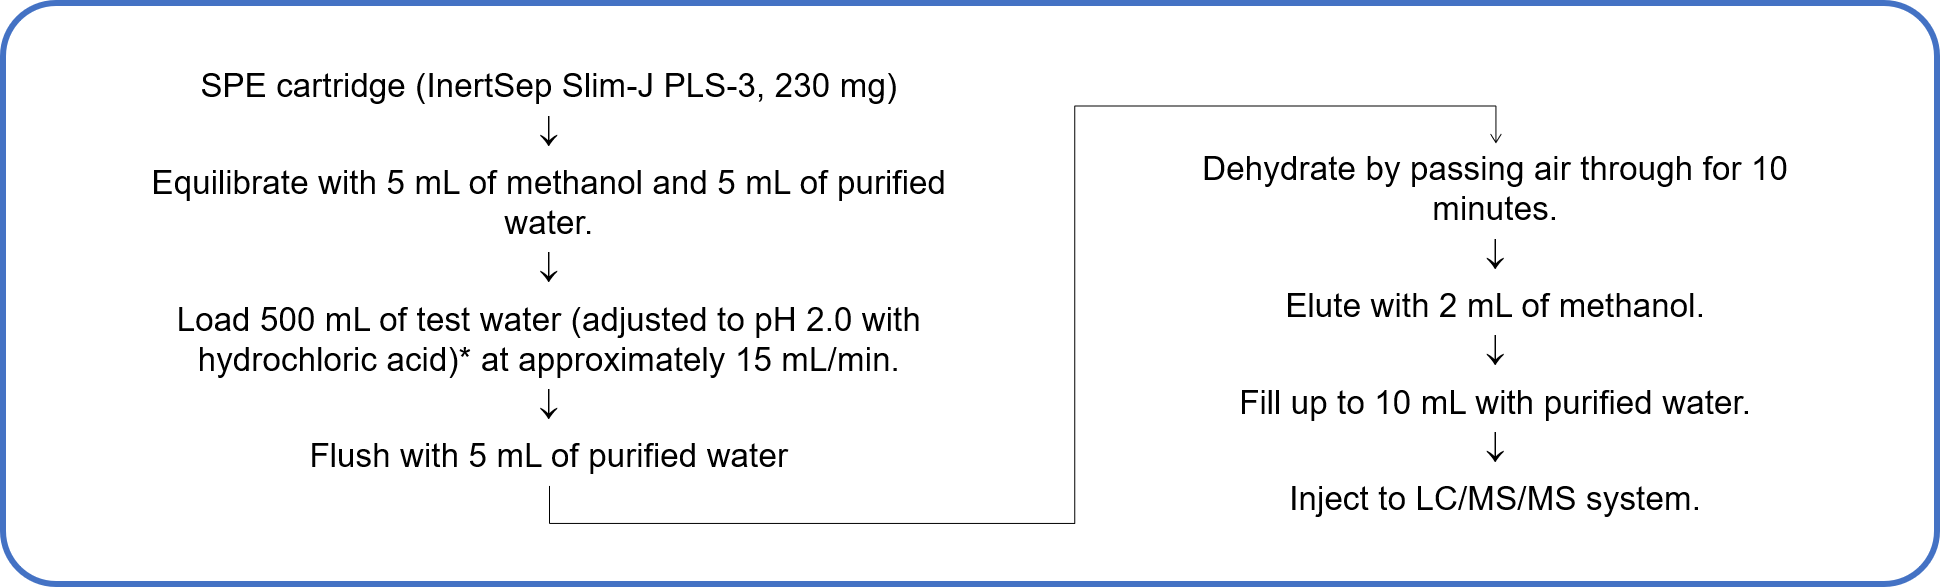
Fig. 3 Procedure for concentration of test water by solid phase extraction (50 times concentration)
* If residual chlorine is included, add sodium ascorbate (0.01-0.02 g/mg Cl2 as a guide). 5 mg of sodium ascorbate was added in this experiment.
Sample pretreatment was carried out according to the procedure shown in Figure 3 for three samples: tap water only, tap water containing standard mixture of 6 phenols (4 µg/L each, one-tenth of the standard value; 0.08 µg/L in test water), and tap water containing standard mixture of 6 phenols (40 µg/L each, standard value; 0.8 µg/L in test water).
Figure 4 shows the results of each sample. In the tap water, phenol and 2,6-dichlorophenol were detected at concentrations lower than one-tenth of the standard value. As shown in Table 3, good recovery rates of 85 % to 107 % were obtained for all phenols detected in both tap water samples containing 4 µg/L and 40 µg/L of standard mixture.
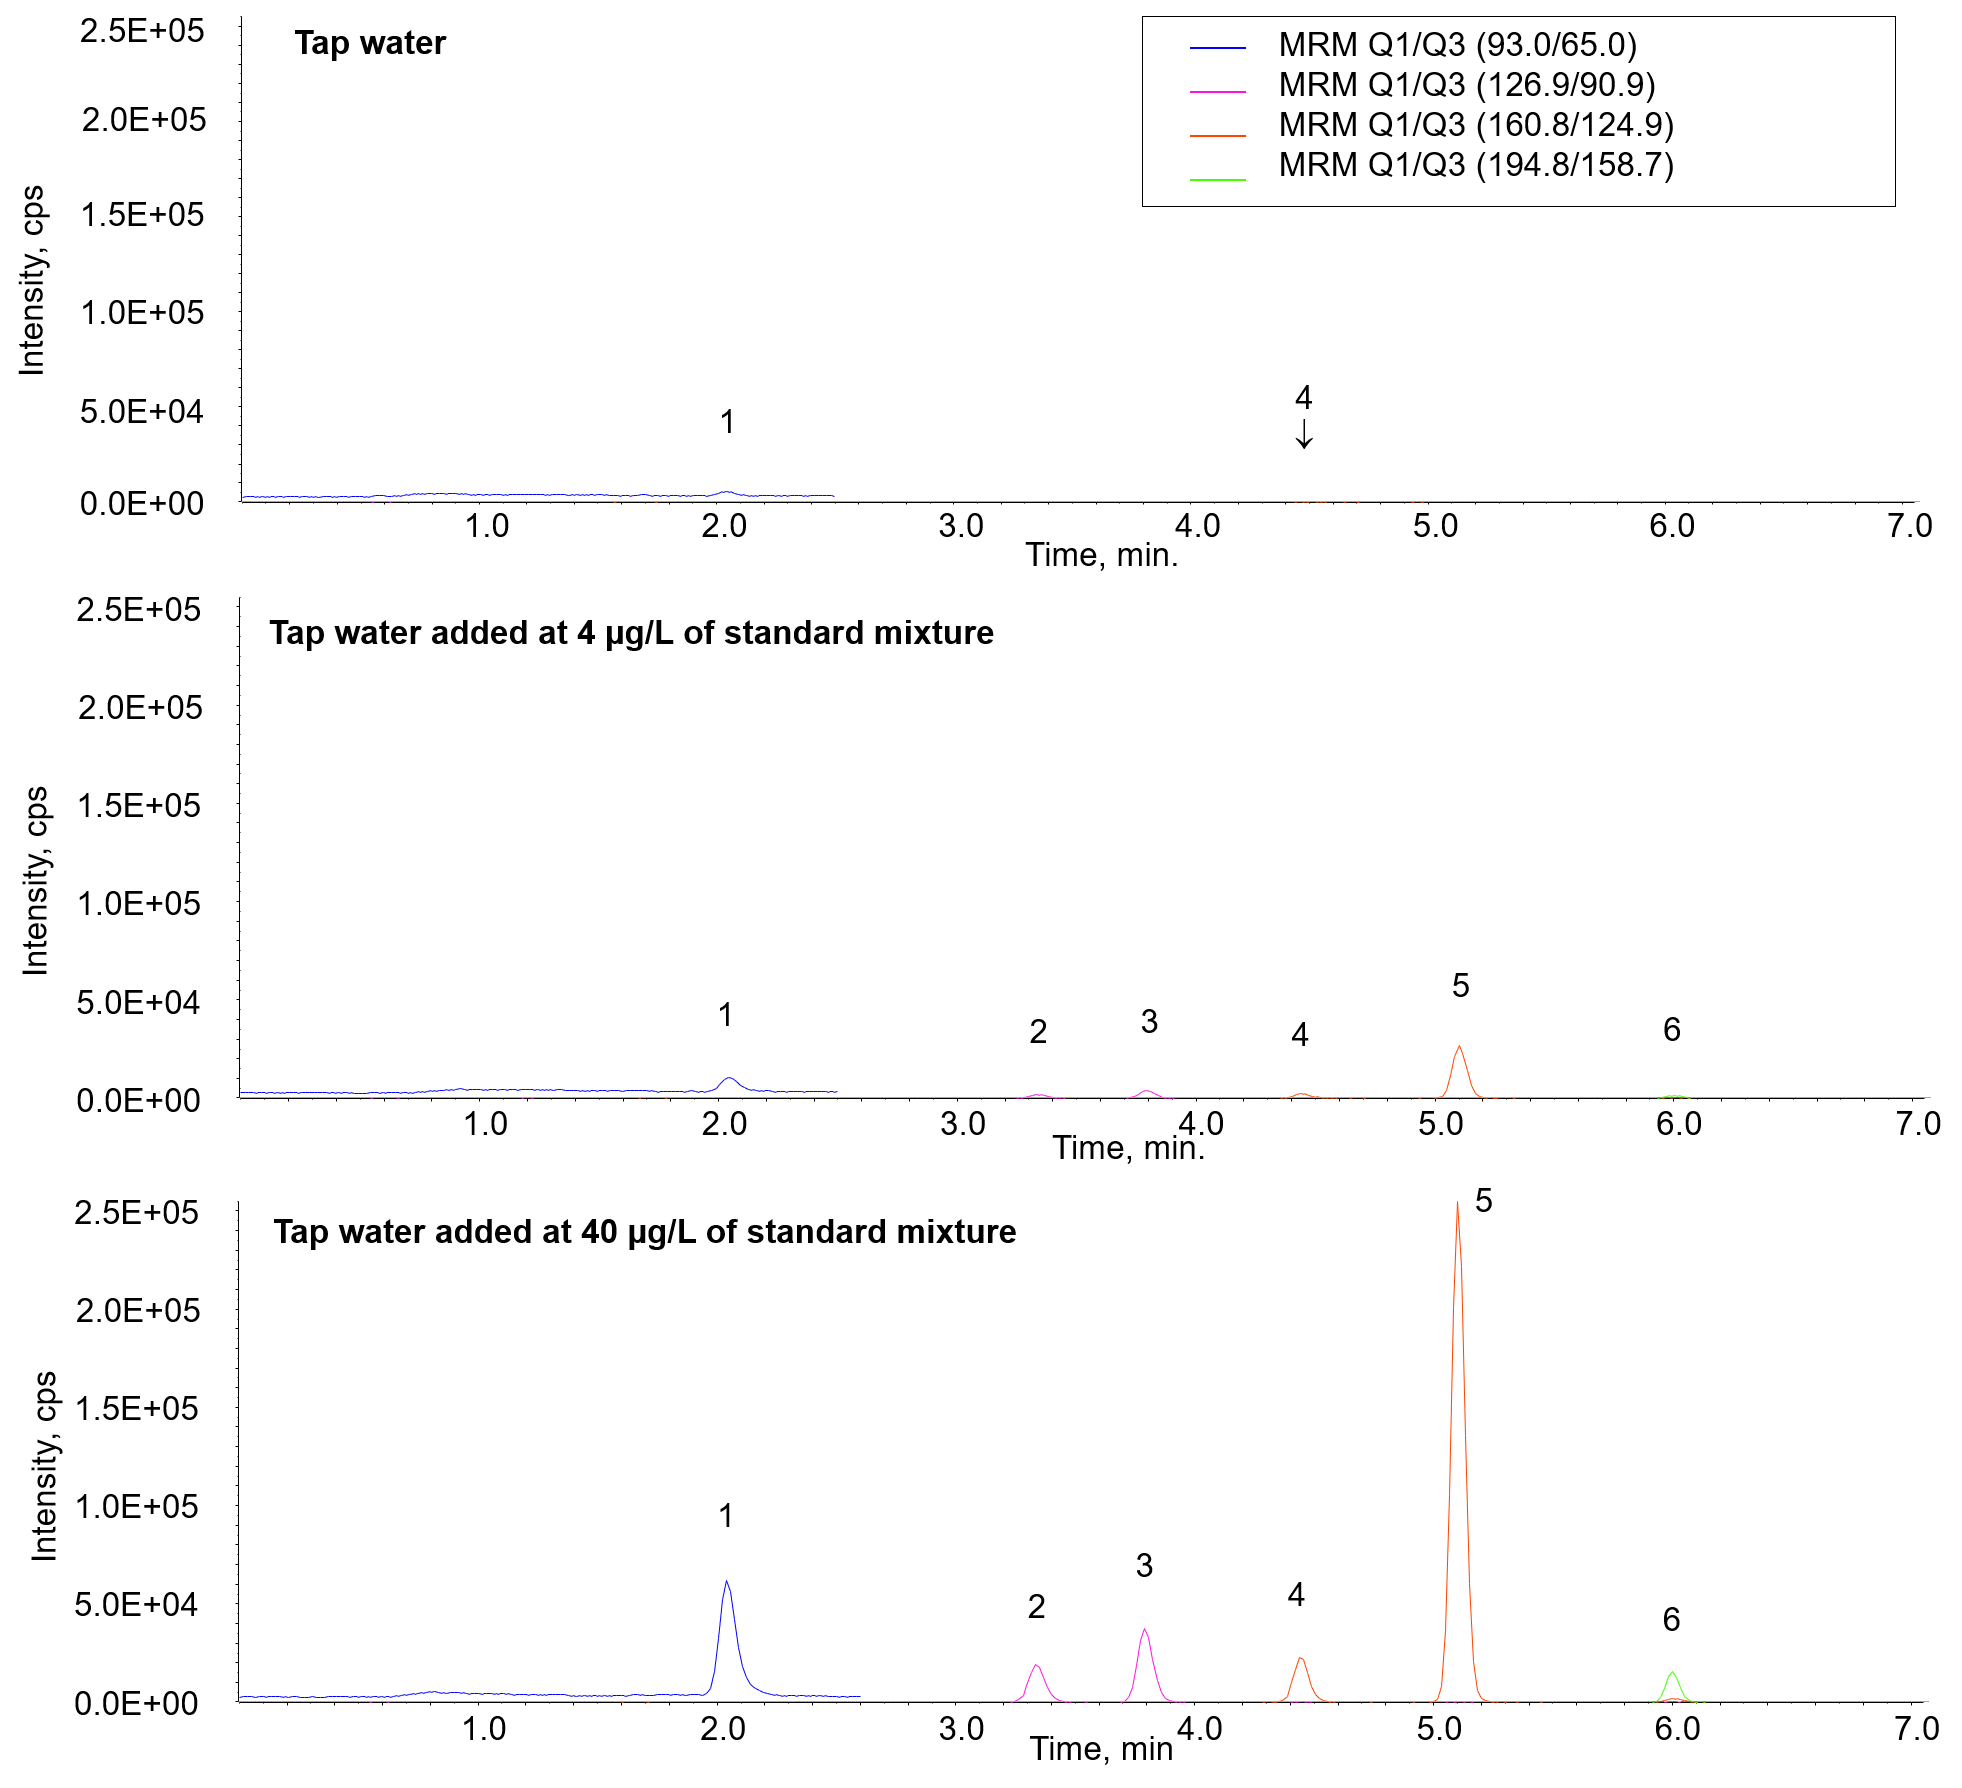
Fig. 4 Chromatograms of tap water added at 4 or 40 µg/L of standard mixture in recovery test
1: Phenol, 2: 2-Chlorophenol, 3: 4-Chlorophenol, 4: 2,6-Dichlorophenol, 5: 2,4-Dichlorophenol, 6: 2,4,6-Trichlorophenol
Table 3 Recovery rates of 6 phenols in tap water by SPE
| Recovery rate [%] | Phenol | 2-Chlorophenol | 4-Chlorophenol | 2,6-Dichlorophenol | 2,4-Dichlorophenol | 2,4,6-Trichlorophenol |
| Tap water with 4 µg/L | 100.4 | 106.6 | 100.1 | 97.0 | 106.3 | 94.6 |
| Tap water with 40 µg/L | 85.2 | 94.5 | 94.9 | 89.4 | 90.6 | 86.0 |


