Introduction
Thermochromism is a phenomenon in which the color of a material changes with temperature, and materials that exhibit this property are called thermochromic materials. Thermochromic materials are not only used for achieving attractive designs, such as in cups and bath toys, but also have many practical applications, such as baby bottles with milk temperature indicators, clothing and stickers to prevent heat stroke, and window glass whose solar transmittance changes with temperature.
In this report, for a thermochromic ink, which turns blue at low temperatures and pink at high temperatures, we present the results of simultaneous monitoring of molecular structure changes using an FT-IR spectrometer and color changes using a portable UV-Vis spectrophotometer.
Experimental
A measurement system combining a JASCO FT-IR spectrometer and a JASCO portable UV-Vis spectrophotometer was configured as shown in Figure 1. Thermochromic ink, which changes color at around 40 ºC, was applied to the heating stage of an attenuated total reflectance (ATR) unit attached to the FT-IR spectrometer, and after drying, the sample was measured at 2 ºC intervals from 35 ºC to 45 ºC.
Sample
Thermochromic ink

System
<FT-IR>
Instrument: FT/IR-4X FT/IR spectrometer
Accessories: ATR PRO 670X Heating single reflection ATR accessory, PKS-D675H Heated type Diamond crystal kit, TC-1000 Temperature controller
<Portable UV-Vis spectrophotometer>
Instrument: MV-3500 Portable UV-Visible/NIR spectrophotometer
Accessories: Portable integrating sphere, MVF1SMA-V15 Optical fiber for Integrating sphere
Software: Color diagnosis program
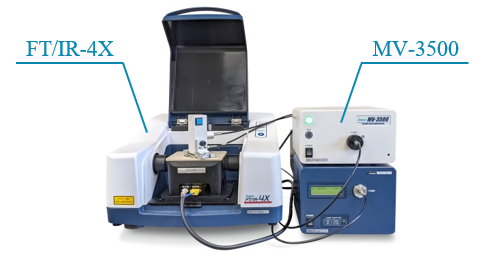
Fig. 1 FT/IR-4X FT/IR spectrometer (left) and MV-3500 portable UV-Vis spectrophotometer (right)
Parameters
<FT-IR spectrometer>
Method: ATR
Resolution: 4 cm-1
Accumulations: 64
<Portable UV-Vis spectrophotometer>
Measurement range : 380 nm – 780 nm
Data interval : 1 nm
Bandwidth : 5 nm
Exposure time: 0.1 sec
Accumulations: 1
Keywords
Thermochromic ink, temperature change, heating measurement, FT-IR spectrometer, heated ATR, portable UV-Vis spectrophotometer, integrating sphere
Results
Figure 2 shows the FT-IR spectrum of the sample measured at 35 ºC. A database search indicated the presence of melamine resin. Thermochromic inks are generally microencapsulated, and melamine resin is often used for the microcapsules.
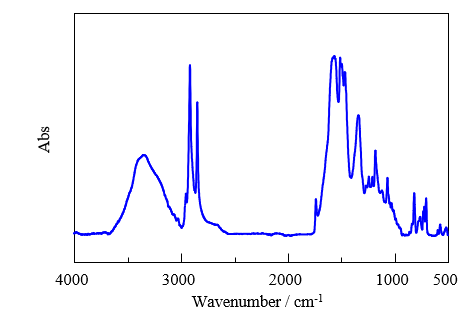
Fig. 2 FT-IR spectrum (35 ºC)
As seen in Figures 3 and 4, as the temperature is increased from 35 ºC to 45 ºC, several changes occur in the spectrum.
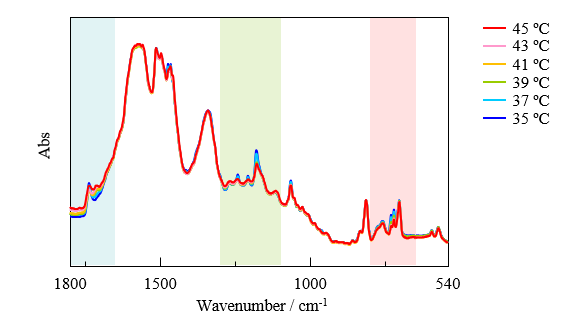
Fig. 3 FT-IR spectra at different temperatures (1800 cm-1 – 540 cm-1)
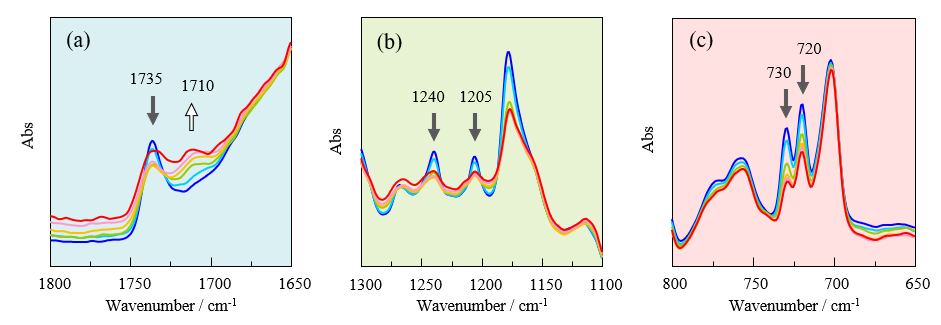
Fig. 4 FT-IR spectra at different temperatures (enlarged region of Figure 3)
The peaks at around 1735, 1240 and 1205 cm-1 indicated by black arrows in Figures 4(a) and 4(b), decrease in height as the temperature is increased. In contrast, the height of the peak at around 1710 cm-1, indicated by the white arrow in Figure 4(a), increases with increasing temperature. The former peaks are assigned to ester bonds and the latter to carboxylic acid. This suggests that the ester linkages were cleaved and carboxylic acid was produced. Furthermore, since the peaks at 720 cm-1 and 730 cm-1, indicated by the black arrows in Figure 4(c), decrease in height as the temperature is increased, the conjugated bonds associated with the color change are considered to have changed.
FT-IR spectroscopy could thus be used to identify the substance and track changes in its structure.
Next, the JASCO portable UV-Vis spectrophotometer was used to obtain diffuse reflection spectra and observe the color changes. The MV-3500 can acquire reflection spectra while FT-IR measurements are also being performed. The reflection spectra at different temperatures are shown in Figure 5.
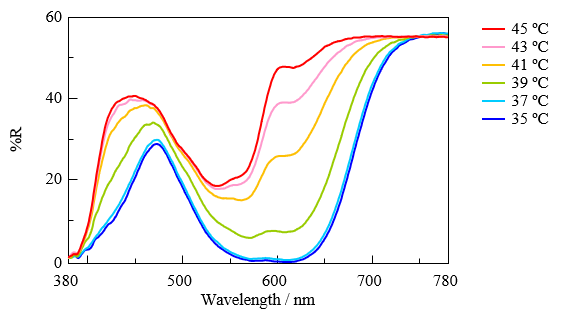
Fig. 5 Diffuse reflection spectra obtained using UV-Vis spectrophotometer
The change in spectral shape with temperature clearly indicates that the sample color has changed. To visualize this change, the custom-made Color Diagnosis program was used. As shown in Figure 6, the ink color changed from blue to pink with increasing temperature, with a clear color transition occurring around 40 ºC.
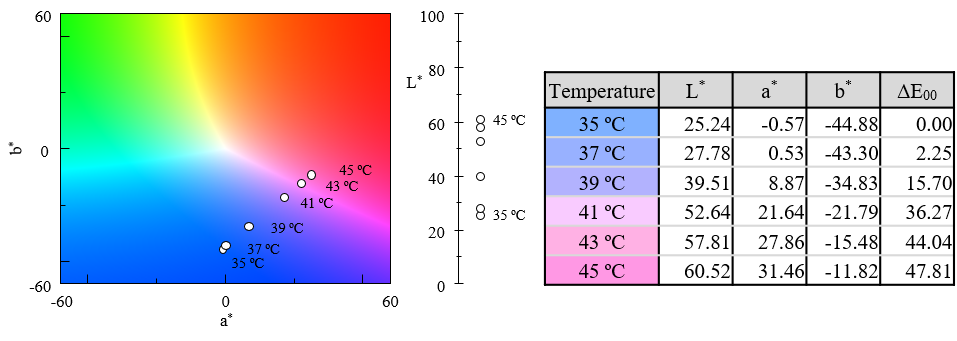
Fig. 6 Chromaticity coordinates
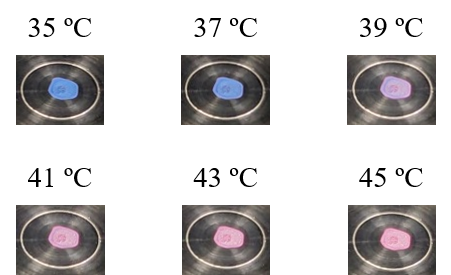
Fig. 7 Visual changes in sample color on ATR stage
Figure 7 shows photographic images of the sample at different temperatures. Although color changes are apparent, evaluation of these changes is subjective using visual observation alone, and varies from observer to observer and is affected by factors such as the ambient lighting. However, using a combination of the JASCO spectrophotometer and color evaluation software allows objective results to be obtained that are unaffected by the observer or the surrounding environment.
Conclusion
By combining a JASCO FT-IR spectrometer and a JASCO portable UV-Vis spectrophotometer, changes in the molecular structure and color of a material could be monitored simultaneously. By replacing subjective visual color evaluation with instrumental analysis, objective evaluation results could be obtained with good reproducibility. The results of the combined analysis described in this report highlight the effectiveness of this approach for the evaluation of widely used thermochromic materials, and well as for the development of new materials.
Related Posts:
 Orthogonal Assessment of Polymer Materials Including…
 Evaluation of Reflectance of Microlens Surface using…
 Base Material and Dye Analysis - Combined Raman and…
 Evaluation of Fluorescent Solvatochromic Dyes…
 Spectroscopic Evaluation of Color Development in…
 Structural Analysis of Chiral Samples with Multiple…