Introduction
The means of generating enantiomers in chiral substances can be broadly classified into asymmetric synthesis, crystallization, enzymatic reactions, and optical resolution by chromatography. Among these, optical resolution by normal-phase HPLC using a chiral stationary phase has long been used in a wide range of fields, such as pharmaceuticals, agrochemicals, natural products, biomolecules, and functional materials, because it is cost-effective. Recently, chiral preparative chromatography using supercritical fluid chromatography (SFC), which is capable of higher speed and separation than LC, has also attracted attention as an efficient enantiomer generation method, especially in the pharmaceutical field. However, chiral preparative chromatography using LC still plays an important role in all phases of drug discovery and development.
On the other hand, nuclear magnetic resonance (NMR), X-ray diffraction (XRD), electron circular dichroism (ECD), and vibrational circular dichroism (VCD) are commonly used for the qualitative and structural analysis of enantiomers in chiral substances. These analyses typically require sample amounts from a few mg to 100 mg.
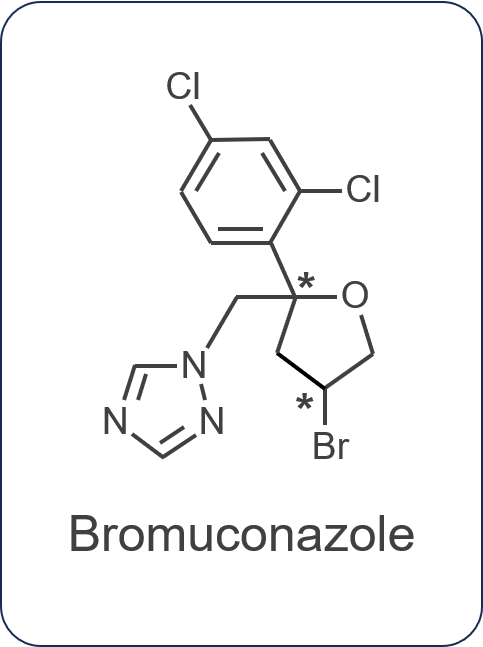
In this study, bromuconazole, a pesticide with two asymmetric carbons, was separated into four isomeric peaks on a 20 mm I.D. chiral column and fractionated using a semi-preparative LC system. This system has been equipped with a stacked injection function that can improve the yield per hour and valve fraction units that can handle large volume collection by repeated injection. We applied the fractionated isomers to structural analysis by ECD and VCD. The spectra were further compared to theoretical spectra obtained by computational chemistry to finally determine the absolute configuration.
Experimental
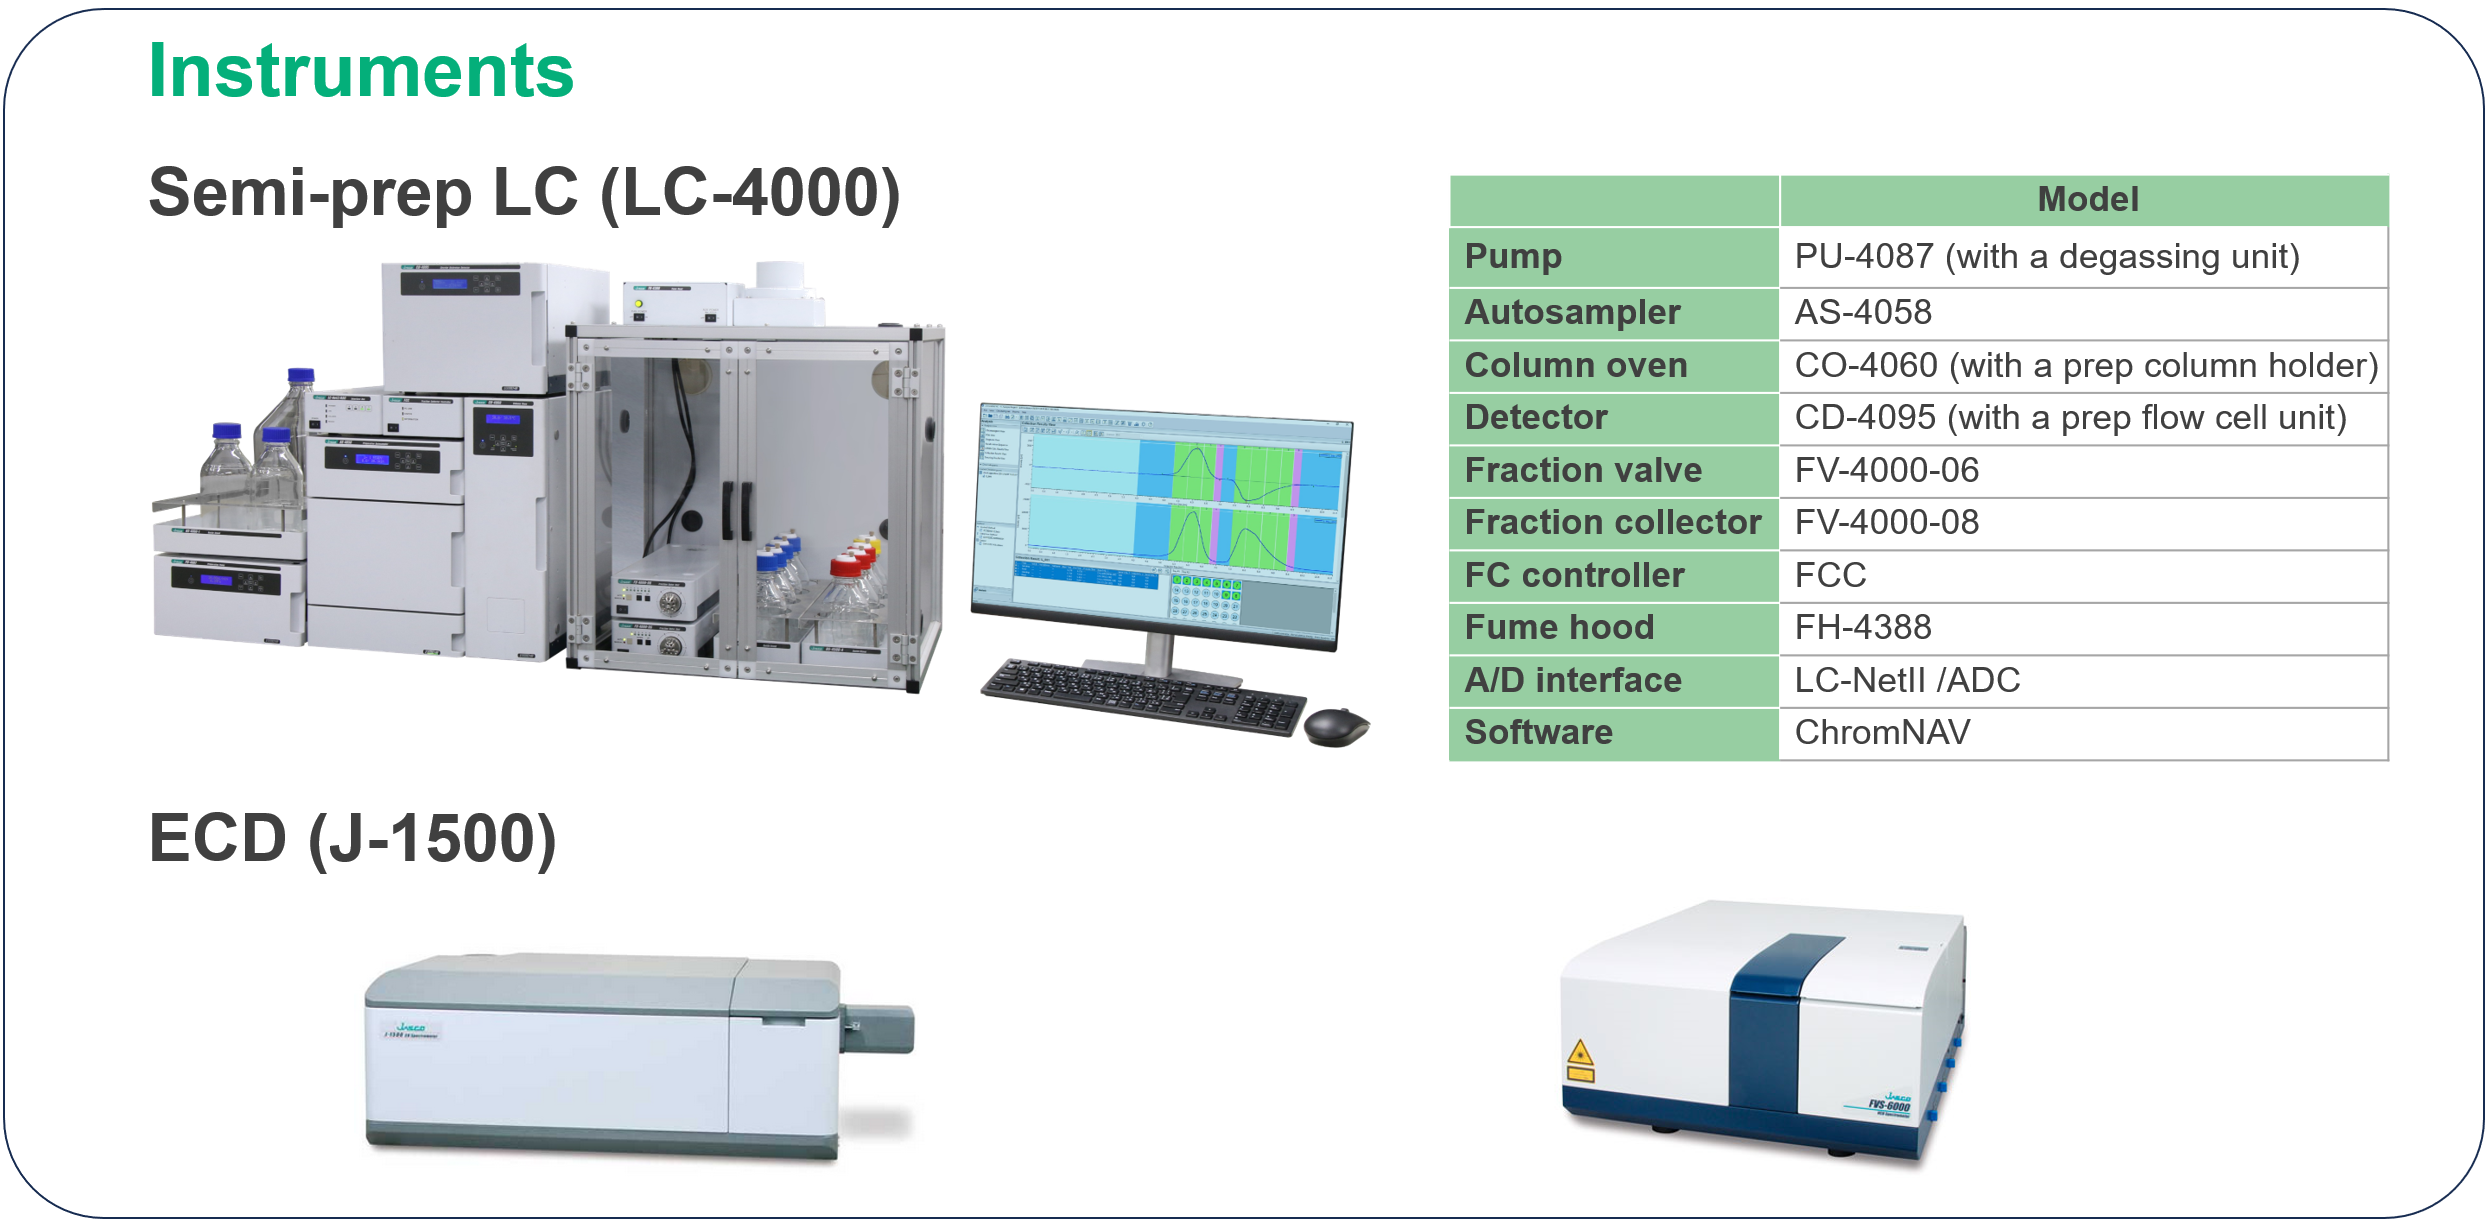
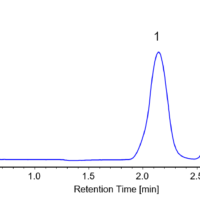
As a preliminary experiment, the separation conditions for racemic bromuconazole were investigated using an analytical-scale chiral column. Figure 1 shows the separation results on an analytical scale column (details of the instruments and analytical conditions are not described here). Based on these conditions, we determined the conditions for measurement on a semi-preparative LC.
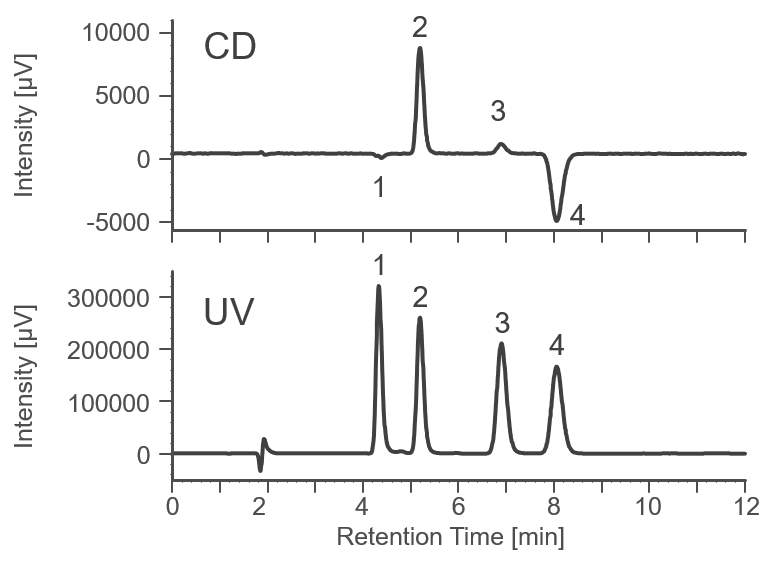
Fig. 1 Separation results on an analytical column
Semi-prep LC
Chiral column : CHIRALPAK IH (10 mmI.D. x 20 mmL, 5 µm) + (20 mmI.D. x 250 mmL, 5 µm)
Mobile phase : n-Hexane/ethanol (85/15)
Flow rate : 20 mL/min
Column temperature : 30 ºC
Wavelength : 230 nm
Sample : 9.5 mg/mL racemic bromuconazole in ethanol
Injection volume : 1.0 mL
Injection number: 18 times
Injection interval: 9.5 min
Fraction mode: Level fraction (trigger signal; UV)
Collection vials: 500 mL DURAN bottles
* CHIRALPAK is a trademark or registered trademark of Daicel Corporation.
DURAN is a trademark or registered trademark of DWK Life Sciences.
ECD
Cell length: 5 mm
Accumulated number: 4 times
VCD
Cell length: 150 µm
Accumulated number: 9000 times
Results
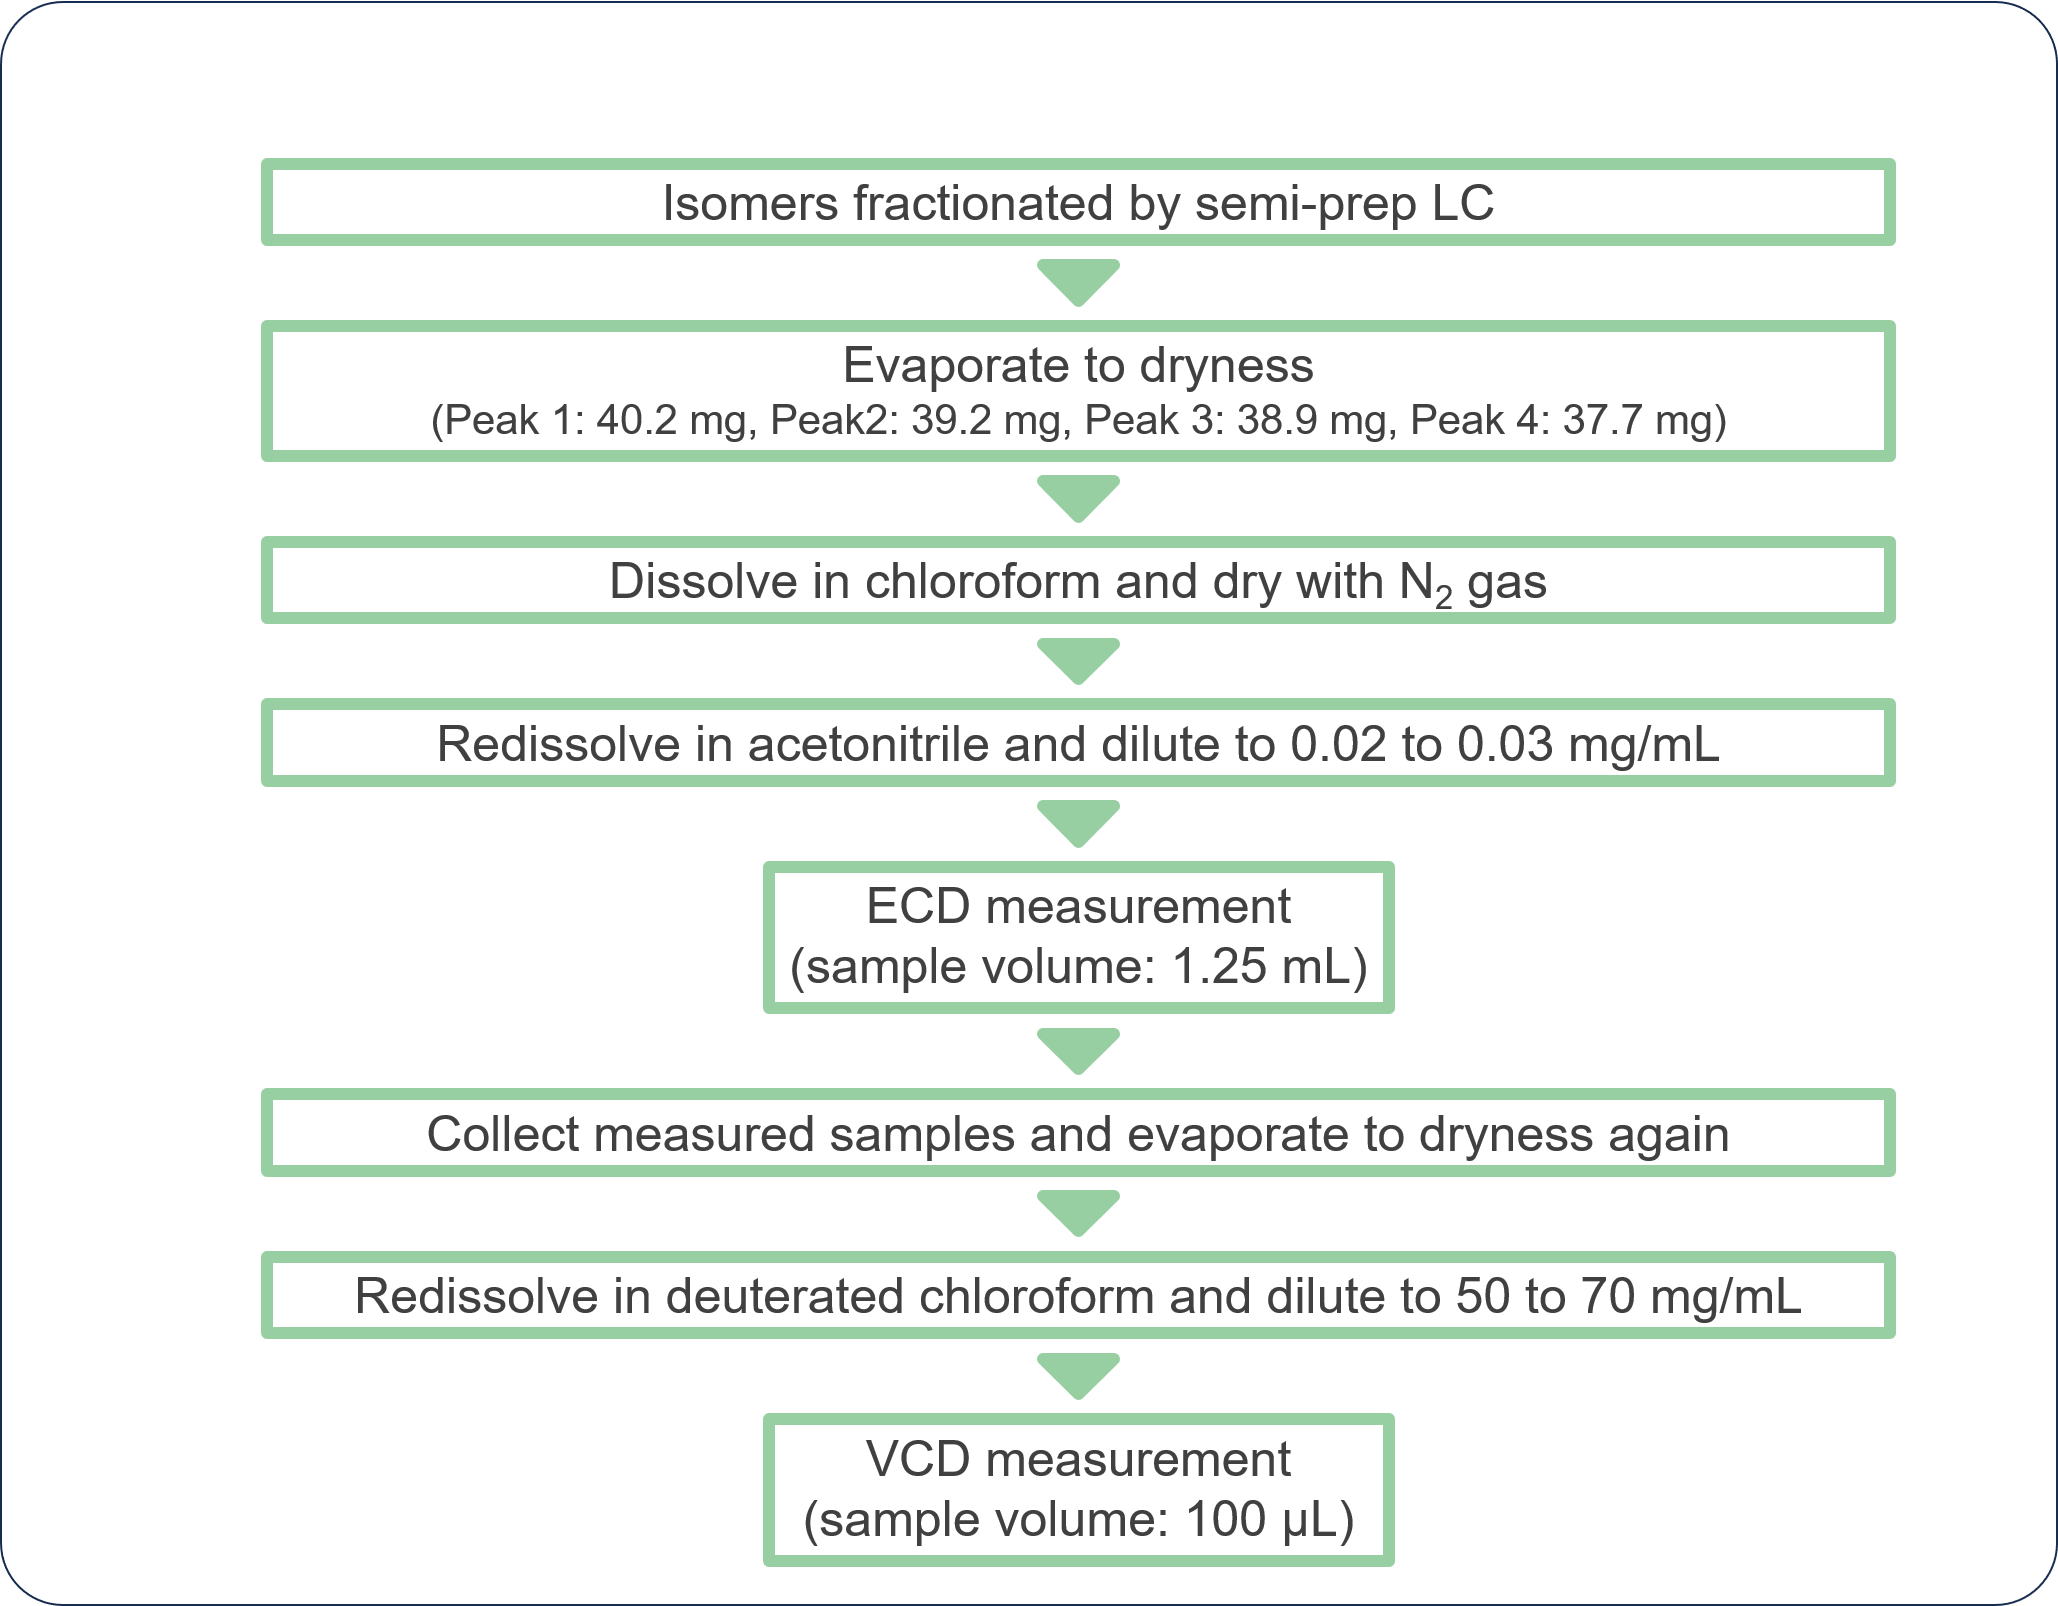
Isomers fractionated by Semi-prep LC
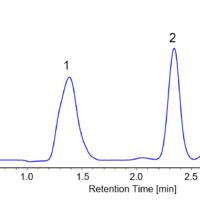
Figure 2 shows the collection results of racemic bromuconazole in a single injection. Due to the low CD intensity at 230 nm for peaks 1 and 3, the UV signal was used to trigger for level fraction. The 1st to 4th peaks were collected into vials 1 to 4 by the level fraction. To obtain approximately 40 mg enantiomer each, 18 repeat injections were executed.
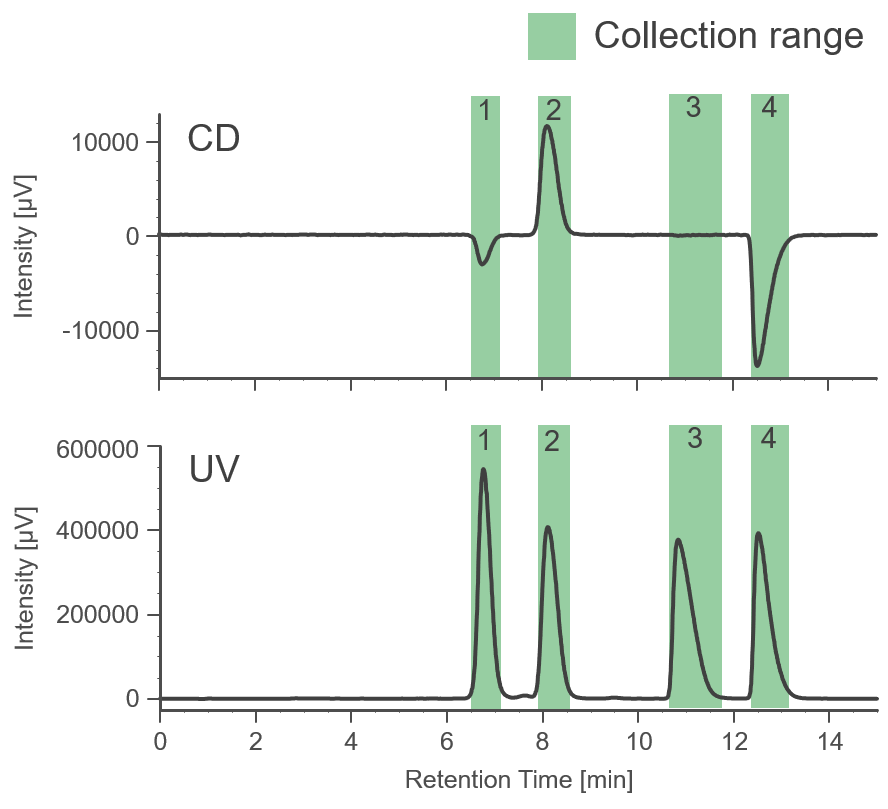
Fig. 2 Collection results in a single injection
Figure 3 shows the comparison of results between normal injection and stacked injection. The total run time and solvent consumption were reduced by 35% using stacked the injection function. Table 1 shows the recovered amount (dry weight) of each enantiomer by semi-prep LC and their enantiomeric excess. These enantiomer samples were applied to later ECD and VCD measurements.
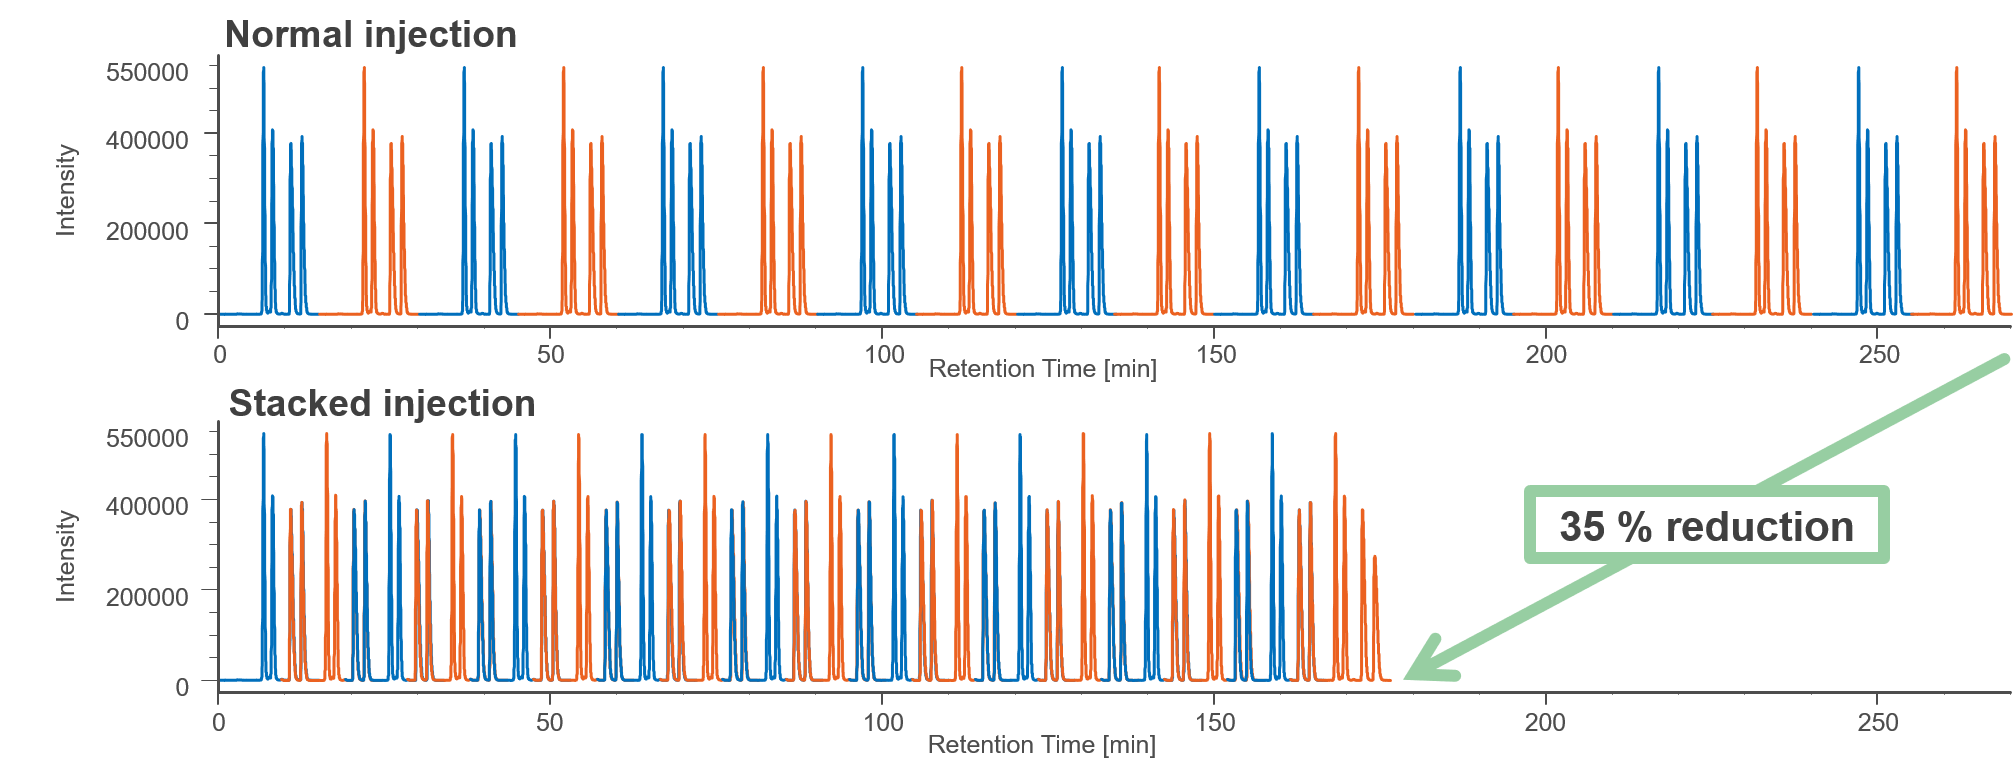
Fig. 3 Comparison of results between normal injection and stacked injection
Table 1 Recovered amount and purity of each enantiomer of bromuconazole
| Peak 1 | Peak 2 | Peak 3 | Peak 4 | |
| Recovery amount | 40.2 mg | 39.2 mg | 38.9 mg | 37.7 mg |
| Recovery rate | 94.6 % | 92.2 % | 91.5 % | 88.7 % |
| Enantiomeric excess* | 100 % | 99.6% | 99.9% | 99.6 |
* After the VCD measurement, samples were evaporated to dryness, redissolved in ethanol, and analyzed by an analytical scale LC system.
Comparison of measured CD spectra with theoretical spectra
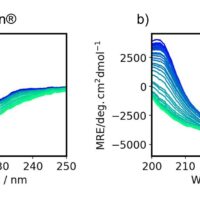
The theoretical spectra and absolute configurations of bromuconazole were calculated using Gaussian 16. Figure 4 shows the experimental and calculated ECD and absorbance spectra of bromuconazole isomers. From the spectra of peaks 1 and 3 dissolved in acetonitrile (Fig. 4-A), peak 1 was positive polarity at 230 nm and Peak 3 was negative polarity, but as shown in Fig. 1 and Fig. 2, the LC-CD system detects them reversed in the CD chromatogram at 230 nm. Since the dissolving solvents of ECD and LC-CD were different, we changed the dissolving solvent to the mobile phase of LC-CD (n-hexane/ethanol) and measured the ECD spectra again. As shown in Fig. 4-B, the polarity of peaks 1 and 3 at 230 nm was reversed compared to Fig. 4-A, indicating that the polarity was solvent-dependent. Note that the absorption had been saturated at short wavelengths below 200 nm due to the UV absorption of ethanol in the dissolving solvent. From the calculated spectra in Fig. 4-C, taking into account the CD polarity at short wavelengths and its polarity reversal at longer wavelengths, peaks 1 to 4 could be presumed to be 2S,4S-, 2S,4R-, 2R,4R-, and 2R,4S-bromuconazole, respectively.
* Gaussian is a trademark or registered trademark of Gaussian Inc.
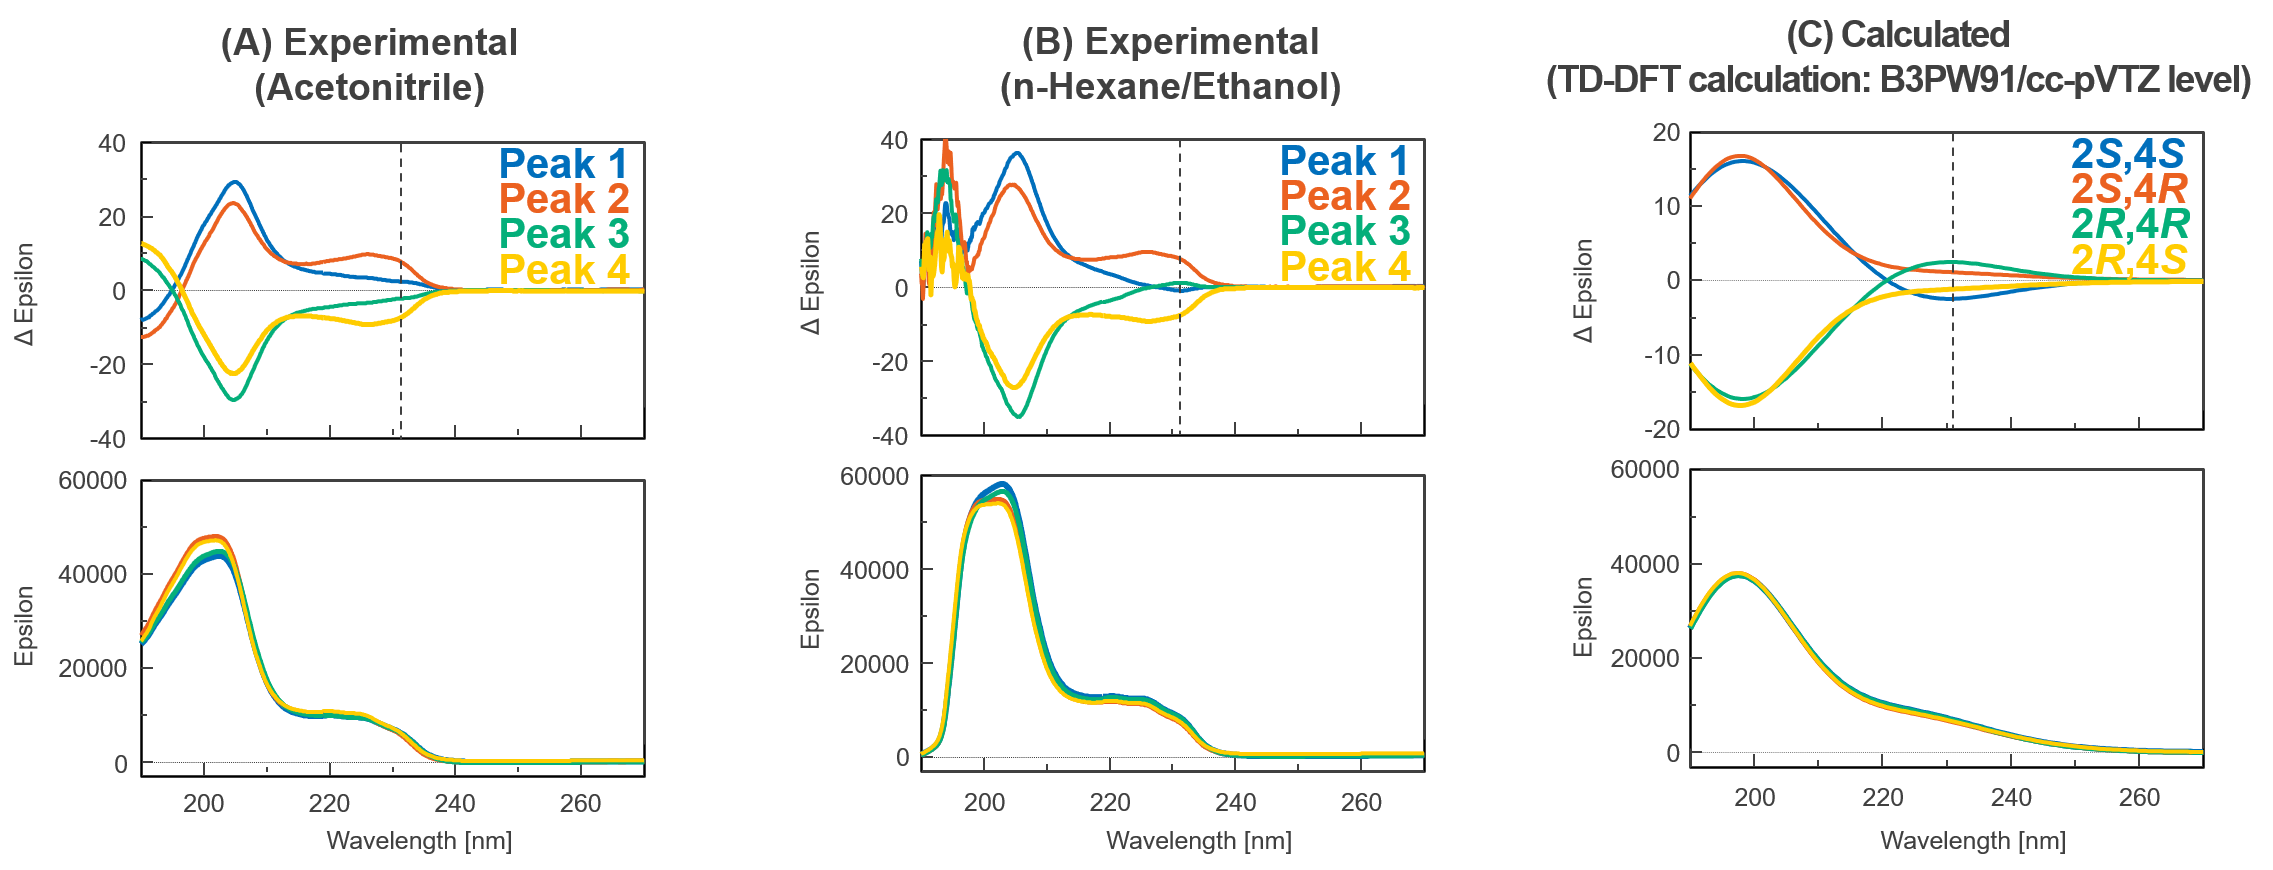
Fig. 4 Experimental and calculated ECD and absorbance spectra of bromuconazole isomers
Figure 5 shows the experimental and calculated VCD and IR spectra of bromuconazole isomers. Especially in the gray range, the pattern of the experimental VCD spectra was in good agreement with the behavior of the calculated spectra. Compared to calculated spectra, the peaks 1 to 4 could be identified to 2S,4S-, 2S,4R-, 2R,4R-, and 2R,4S-bromuconazole, respectively, which is consistent with the ECD results. Fig. 6 shows the absolute configuration of each isomer of bromuconazole obtained by the calculation.
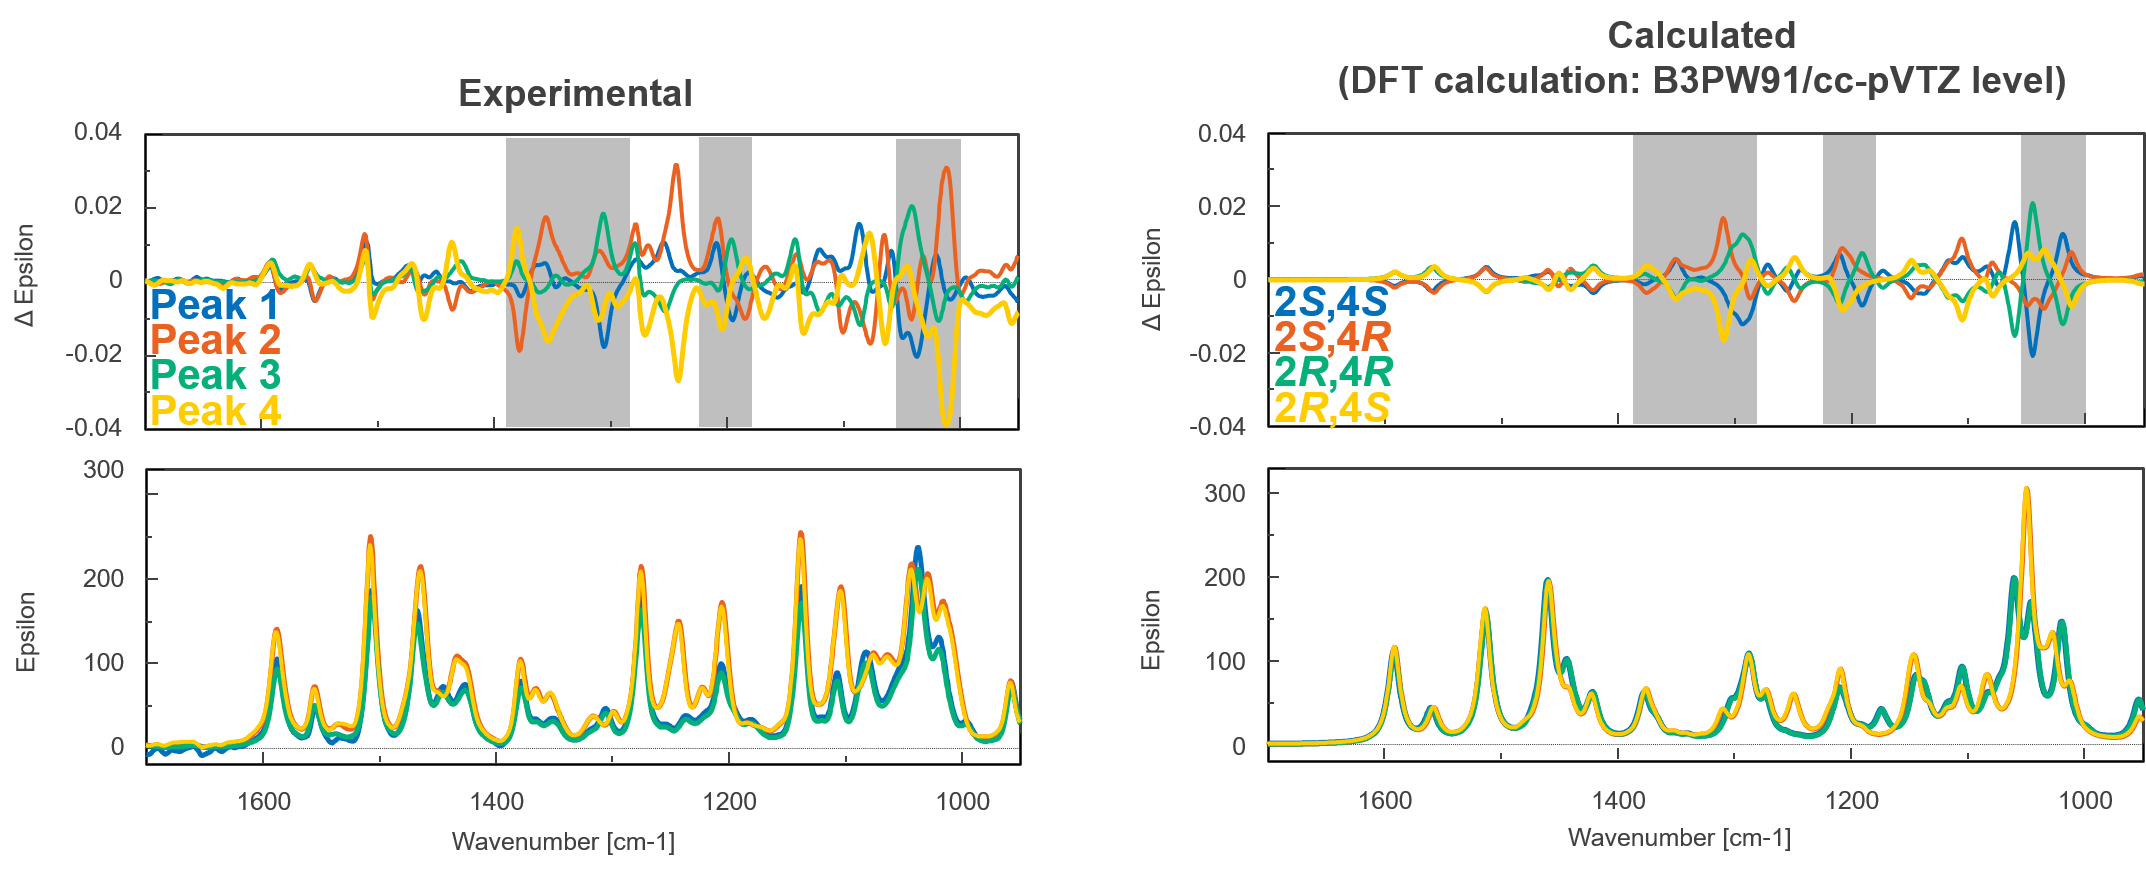
Fig. 5 Experimental and calculated VCD and IR spectra of bromuconazole isomers
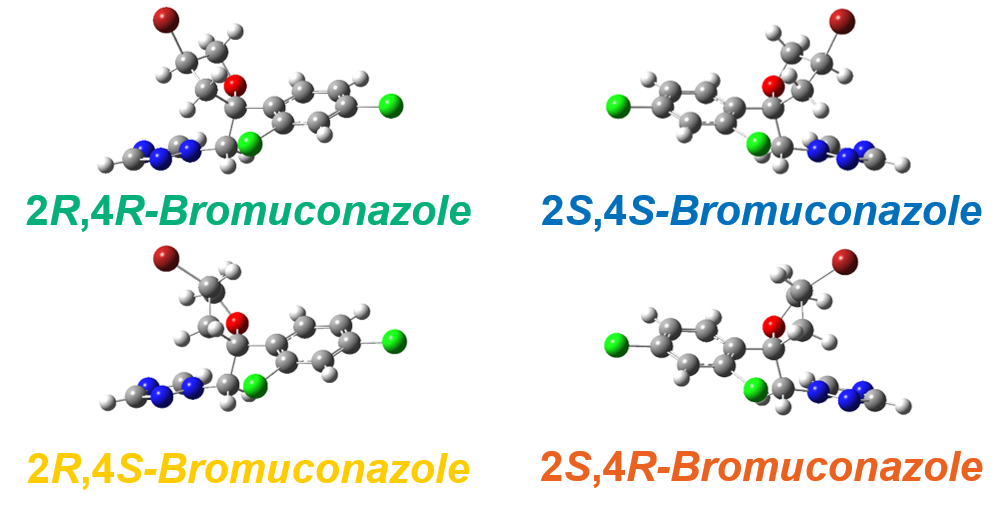
Fig. 6 Absolute configurations of bromuconazole (DFT calculation: B3PW91/cc-pVTZ level)
Conclusion
- The total run time and solvent consumption in semi-prep LC were reduced by 35% using stacked the injection function.
- The pattern of calculated ECD and VCD spectra of bromuconazole significantly corresponded to those of experimental spectra.
- Peaks 1 to 4 could be identified to 2S,4S-, 2S,4R-, 2R,4R-, and 2R,4S-bromuconazole, respectively.
References
Poster Session at 34th International symposium on Chirality (Chirality 2024, August 26 – 29, 2024, in Kyoto, JAPAN)
Satoe Iijima, Takuya Nakamura, Yoshiro Kondo, Satoko Suzuki, and Kengo Yoshida
JASCO Corporation, Hachioji, Tokyo 192-8537, Japan

