Introduction
Both Raman spectroscopy and infrared spectroscopy can be used to analyze the molecular structure of substances based on molecular vibrational information, and the results obtained complement each other. Raman spectroscopy is more effective for the analysis of inorganic substances because measurements can be performed down to lower wavenumber. In contrast, infrared spectroscopy is widely used for qualitative analysis of organic substances because of its extensive database. Consequently, the combined use of Raman and infrared spectroscopy allows a wide range of information to be acquired for inorganic and organic compounds.
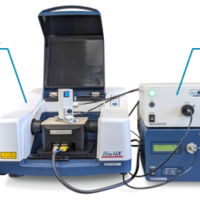
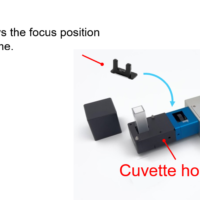
Combined macroscopic (visible to naked eye) FTIR/Raman analyses can be performed by attaching a Palmtop Raman spectrometer to an FTIR spectrometer with an attenuated total reflectance (ATR) accessory installed (Figure 1). This system allows easy measurements using both instruments without having to move the sample between instruments.

Fig. 1 Combined analysis using macroscopic IR/Raman system
In this report, we present an example of macroscopic measurements of green embroidery thread using a combination of the Palmtop Raman spectrometer and the ATR-FTIR spectrometer, each of which provides different spectral information.
Experimental
Sample: Green embroidery thread (Figure 2)
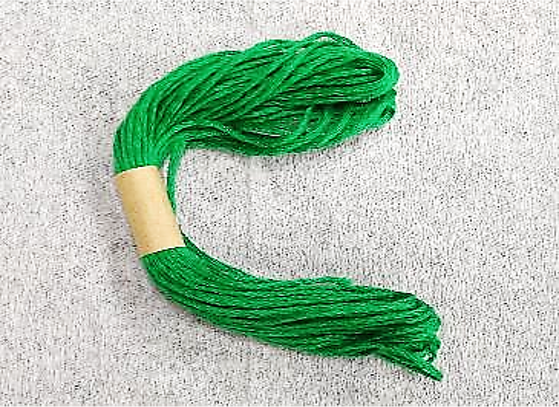
Fig. 2 Embroidery thread
System:
-Raman system
Instrument: PR-1w Palmtop Raman Spectrometer
Accessory: PR-1-ATR Mounting unit
-IR system
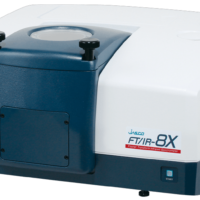
Instrument: FT/IR-4X Spectrometer
Accessory: ATR PRO 4X Single reflection ATR accessory
Parameters:
-PR-1w Palmtop Raman spectrometer
Ex wavelength: 785 nm
Laser power output: 50 mW
Exposure time: 2 sec
Accumulations: 8
-FT/IR-4X Spectrometer
Detector: TGS
Crystal: Diamond
Resolution: 4 cm-1
Accumulations: 16
Keywords
thread, dye, qualitative analysis, component analysis, combined analysis, Palmtop Raman spectrometer, ATR, FT/IR-4X
Results
Figure 3 shows the measurement results for green embroidery thread obtained using the PR-1w and the FT/IR-4X. In the Raman spectrum, a peak1) associated with copper phthalocyanine (CuPH) is detected in the vicinity of 1525 cm-1 due to the resonance Raman effect, providing information on the dye used to color the thread (Fig. 3a). On the other hand, the IR spectrum shows a characteristic band in the region of 800 cm-1 to 1200 cm-1 (Fig. 3b, light blue area) assigned to C-O-C bonds of cellulose.2) Since cellulose is the main component of the cotton fibers used in the embroidery thread, the IR spectrum provides information about the fibers themselves. By combining both measurements in this way, different information about the sample can be obtained.
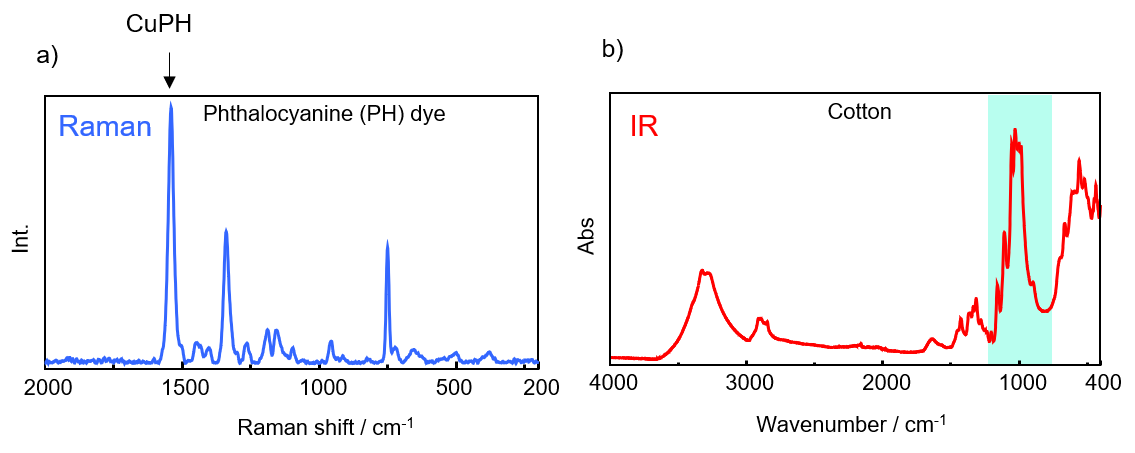
Fig. 3 a) Raman spectrum, b) IR spectrum
Conclusion
Embroidery thread was measured using the Palmtop Raman spectrometer and the ATR-FTIR spectrometer. The Raman spectrum identified the phthalocyanine dye (organic-inorganic complex) due to the resonance effect, and the IR spectrum identified the fiber material as cotton (organic material). Thus, complementary information was obtained by combining these two methods. The system used in this study is also effective for rapid evaluation of samples such as organic-inorganic composite materials, including bio-minerals and cosmetics containing organic-inorganic components, because it can measure samples nondestructively and does not require special sample preparation techniques.
References
1) D. Antuña-Jiménez, D. Ibáñez, M. B. González-García, D. Hernández-Santos, P. Fanjul- Bolado: Sensors (Basel), 20, 3702 (2020). DOI: 10.3390/s20133702
2) M. F. Rosa, E. S. Medeiros, J. A. Malmonge, K. S. Gregorski, D. F. Wood, L.H.C. Mattoso, G. Glenn, W. J. Orts, S. H. Imam: Carbohydr. Polym., 81, 83 (2010). DOI: 10.1016/j.carbpol.2010.01.059

