Introduction
Fermentation is a form of enzymatic decomposition by microbes such as bacteria, mold, and yeast. Alcoholic fermentation occurs by the action of yeast, and is a biological process in which sugars such as glucose and sucrose become transformed into ethanol and carbon dioxide. Yeast is also used in the production of bread and alcoholic beverages.
Alcoholic fermentation of glucose: C6H12O6 -> 2C2H5OH + 2CO2
In fermentation, it is important to optimize the fermentation temperature and time according to the microbes to be used. In this experiment, Raman spectroscopy was used to analyze the alcoholic fermentation process. Raman spectroscopy is a convenient method for analyzing liquid samples in containers because the sample spectrum at the position where the laser is focused can be simply obtained and the method is less susceptible to the presence of water. This report describes the use of a PR-1w Palmtop Raman Spectrometer to monitor the progress of alcoholic fermentation using two types of yeast. This method is suitable for real-time reaction tracking, and the time-dependent data can be analyzed using two-dimensional correlation spectroscopy.
Experimental
Samples
Sugar, 20 w/v% sucrose solution: 2 mL
Yeast, dry yeast: 5 mg (2 types [Yeast A and B])
Measurement protocol
1. Prepare a sucrose solution
2. Place the solution in a rectangular quartz cuvette and maintain it at 35 ºC using a hot plate magnetic stirrer
3. Add dry yeast powder and mix for approximately 2 min
4. Cover the cuvette lightly with aluminum foil and leave it on the hot plate at 35 ºC
5. Measure time interval scan data using a Palmtop Raman Spectrometer
System
To allow monitoring of alcoholic fermentation at constant temperature, a system (Figure 1) consisting of a Palmtop Raman Spectrometer held horizontally and a hot plate magnetic stirrer is used.
Instrument: PR-1w Palmtop Raman Spectrometer
Accessory: PR-1-Z Z stage unit, PR-1-Z-EX Option kit for PR-1-Z
Software: PR-ITS-1W Interval measurement analysis program for PR-1w
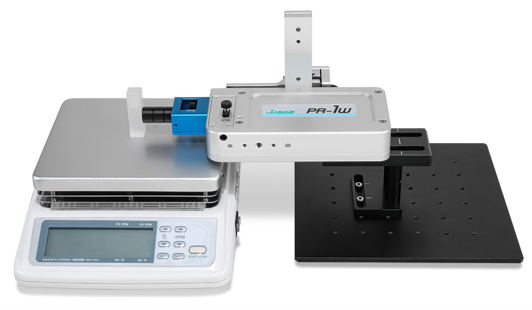
Fig. 1 External view of monitoring system
Parameters
Laser wavelength: 785 nm
Laser power: 50 mW
Exposure time: 3 sec
Accumulations: 32
Time interval: 5 min
Data Points: 145 points (12 hours)
Hot stirrer temperature: 35 ºC
Keywords
Bacteria, Yeast, Alcoholic fermentation, Bioreactor, Liquid culture, Reaction, Time interval scan measurement, Raman spectroscopy, Two-dimensional correlation spectroscopy, Palmtop Raman Spectrometer
Results
In the spectra shown in Figure 2, a peak associated with sucrose (hereinafter referred to as sugar) was observed at the start of the measurement independent of the yeast type, and an additional peak associated with ethanol was observed 12 hours after the start of the measurement.
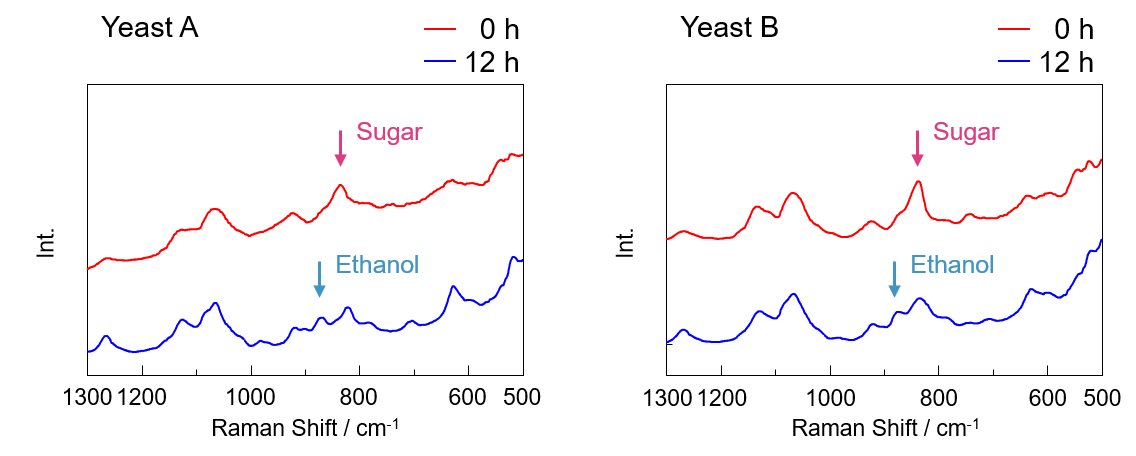
Fig. 2 Raman spectra
Figure 3 shows the time dependence of the heights of the sugar and ethanol peaks, which reflect the concentration of these components. It can be seen that for yeast A, the sugar concentration reached a steady state in approximately 5 hours, whereas for yeast B it continued to decrease even after 12 hours. This indicates that the rate of sugar degradation differs depending on the yeast type. For both types of yeast, the ethanol peak height increases with decreasing sugar peak height.
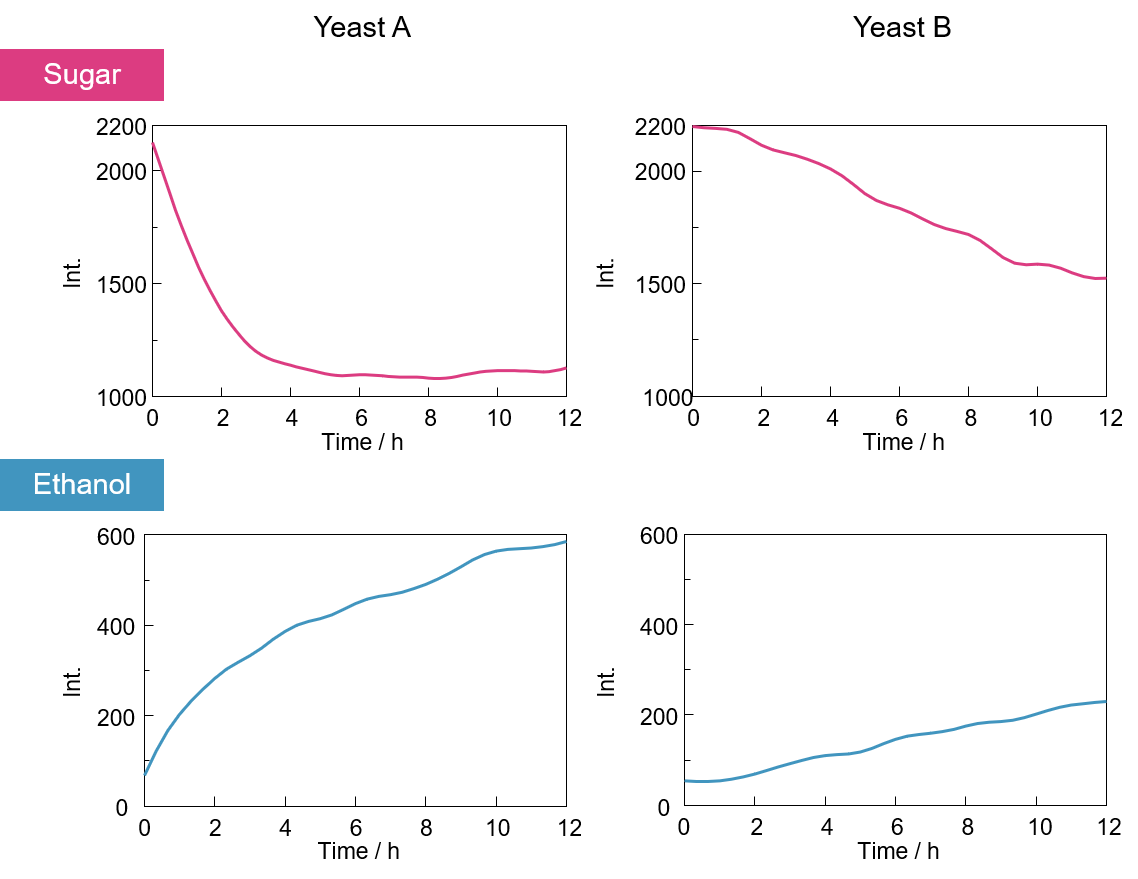
Fig. 3 Time variation of peak height for sugar and ethanol
Then, the time-dependent spectra obtained for yeasts A and B were analyzed using two-dimensional correlation spectroscopy, which evaluates changes in spectral peaks with time.
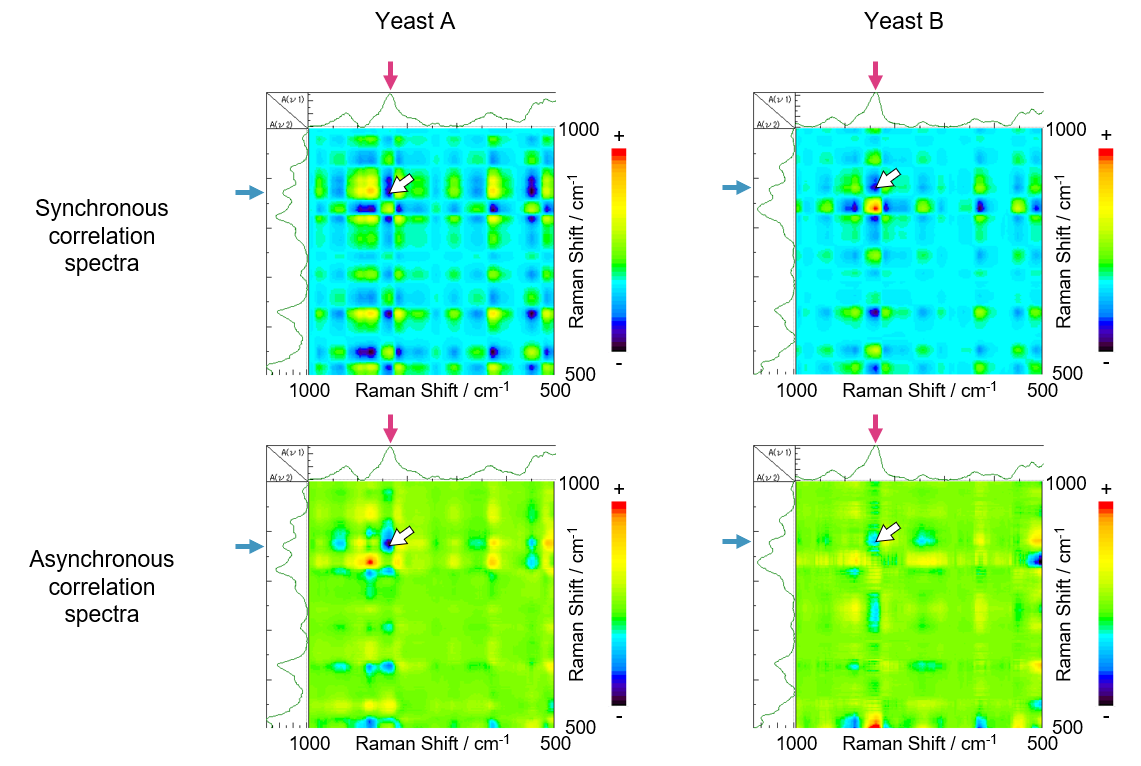
Fig. 4 Synchronous – asynchronous correlation spectra
As shown in the synchronous correlation spectra in Figure 4, a negative cross-peak is observed at 835 cm-1 (corresponding to sugar) and at 873 cm-1 (corresponding to ethanol), indicating that the intensity of these peaks changes in an opposite manner. This is also clear from the results in Figure 3, where the ethanol peak height increases as that for sugar decreases. Additionally, in the asynchronous correlation spectra shown in Figure 4, a negative cross-peak is also seen for sugar and ethanol. The combined synchronous and asynchronous results indicate that the change in the sugar peak precedes that in the ethanol peak. Thus, it can be assumed that ethanol was produced only after sugar was broken down. It can therefore be concluded that the two-dimensional correlation analysis successfully tracked the yeast fermentation process.
Conclusion
The progress of alcoholic fermentation was successfully monitored using a Palmtop Raman Spectrometer and time interval scan measurements. Such evaluations are useful for determining the effect of different combinations of sugar and yeast, temperature, and other factors on obtaining new characteristics of yeast. This approach can also be applied to different microbe culture systems and reaction systems.
References
I. Noda: J. Am. Chem. Soc., 111, 8116(1989). DOI: 10.1021/ja00203a008
*This experiment was carried out at JASCO Incorporated in Maryland, USA.
Related Posts:
 Reaction Monitoring System using Surface-Enhanced…
 Monitoring of Degree of Crosslinking for Epoxy…
 In-situ Raman Monitoring for Flow Synthesis of Peptide Drugs
 Monitoring of Aggregates and Degradation Products by…
 Quantitation of Glucose in Aqueous Solution using…
 Analysis of Carbon Products using Raman Spectroscopy