Introduction
The Japan Weather Association uses the “Durham sampler method” to monitor pollen.1) In this method, a glass slide coated with white petrolatum is left in place for 24 hours, and the number of captured pollen particles is counted under a microscope. However, this method is problematic in that it requires a great deal of time and labor. To solve this problem, several analytical methods have been proposed, including the use of light scattering.1) This report describes a potential new method for analyzing pollen using infrared microscope and the JASCO Particle Analysis software.
JASCO Particle Analysis software2)
We offer this software as a tool for analyzing microscope images and chemical images. It can determine the size, shape and number of particles, and has been used to evaluate microplastics. In this experiment, it was used to analyze the number and composition of captured particles, including pollen particles.
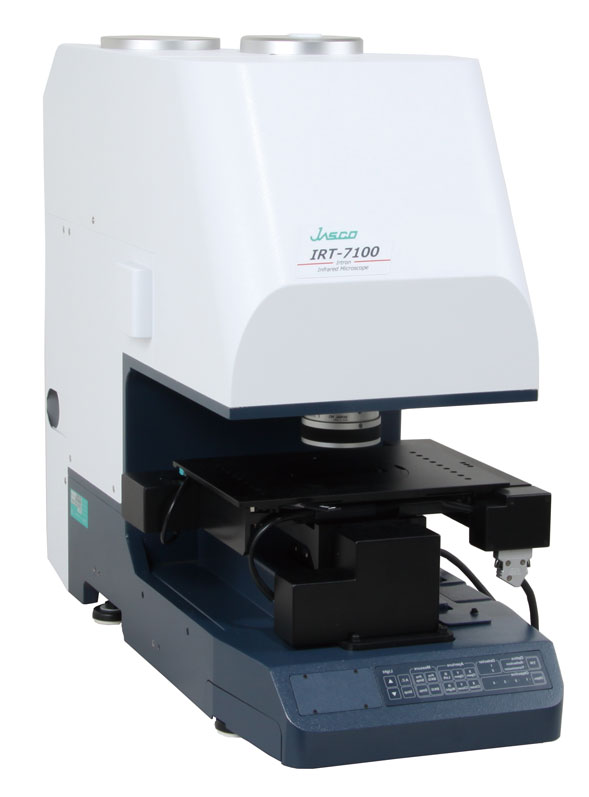
IRT-7200 IR microscope
Experimental
Sample and method
Instead of glass slides, CaF2 plates (10 mm diameter x 1 mm thickness), which transmit infrared light, were placed outdoors at the JASCO factory in Hachioji city for 24 hours (April 3 to 4, 2023), and the particles captured on the plates were measured using an infrared microscope. The observed images and chemical images were analyzed using the JASCO Particle Analysis software. In this experiment, white petrolatum, which absorbs infrared light, was not applied when collecting particles.
System
FT/IR-6X FT/IR spectrometer
IRT-7200 Multi-channel infrared microscope
Micro Imaging Analysis (JASCO Particle Analysis)
Parameters
Resolution: 8 cm-1
Accumulations: 4 times
Methods: Transmittance, microscopy
Objective focusing mirror: 16x
Detector: Linear array and mid-band MCT
Pixel resolution: 12.5 x 12.5 µm
Area: 1.6 x 1.6 mm (2.56 mm2)
Measurement points: 16384 (128 x 128)
Time: Approx. 5 minutes
Keywords
Pollen, particle analysis, chemical image, Durham sampler
Results
Figure 1 shows a microscopy image of the sample, and IR spectra obtained at the indicated measurement points. The image shows particles of various sizes scattered over the surface. Using the JASCO Particle Analysis software, the number of particles was determined to be 32. Detailed analysis of the spectrum of each particle revealed the presence of at least four different substances.
For particle A, an absorption band appears at around 1720 cm-1, and is attributed to the carbonyl group C=O of carboxylic acid. In addition, bands at 1200 to 1100 cm-1 originating from polysaccharide ring structures and glycosidic bonds, are observed. Therefore, this particle is most likely to be of plant origin, and is considered to be pollen since it is spherical and has a diameter of approximately 20 to 50 µm.
The spectrum of particle B has absorption bands at 1640 and 1550 cm-1, attributed to amides I and II, and is similar to the nylon spectrum in the database. This particle is therefore considered to be nylon, but could also be a microplastic particle that was suspended in air.
For particle C, the spectrum is very similar to that of cellulose in the database, and its shape is not spherical, so it is considered to be a piece of wood or a leaf.
Particle D is thought to be an inorganic substance because of the absence of an absorption peak for the
-CH2- methylene group near 2900 cm-1, and the absence of a distinct absorption band. Given the seasonal nature of dust in Japan, this particle might correspond to yellow dust.
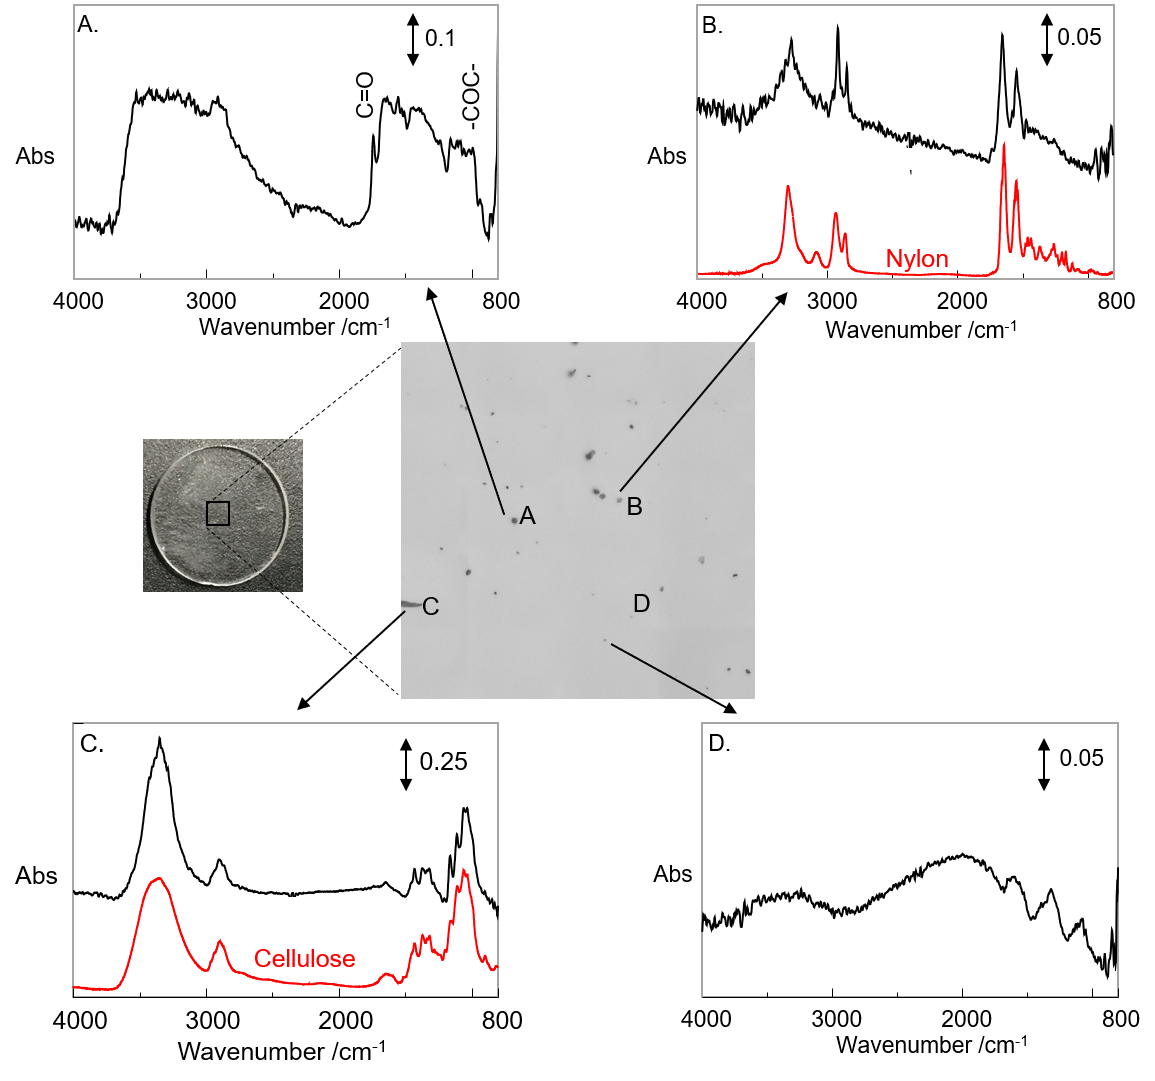
Figure 1 Microscopy image of particles and corresponding spectra
(black: Measured spectrum, red: Spectrum in database)
Figure 2 shows calculated chemical images based on the correlation between the IR spectra of pollen, nylon, cellulose, and inorganic materials, and the spectra measured at 16384 points. The graph in the figure shows the calculated particle size distribution, color coded by particle type. According to the Bureau of Social Welfare and Public Health of the Tokyo Metropolitan Government, the number of airborne pollen particles in Hachioji City on April 3 to 4, 2023 was approximately 50/cm2.3) The present experiment gave a value of 3 particles/2.56 mm2, or approximately 117 particles/cm2. Although this is somewhat larger than the reported value, it is on the same order. In addition to pollen, our method also has the potential to simultaneously analyze atmospheric microplastics and yellow dust.
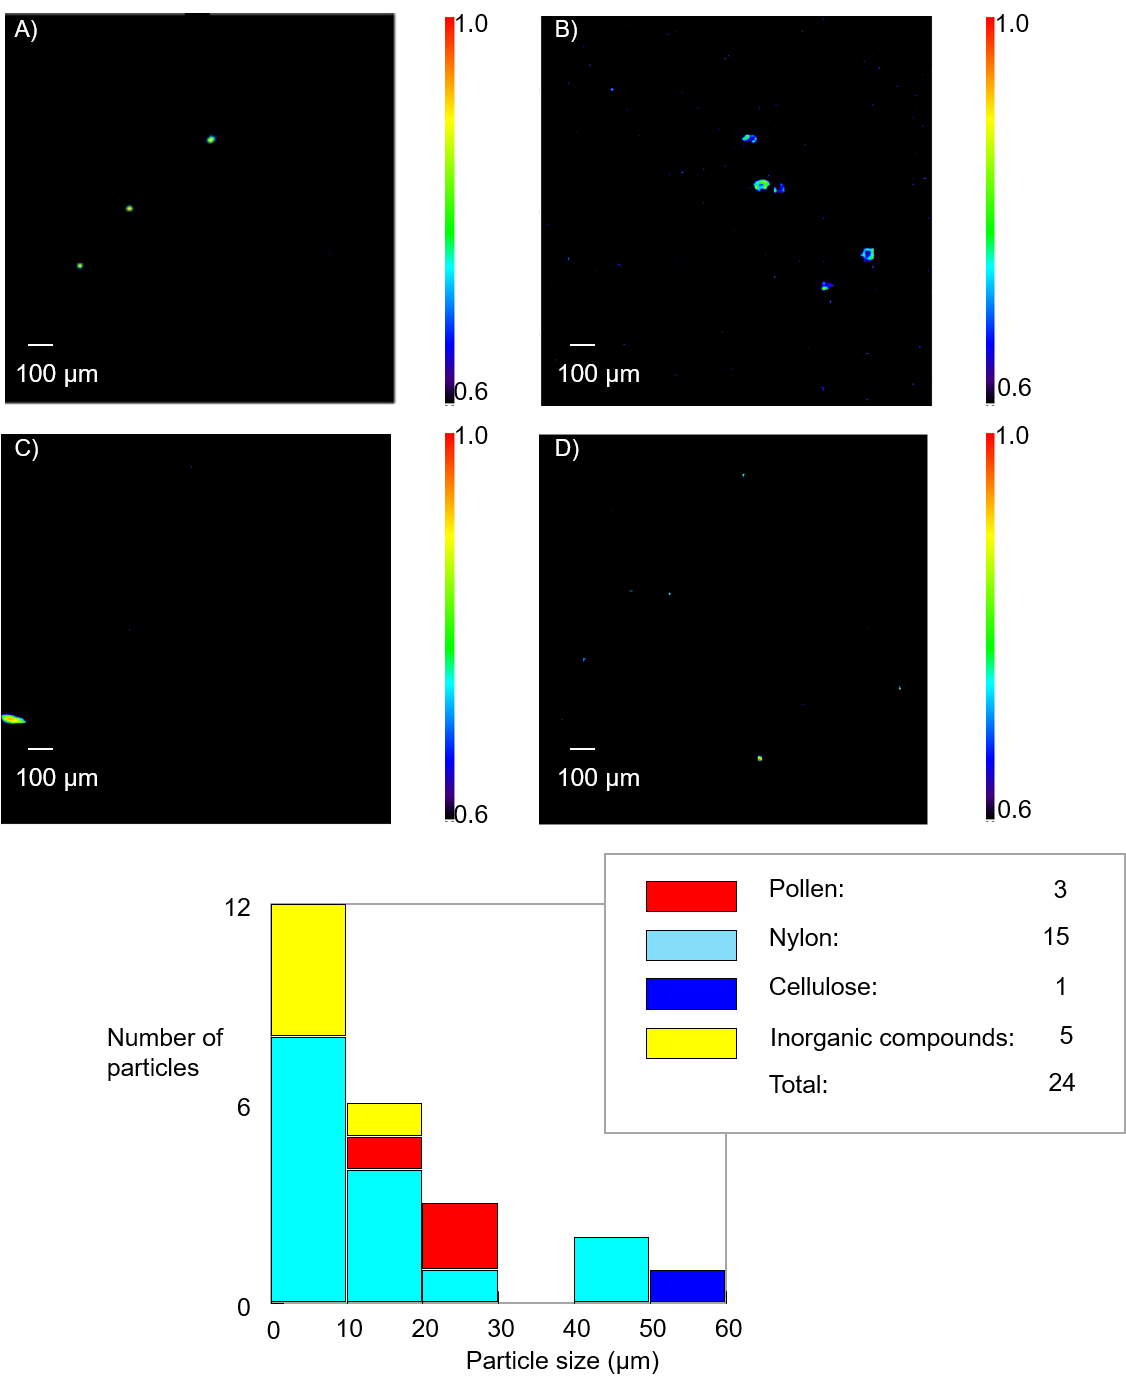
Figure 2 Chemical images and size distribution for each type of particle
A) pollen* , B) nylon, C) cellulose, D) inorganic compounds
*Particles larger than 20 µm in diameter are considered to be pollen
Note: The number of particles not classified as particles A to D is 32-(3+15+1+5)=8.
Conclusion
Combined use of a JASCO infrared microscope and the JASCO Particle Analysis software allows the number of airborne pollen grains to be evaluated. We believe that as we accumulate more measurement data, our results will become closer to those obtained using the Durham sampler method. We also expect that this analytical method will make it possible to classify the pollen type, e.g., cedar or cypress.
References
1)Norio Sahashi and Toshio Fujita, JOURNAL of ENVIRONMENTAL CONSERVATION ENGINEERING, 32, 191-195 (2003). DOI: 10.5956/jriet.32.191
2)JASCO Application Data 100-MT-0262, Imaging measurement and particle characterization of microplastics using infrared microscopy
3)Bureau of Social Welfare and Public Health, Tokyo Metropolitan Government, Tokyo Allergy Portal Site, <https://www.fukushihoken.metro.tokyo.lg.jp/allergy/en/index.html>, (accessed May 15, 2023).
Related Posts:
 Development and Applications of Full-Vacuum FT-IR…
 Fluorescence Observation and Foreign Materials…
 Microplastics Identification using Macro-ATR Unit…
 Base Material and Dye Analysis - Combined Raman and…
 Analysis of Flurbiprofen and Ketoprofen by SFC-PDA…
 Analysis of Flavanone by SFC-PDA-CD Method Scouting…