Introduction
Raman and infrared spectroscopy are well known as complementary techniques to study molecular structure and molecular function. In addition, UV-visible spectroscopy represents an optional orthogonal assessment. Although orthogonal assessment has been proven to be useful in quality analysis, it is a challenge to accurately synchronize the measurement position at the microscopic level across different systems, such as Raman, IR and/or UV-visible microscopy. To overcome this barrier, we have developed ‘IQ Frame’, a sample holder that can be easily transferred among Raman, FTIR and UV-visible micro-spectrometers.
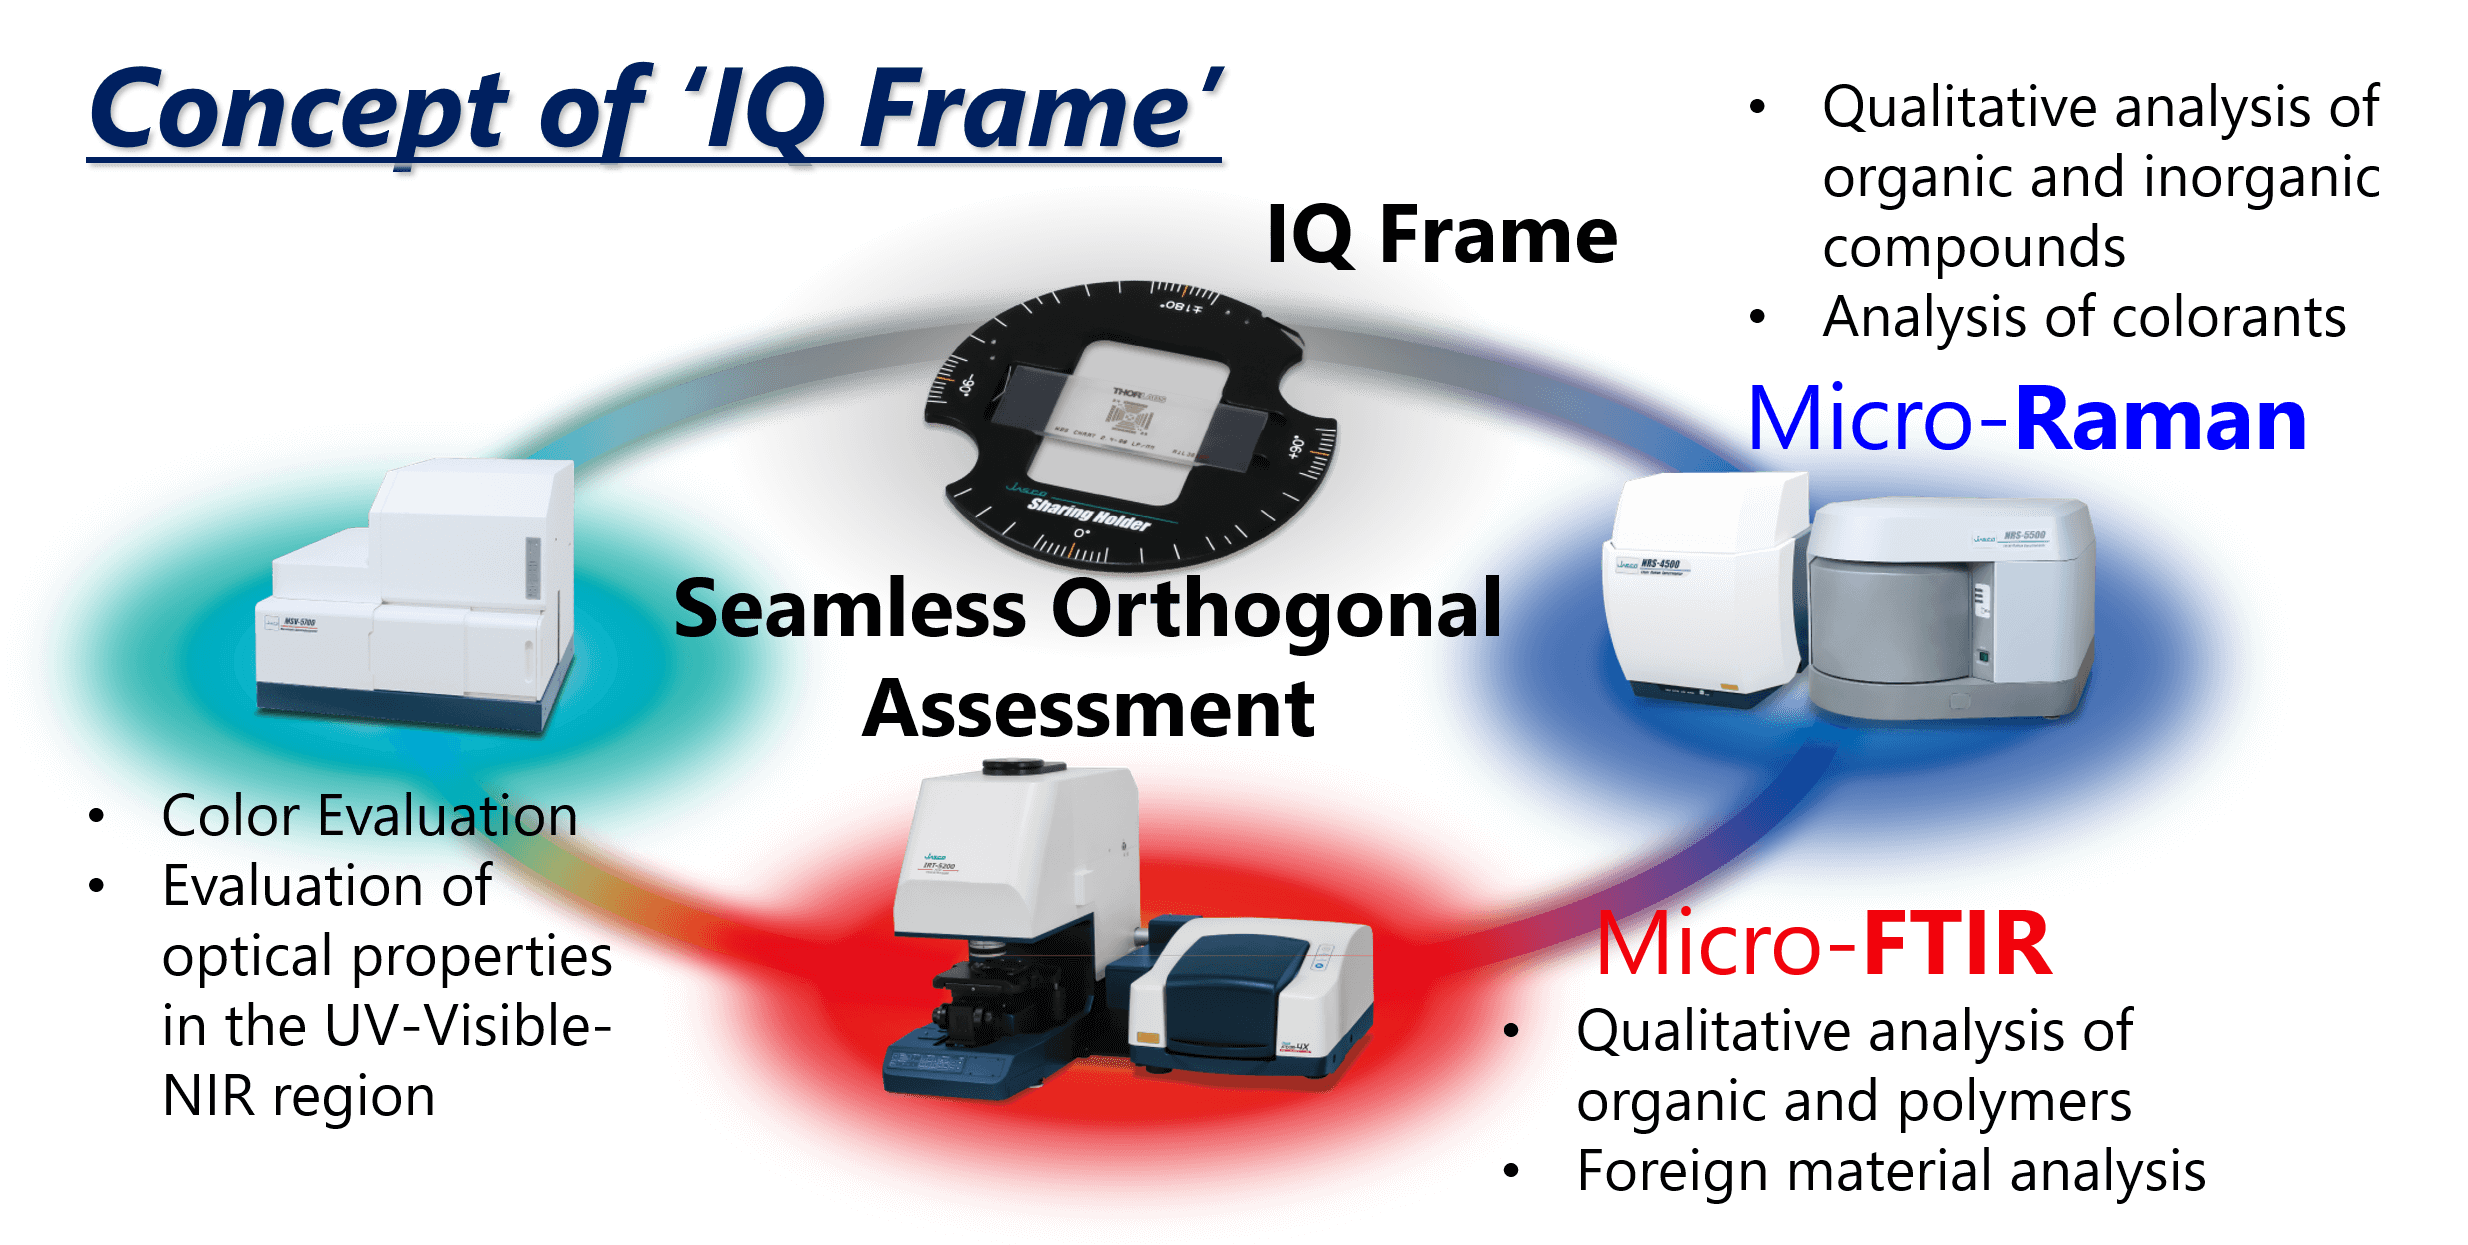
In this article, some applications included imaging measurement using IQ Frame and the features of these systems are introduced.
Features
- Shared sample holder for orthogonal assessment by micro-spectrometers
- Exact position matching is performed following two steps; First, using measurement coordinates stored in a spectrum data file, roughly select the measurement position. Second, using the image stored in the measurement data file and the live visible image, fine adjustment can be made to the stage until the sample position is perfectly matched to the previous measurement.
Experimental
Application 1: Orthogonal Assessment of Micro Fabrics by UV-Visible, Raman and FTIR Micro-Spectrometers
Sample: Colored ( green, blue ) fabrics
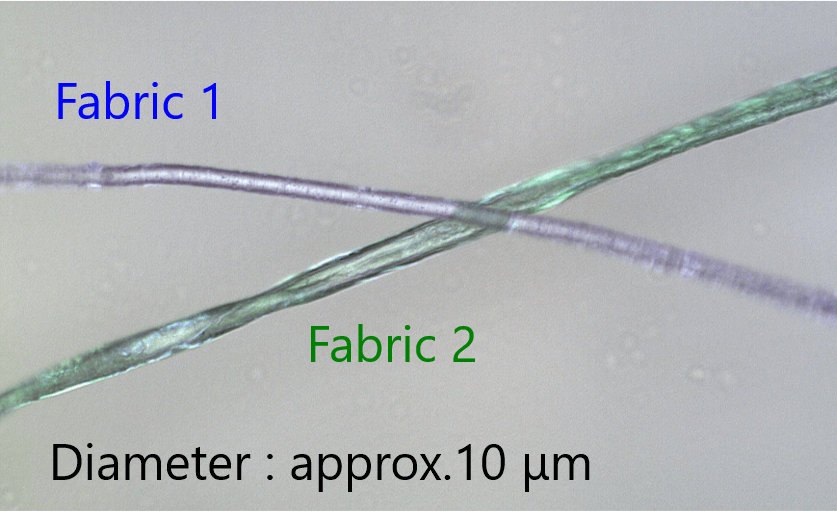
Visible image
Method: Using IQ Frame, measured identical position of each fabric by UV-visible, Raman and FTIR
Results (UV-Vis):
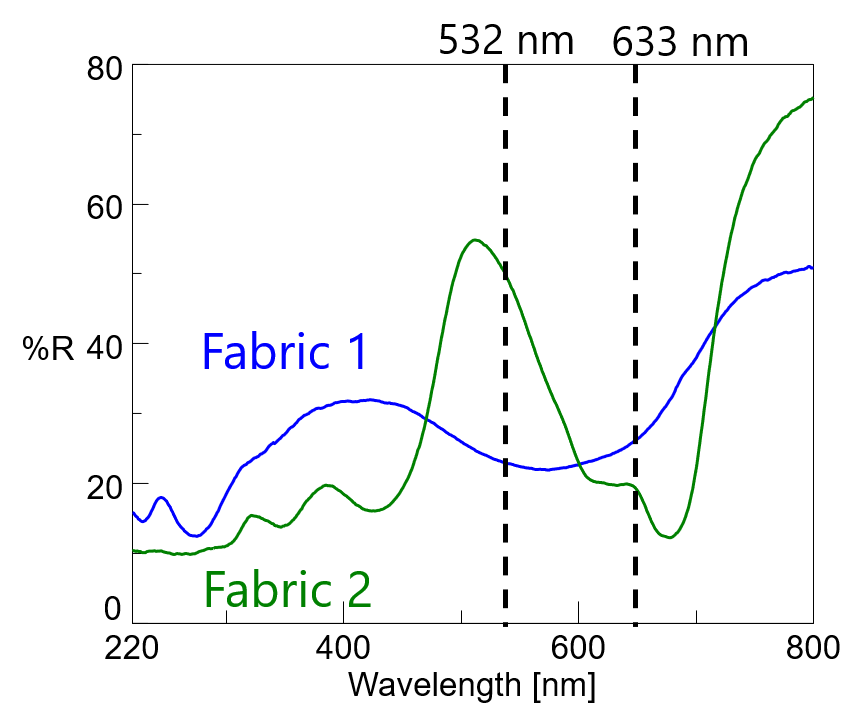
UV-Vis reflection spectra (Contributed to determine excitation laser wavelength for application of resonance Raman)
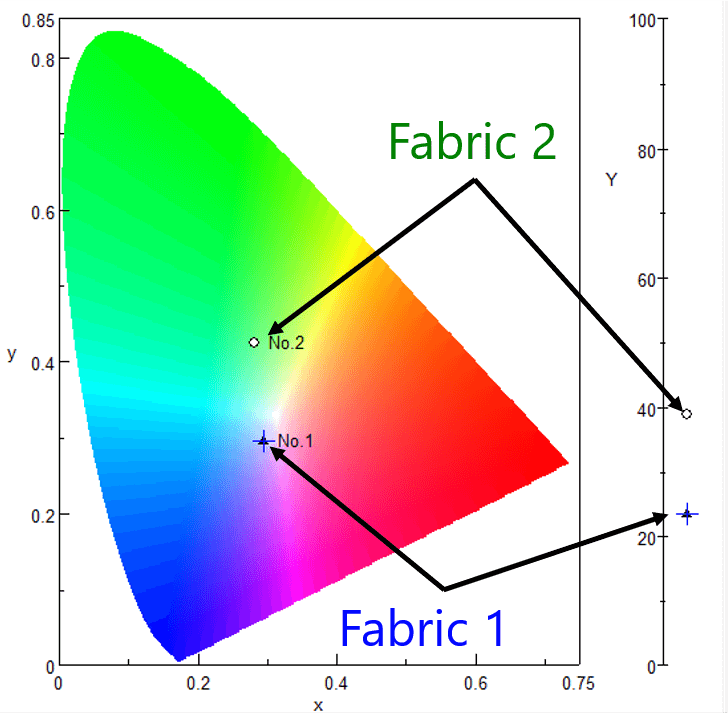
Result of color evaluation ( UV-Vis, Identified their color)
Results (Raman):
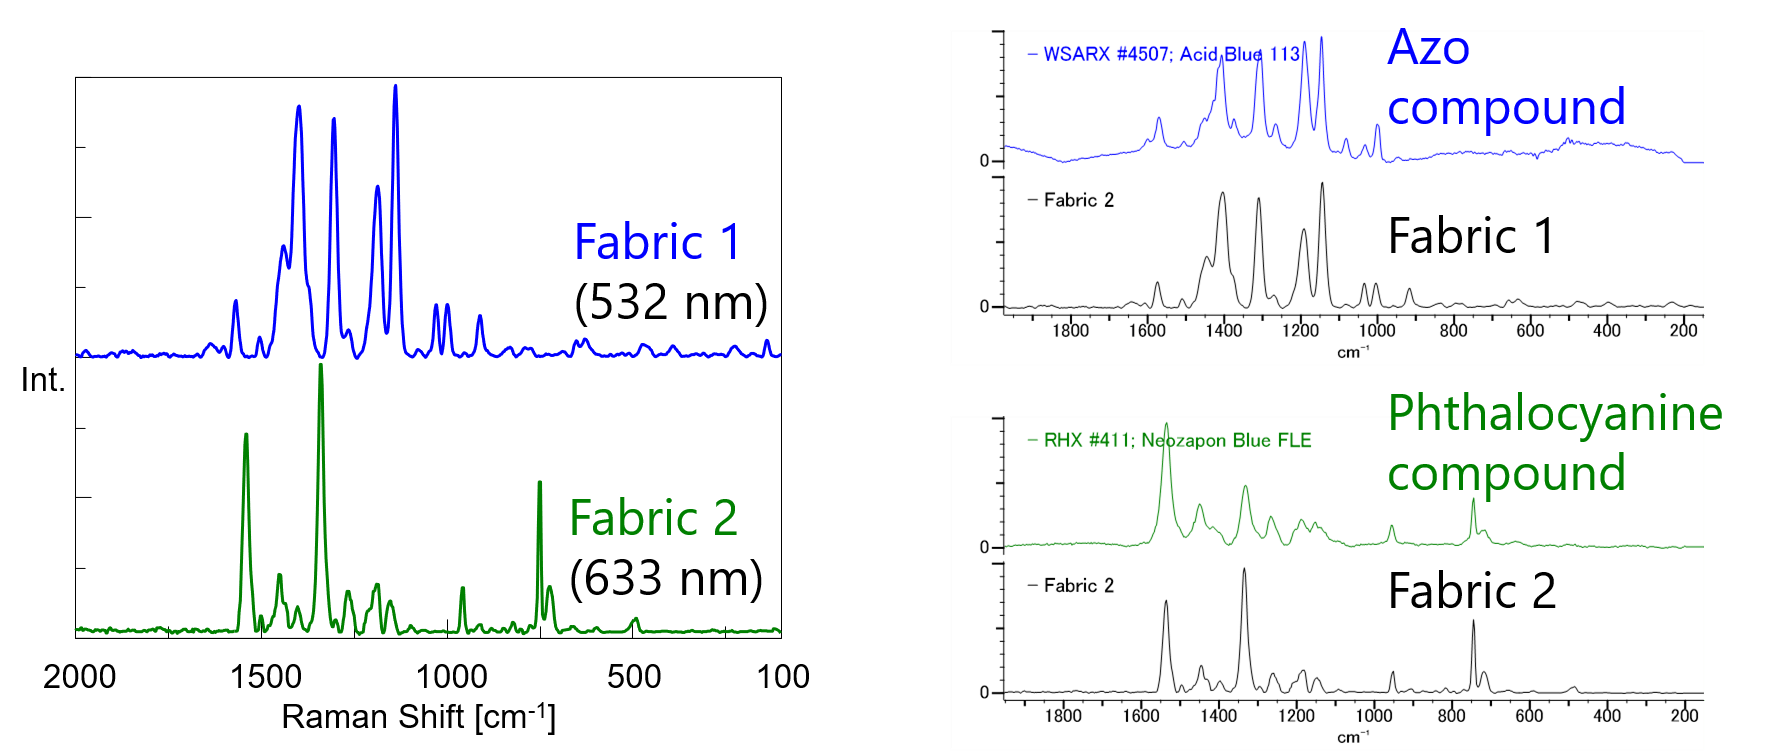
Raman spectra (left) and result of database search (right) (Identified their colorant (dye))
Results (IR):
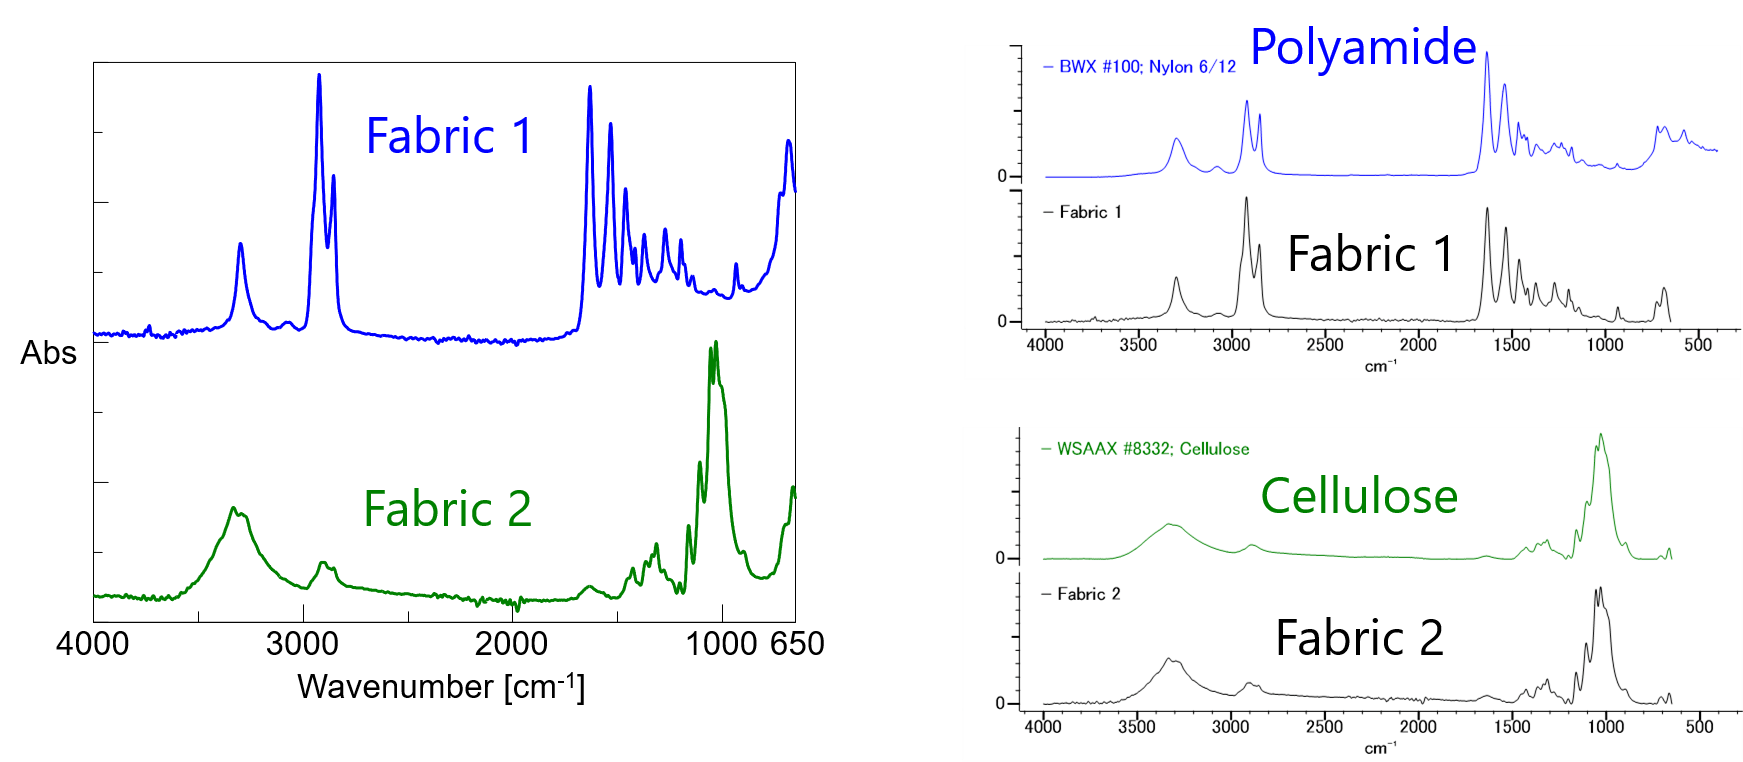
IR (ATR) spectra (left) and result of database search (right) (Identified their chemical composition)
Micro-UV-visible spectra were used to analyze the fabric colors. In addition, the UV-visible spectra were used for determination of the excitation laser wavelength for Raman measurement. In the measurement of these samples, the laser wavelength close to their absorption maximum ( 532 nm for Fabric 1 and 633 nm for Fabric 2 ) are selected. From the Raman data, we could identify information about the dyes using the phenomenon of resonance Raman. Lastly, using FTIR with micro-ATR measurement, the chemical composition of the fabrics could be determined.
Application 2: Complementary Imaging Analysis of Plastics by Raman and FTIR Micro-Spectrometers
Sample Plastic particles embedded and pressed in KBr plate
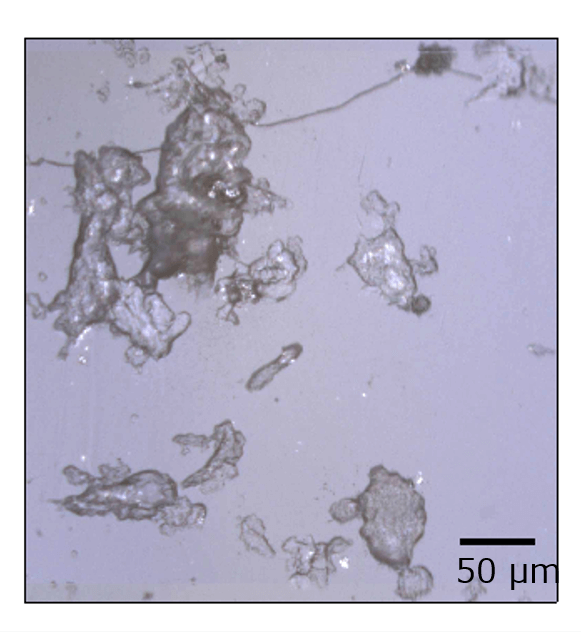
Visible image
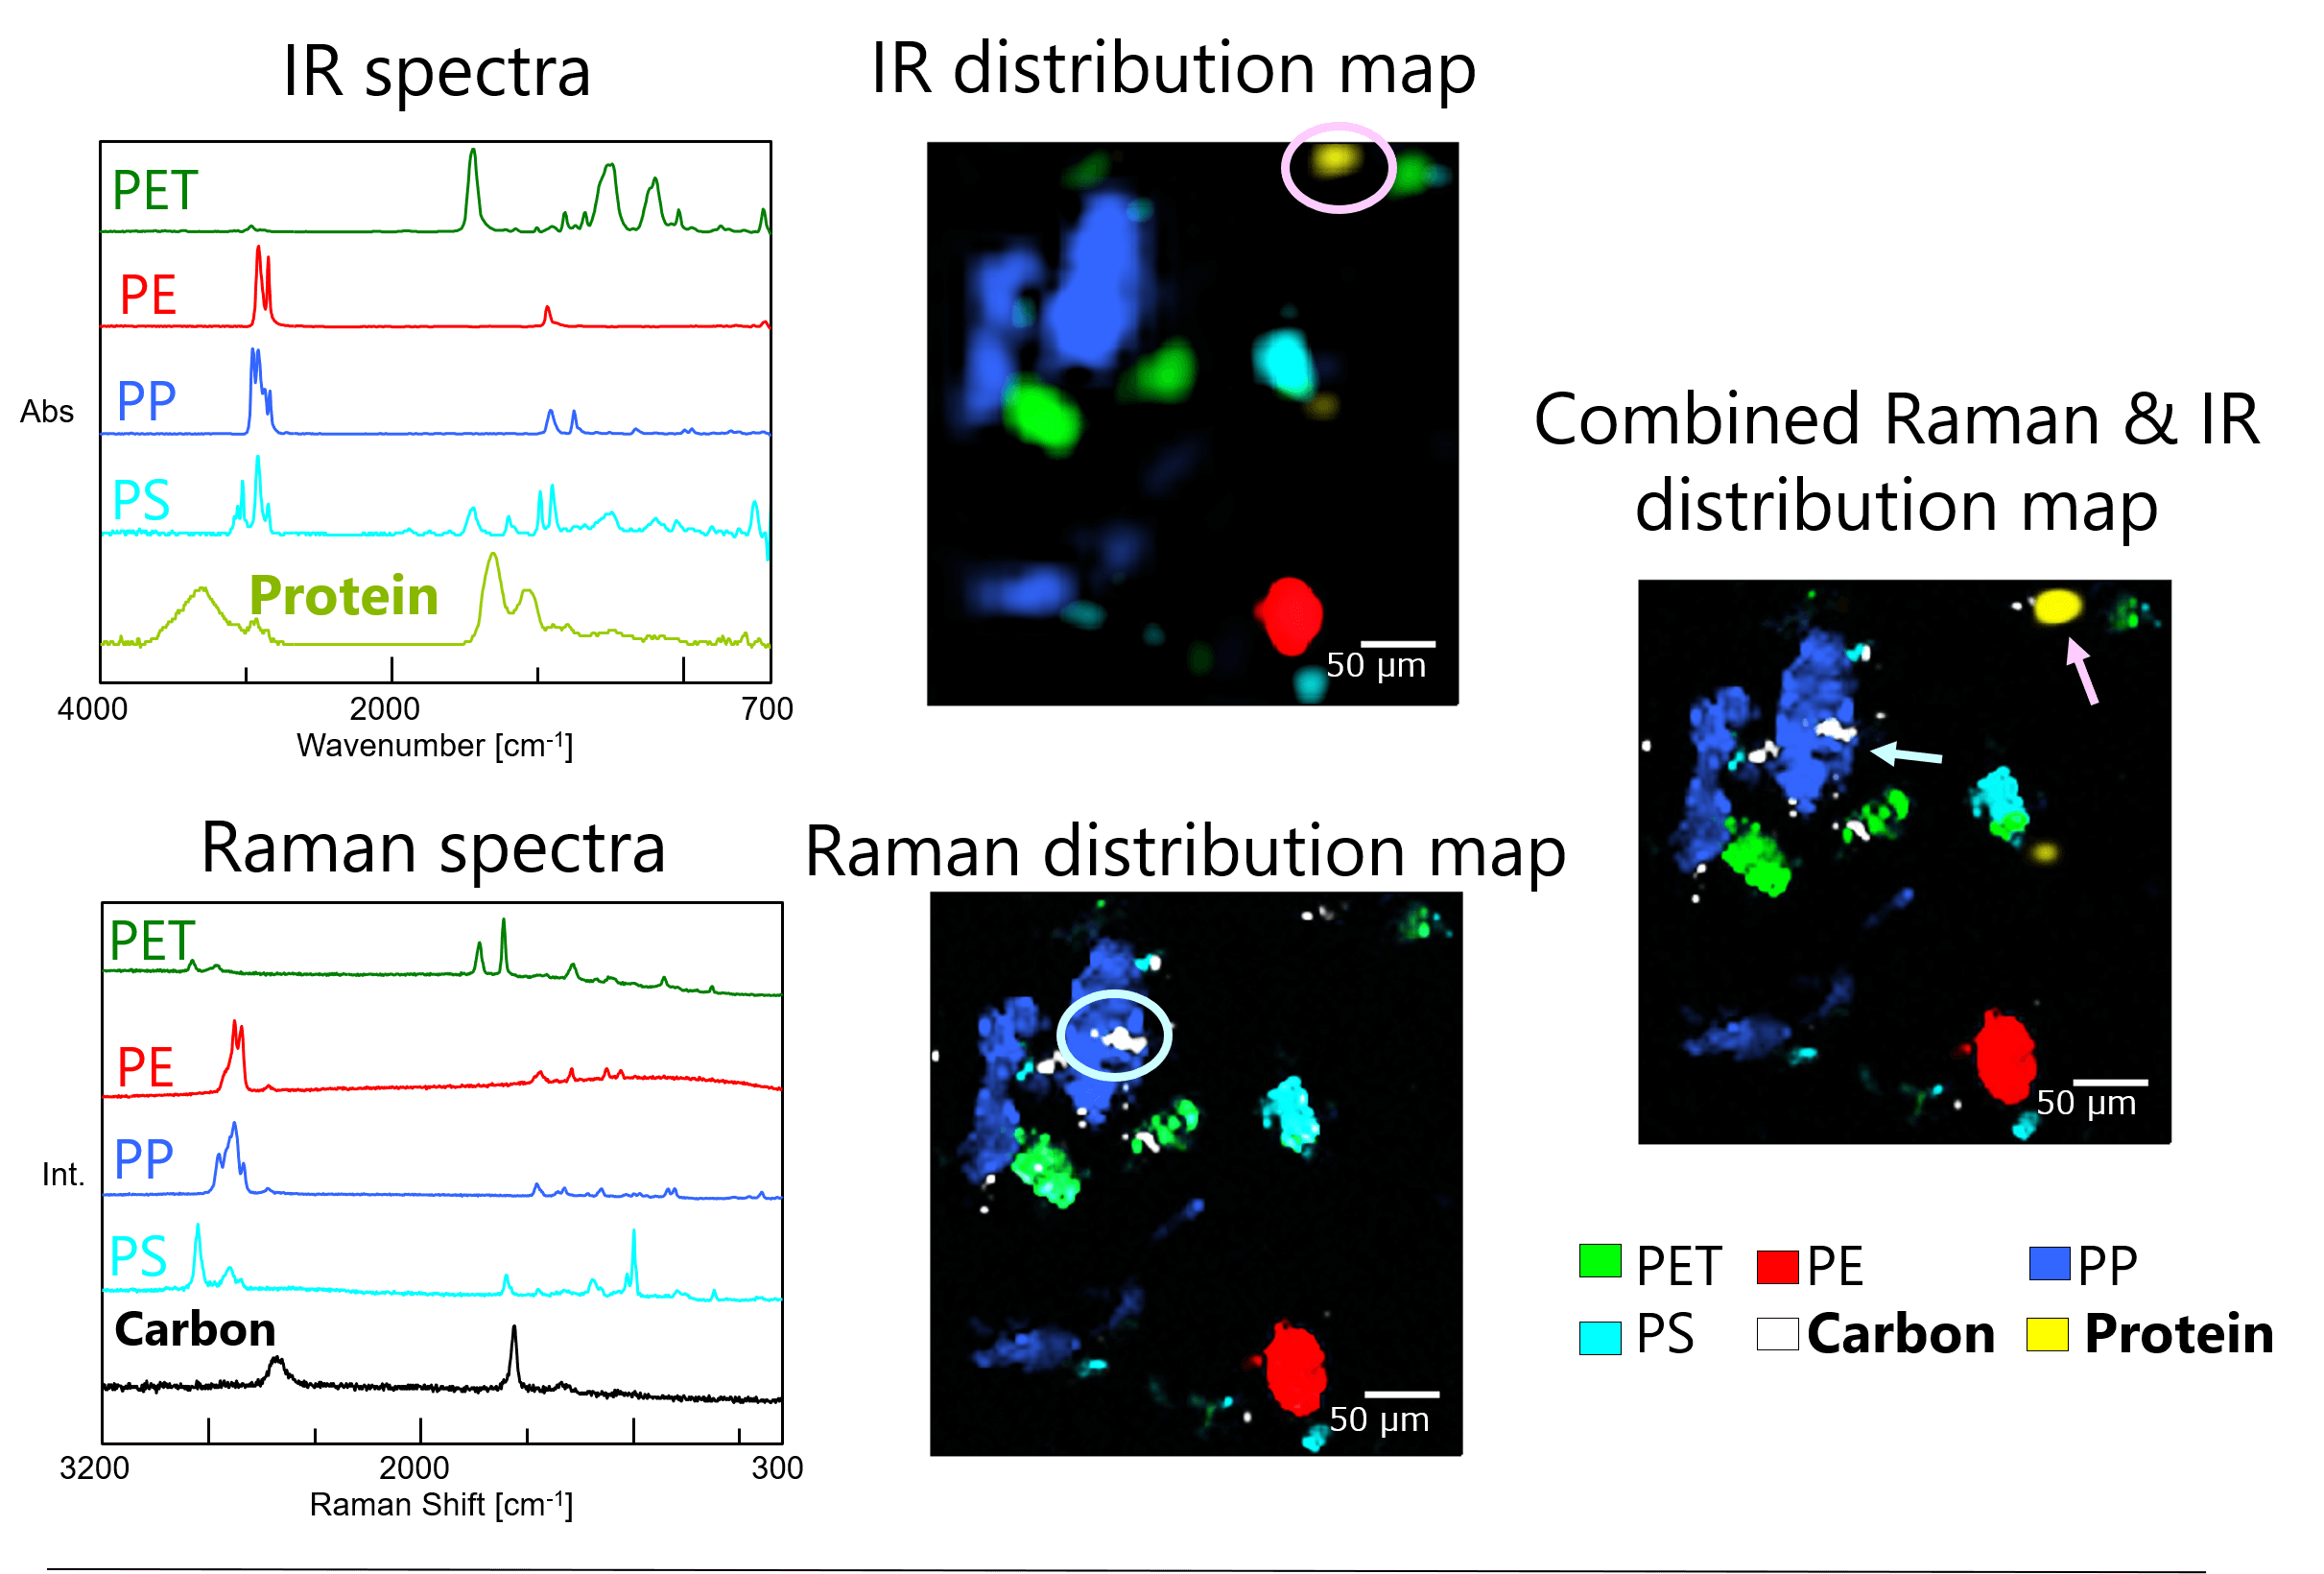
Method Using IQ Frame, imaging measurement are performed by Raman and FTIR micro-spectrometer at the identical position.
Results Using both Raman and IR enabled to detect 6 components. Because protein could be detected by only IR due to fluorescence in Raman and carbon could be detected by only Raman though four types of polymers could be detected by both Raman and IR.
Keywords
Raman, infrared spectroscopy, molecular structure, UV-Visible, micro-spectrometers, orthogonal assessment, IQ Frame, FTIR
Results
- ‘IQ Frame’ is designed for seamless analysis among JASCO Raman, FTIR and UV-visible microscopes.
- ‘IQ Frame’ Enables seamless analyses among micro-spectrometers based on coordinates information of measurement point and coincidence of visible images between each measurement.
- Applications for complementary imaging and orthogonal assessment by multiple micro-spectrometers are introduced.
References
Poster Session at ICORS (27th International Conference on Raman Spectroscopy, August 14 – 19, 2022, in Long Beach, California, USA)
Carlos Morillo1, Kohei Tamura2, Yuji Higuchi2, Erika Taira2, Kento Aizawa2, Satoko Suzuki2, Ken-ichi Akao2
1JASCO Incorporated, 28600 Mary’s court, Easton, Maryland 21601, USA
2JASCO Corporation, 2967-5 Ishikawa-machi, Hachioji, Tokyo 192-8537, Japan
Related Posts:
 Use of Diamond Compression Cell for Different Sample Types
 Evaluation of Degradation of PET by Molecular Weight…
 Evaluation of Degradation of POM by Molecular Weight…
 Evaluation of Degradation of PA6 by Molecular Weight…
 Degradation by Molecular Weight Distribution Measurements") Evaluation of Polystyrene (PS) Degradation by…
Evaluation of Polystyrene (PS) Degradation by… Introduction of New and Improved Sample Holder for…