Introduction
In recent years, there have been concerns over the release of oil and grease into water ecosystems such as oceans and rivers, since these can have negative environmental impacts, such as ecosystem damage and the production of noxious odors. Therefore, for water quality control, it is important to determine the quantity of oil and grease in water. In the past, this has been achieved using an analytical method involving the quantification of samples extracted using solvents, such as n-hexane, which is a complicated process. On the other hand, another method was validated globally as ASTM D7575, which provides easier methods for simple water quality control without extraction using hexane.
The ASTM D7575 adapts an extractor for oil and grease and calibration standard devices from Orono Spectral Solutions, Inc. (OSS). This report describes measurement examples compliant with ASTM D7575, and quantification methods for oil and grease with concentrations lower than that prescribed in ASTM D7575, by combining the JASCO FT/IR-4X infrared spectrometer and products produced by OSS.
Experimental
Apparatus
・ Infrared spectrometer – FT/IR-4X FT/IR spectrometer (Fig. 1)
・ Sample glass bottles – 100 mL
・ Ultrasonic bath – Thermostable at 40 ºC
・ 10 mL Syringe – Luer lock type
・ Volumetric flask – 100 mL
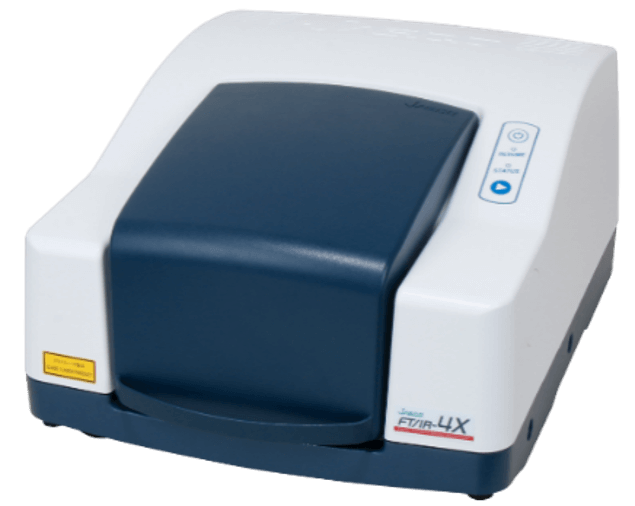
Fig. 1 FT/IR-4X FT/IR spectrometer
Items from OSS, Inc. *1
・ FTIR Card Holder (Fig. 2A) – Holds a ClearShot™ extractor in place for infrared measurements
・ ø25 mm and ø13 mm ClearShot™ extractors (Figs. 2B and 2C) – Contains oil and grease extraction membrane with luer lock connector
・ Calibration Standard Device (CSD) Set, 8 points (Fig. 2D) – Preloaded ClearShot™ extractor certified oil and grease levels + “blank (CSD No. 0)”
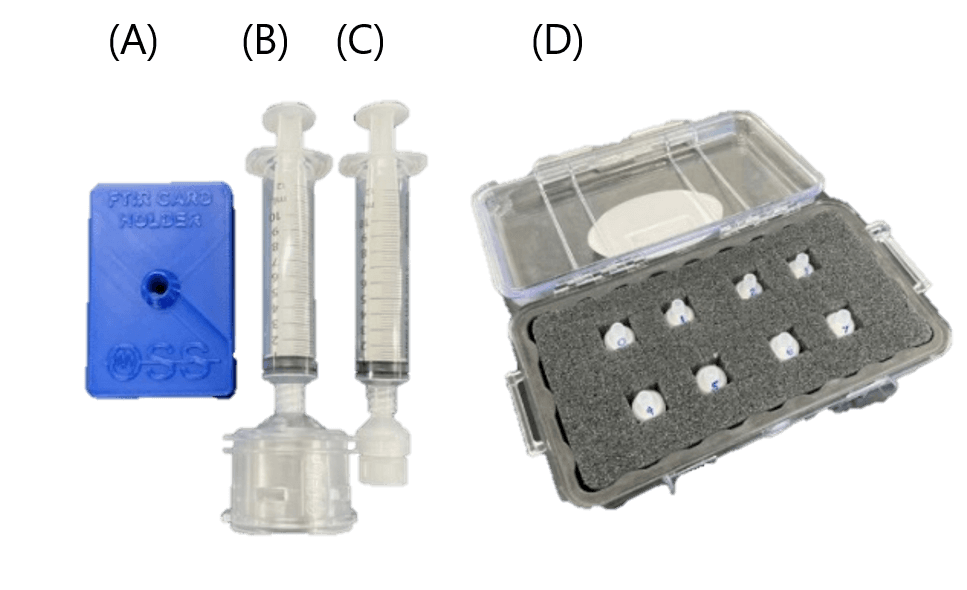
Fig. 2 Items made by OSS, Inc. (A) FTIR Card Holder (B) 10 mL Syringe + ø25-mm ClearShot™ extractor (C) 10 mL Syringe + ø13-mm ClearShot™ extractor (D) Calibration Standard Device Set, 8 Points
Reagents
・ Laboratory grade water – Deionized
・ Acetone – ACS, residues less than 1 mg/L
・ Hexadecane – 98 % minimum purity
・ Stearic acid – 98 % minimum purity
*1 JASCO does not provide products of OSS. Please contact your nearest OSS distributor.
Keywords
ASTM D7575, Oil in Water, Water quality control
Results
Calibration and Standardization
Calibration curves between the concentration of oil and grease and absorbance were created in order to predict the concentration of samples with unknown concentrations.
<Procedure>
1. Measure the infrared spectrum of CSD No. 0 (blank) as a background.
2. Measure the infrared spectra of CSD Nos. 1-7. (Fig. 3A)
3. Determine the heights of peaks around at 2920 cm-1 (baseline between 2990 and 2800 cm-1). (Table 1)
4. Plot the peak height against the known concentration and draw the calibration curve. (Fig. 3B)
<Results>
An R2 value of 0.9981 was obtained for the fitted calibration curve. This is fully compliant with ASTM D7575, which specifies R2 > 0.97. Hereafter, this calibration curve was used to predict the concentration of samples.
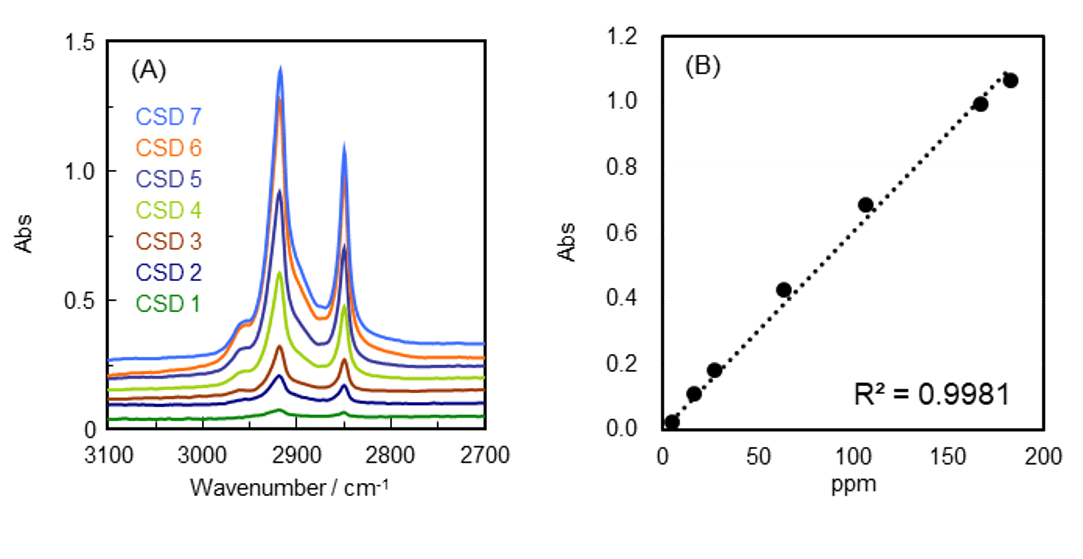
Fig. 3 (A) Infrared spectra of CSD Nos. 1-7. (Offset for clarity) (B) Plot of absorbance against concentration, and fitted calibration curve (R2 = 0.9981)
Table 1 Results
| CSD No. | Concentration (ppm) | Abs |
| 1 | 4.28 | 0.026 |
| 2 | 16.2 | 0.109 |
| 3 | 26.7 | 0.185 |
| 4 | 63.80 | 0.427 |
| 5 | 106.81 | 0.687 |
| 6 | 167.35 | 0.997 |
| 7 | 182.65 | 1.069 |
Determination of Precision and Percent Recovery
Using prepared 40-ppm oil and grease spike solutions, the precision and percent recovery were determined.
<Procedure 1. Preparation of Undiluted Solution of Oil and Grease>
1. Weigh 400+/-4 mg of hexadecane and 400+/-4 mg of stearic acid in a 100 mL volumetric flask.
2. Add acetone (not up to 100 mL).
3. Place the flask in an ultrasonic bath at 40 ºC for 20 min to achieve complete dissolution.
4. Remove the flask from the bath and leave it to cool to room temperature.
5. Add acetone up to 100 mL, and shake the solution to make it homogenous.
6. Collect the solution into a sample glass bottle with a PTFE cap.
<Procedure 2. Sample Extraction>
1. Dilute the undiluted solution in deionized water to make a 40 ppm solution.
2. Overfill a 10 mL syringe with >10 mL of the diluted sample and remove bubbles.
3. Attach the syringe to the ø25 mm ClearShot™ extractor (upward).
4. Filter the 10 mL sample solution through a membrane.
5. Discard the filtered solution and dry the extractor in which the sample was captured using dry air.
(Before sample extraction, measure a background infrared spectrum of the extractor.)
<Procedure 3. Infrared Measurements and Analyses>
1. Attach the well-dried extractor to the FTIR Card Holder.
2. Set the holder in the FT/IR and measure the infrared spectrum.
3. Determine the peak height and calculate the concentration of the sample using the prepared calibration curve.
(A total of 4 samples were prepared through the above process.)
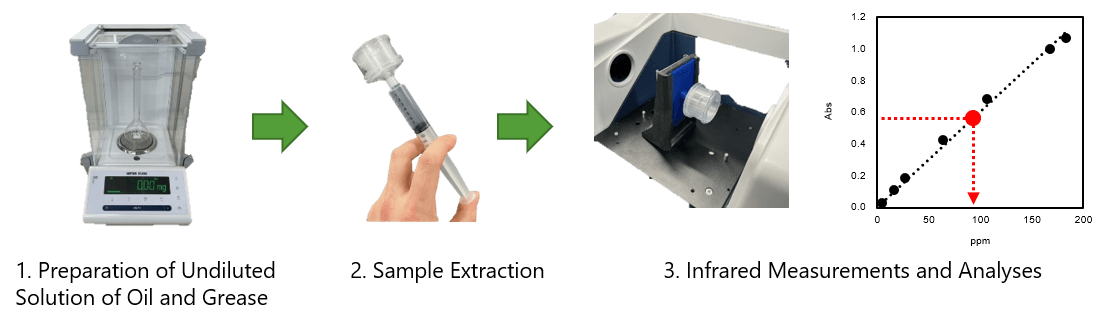
Fig. 4 Measurement flow
<Results>
From the results, the average percent recovery is calculated to be 99.7 % with a relative standard deviation of 4.9 % (Table 2.2). Compared with the values for ASTM D7575, these results fall well within the limits.
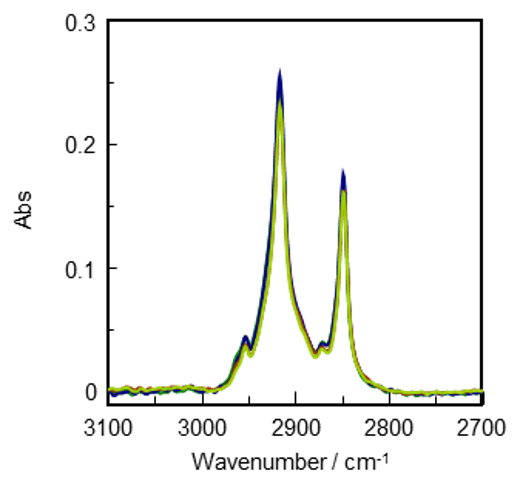
Fig. 5 Infrared spectra of 40-ppm sample solutions (4 samples)
Table 2.1 Results
| Sample No. | Abs | Concentration (ppm) |
| 1-4 | 0.245 | 40.4 |
| 0.253 | 41.7 | |
| 0.228 | 37.6 | |
| 0.231 | 38.1 |
Table 2.2 Comparison with ASTM D7575
| Average Percentage Recovery (%) | Relative Standard Deviation (%) | |
| Experimental Value | 99.7 | 4.9 |
| ASTM D7575 | 88-105 | <11 |
Determination of Method Detection Limit (MDL) and Reporting Limit
Using prepared oil and grease spike solutions with a concentration of 4 ppm, the detection limit and reporting limit were determined.
<Procedure>
1. Dilute the undiluted sample solution to 4 ppm.
2. Regarding the procedure for sample extraction, infrared measurements and analyses, refer to the previous section.
(A total of 7 samples were prepared through the above process.)
<Results>
From the results, the lower detection limit was calculated to be 1.52 ppm (Fig. 6 and Table 3). In addition, the lower reporting limit was calculated to be 4.84 ppm. Since ASTM D7575 prescribes a reporting range of 5 to 200 ppm, these results comply with the standard.
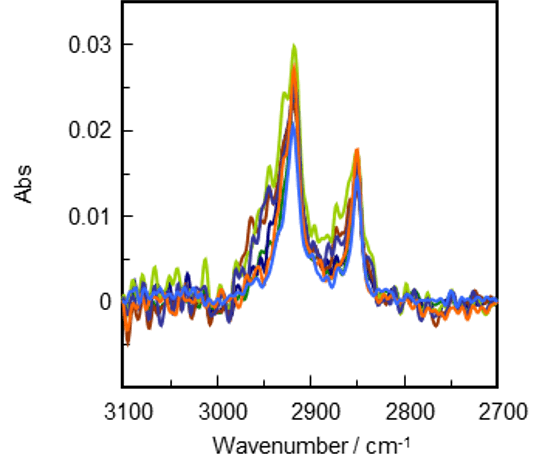
Fig. 6 Infrared spectra of 4 ppm sample solutions (7 samples)
Table 3 Results
| Sample No. | Abs | Concentration (ppm) |
| 1-7 | 0.0243 | 4.01 |
| 0.0258 | 4.25 | |
| 0.0230 | 3.79 | |
| 0.0296 | 4.88 | |
| 0.0255 | 4.20 | |
| 0.0270 | 4.45 | |
| 0.0205 | 3.38 |
Standard deviation of concentration: 0.484
Lower detection limit: 3.143 x (Std. Dev) = 1.52
Lower reporting limit: 10 x (Std. Dev) = 4.84
Quantification of Lower-Concentration Oil and Grease in Water
In the previous section, a ø25-mm ClearShot™ extractor was used for experiments compliant with ASTM D7575. OSS also provides a ø13-mm ClearShot™ extractor for a determination range of 0.2 ppm to 40 ppm. Therefore, we attempted to quantify oil and grease in water at concentrations lower than 4 ppm using the ø13-mm ClearShot™
<Procedure>
1. Prepare a calibration curve for the low-concentration range using CSDs for the ø13-mm ClearShot™ extractor.
2. Dilute the undiluted sample solution to 1 ppm. [See previous comment.]
3. Regarding the procedure for sample extraction, infrared measurements and analyses, refer to the previous section describing the ø25-mm ClearShot™.
(A total of 7 samples were prepared through the above process.)
<Results>
The fitted calibration curve drawn using the four standard samples gave R2 = 0.9999 (Fig. 7A), which indicated a high degree of linearity. From the results of 7 sample measurements, the average percent recovery was calculated to be 93.6 % with a relative standard deviation of 5.8 % (Table 4.2) and therefore satisfies the ASTM D7575 specification. This allows oil and grease in water at a low concentration of 1 ppm to be determined.
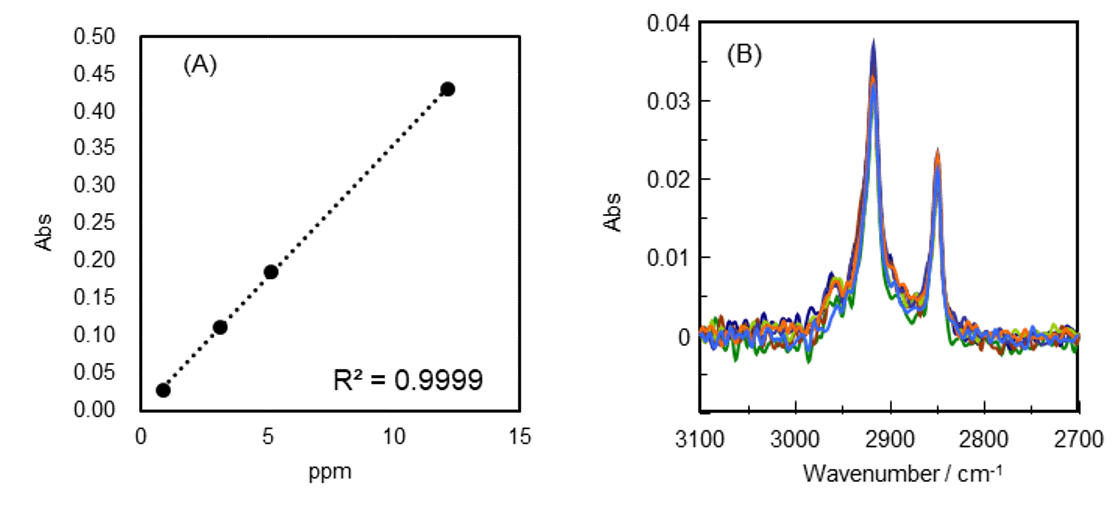
Fig. 7 (A) Plot of absorbance against concentration, and calibration curve (R2 = 0.9999) (B) Infrared spectra of 1 ppm sample solutions (7 samples)
Table 4.1 Results
<
| Sample No. | Abs | Concentration (ppm) |
| 1-7 | 0.0326 | 0.919 |
| 0.0324 | 0.914 | |
| 0.0347 | 0.978 | |
| 0.0313 | 0.883 | |
| 0.0368 | 1.038 | |
| 0.0329 | 0.928 | |
| 0.0318 | 0.897 |
Table 4.2 Comparison with ASTM D7575
| Average Percentage Recovery (%) | Relative Standard Deviation (%) | |
| Experimental Value | 93.6 | 5.8 |
| ASTM D7575 | 88-105 | <11 |
Conclusion
In this report, an experimental example compliant with ASTM D7575 was introduced. In addition, combining another extractor with the JASCO FT/IR spectrometer allows quantification of oil and grease in water at concentrations lower than that prescribed by ASTM D7575.
The results showed that the JASCO FT/IR spectrometer is a powerful instrument for tackling recent environmental issues concerning oil and grease in water, and can help to improve global water quality control.
Supplementary Information
- The method is based on mass loading. So if the sample had a very low concentration of oil, the amount of liquid added into the extractor could be increased. So the application would work very well in measuring oil in drinking water manufactured from salt water or reclaimed process water. In this case, one would volume correct the answer provided by the FT/IR unit. Similarly, if the sample had a very high concentration of oil, the volume could be reduced.
- The method, because of the power of the FT/IR unit, can automatically identify the oil or oils in the sample, should that be a desire of the user. This is something unique that this method offers. This would be accomplished by generating an oil library of the specific oils that could be the cause of oil in the water and then, without any additional effort or time from the user, the system would automatically generate the list.
- Once the oil has been deposited on the extractor, the oil concentration can be measured again, and again, and again.


