Introduction
Hexavalent chromium (Cr(VI)) is a form of metallic chromium. Cr(VI) compounds are widely used in industrial processes including stainless steel production, leather tanning, and textile manufacturing. While Cr(VI) compounds have many practical uses, they can be harmful to the human body. In fact, these compounds are known to cause cancer. In addition, they target the respiratory system, kidneys, liver, skin and eyes.
Therefore, international standards have been set for chromium. For example, the EPA (U.S. Environmental Protection Agency) has a drinking water standard of 0.1 milligrams per liter (mg/L) or 100 parts per billion (ppb) for total chromium. This includes all forms of chromium, including Cr(VI). The most widely used method for quantitative analysis of Cr(VI) is the diphenycarbazide absorption method using a UV-visible spectrophotometer.
This application note describes the use of a JASCO V-730 spectrophotometer to determine the detection and quantitation limits for chromium. The spectrophotometer was equipped with a vacuum sipper and a 50-mm path flow cell, which enables efficient operation without time-consuming manual cell cleaning, and can be used for samples with low absorbance. A calibration curve was created using a color reaction kit from a commercial reagent manufacturer for simple quantitative determinations.
Experimental
Sample
Standards: 0, 0.01, 0.02, 0.04, 0.05, 0.06, 0.08, and 1 mg/L K2CrO4 aqueous solutions
Test solutions: 0.005 and 0.01 mg/L K2CrO4 aqueous solutions
Reaction reagent: LR-Cr6+ color kit for Cr(VI) (KYORITSU CHEMICAL-CHECK Lab., Corp.)
System
Instrument: V-730 UV-Visible spectrophotometer
Accessory: NQF-929 Vacuum sipper with long-path flow cell
Software: VWQM-978 Spectrum quantitative measurement program
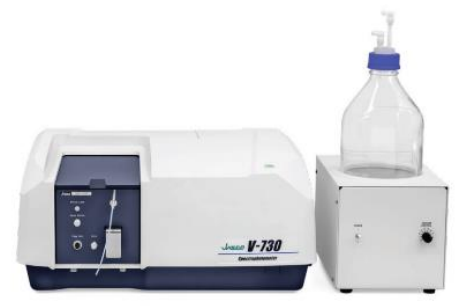
Fig. 1 UV-Visible spectrophotometer equipped with a vacuum sipper
Conditions
Measurement range: 700 – 400 nm
Data interval: 0.1 nm
Bandwidth: 1.0 nm
Response: 0.96 sec
Scan speed: 200 nm/min
Path length: 50 mm
Keywords
Water testing, hexavalent chromium, chromium, color reaction, vacuum sipper, long-path flow cell
Results
Creating a calibration curve
A calibration curve was obtained using standards with the following concentrations of Cr(VI): 0, 0.01, 0.02, 0.04, 0.05, 0.06, 0.08, and 1 mg/L. The standard solutions turned pink after adding the reaction reagent, except the 0 mg/L solution. Each standard was measured three times. The spectra of the standards showed a peak at 542 nm, with a sloped baseline (Fig. 1).
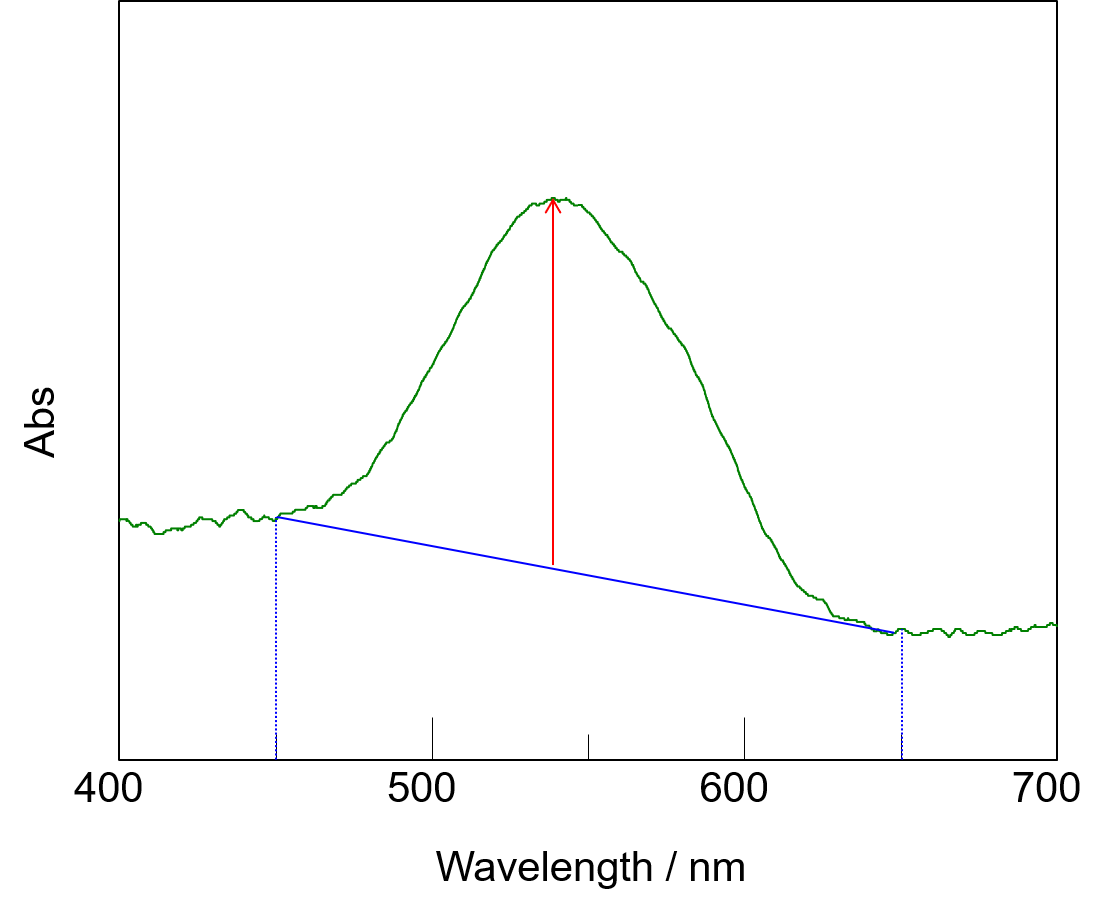
Fig. 2 Spectrum of Cr(IV)
The baseline slope was most likely due to residues in the reaction reagent, which did not dissolve even after the reaction was completed. Therefore, the baseline was drawn between the absorbance values at 450 and 650 nm. The calibration curve showed a high degree of linearity with a coefficient of determination (R2) of 0.999 (Fig. 2).
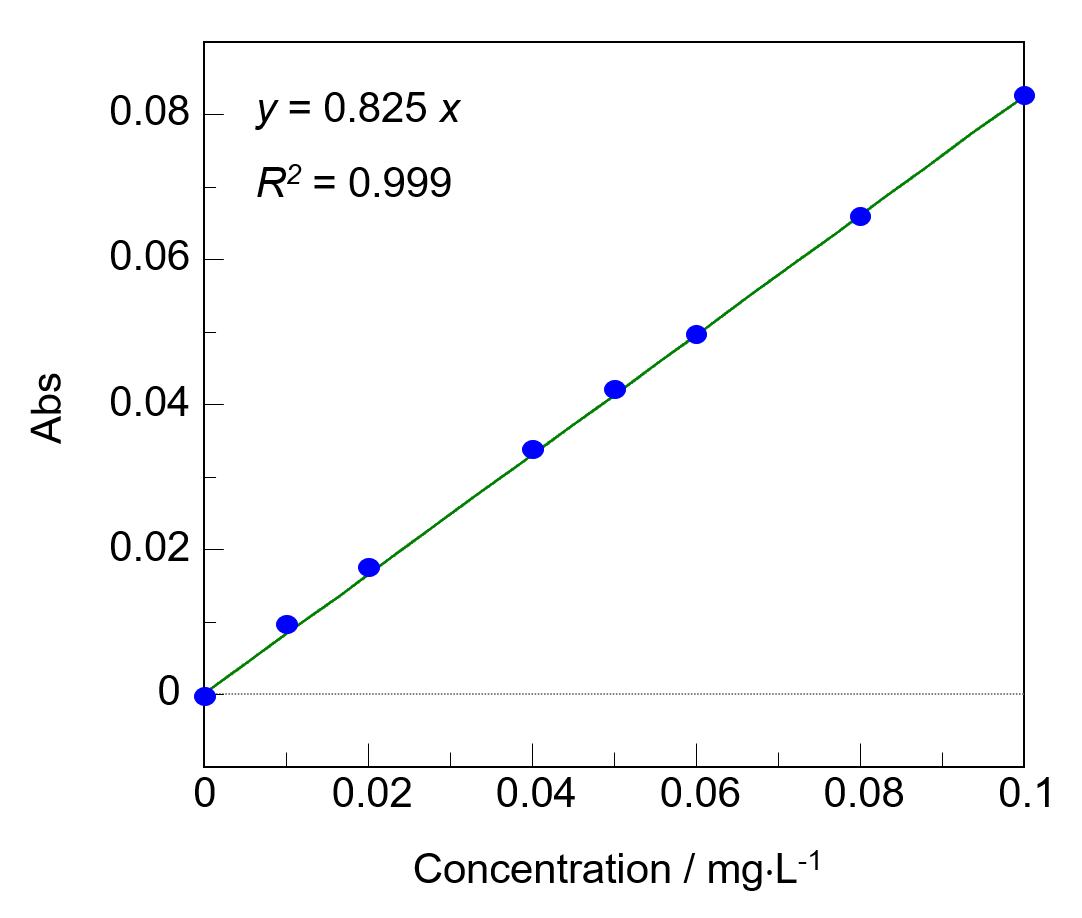
Fig. 3 Calibration curve
The limits of detection and quantitation were 0.0014 and 0.0048 mg/L, respectively, as determined based on 3σ and 10σ, where σ is a standard deviation of 10 measurements of the 0 mg/L standard solution.
Testing the calibration curve
Solutions were prepared with Cr(VI) concentrations of 0.005 and 0.01 mg/L to test the obtained calibration curve. Each test solution was measured five times, and the concentrations were determined using the calibration curve (Table 1).
Table 1 Quantitation results
| No. | Test solutions / mg L-1 | |
| 0.005 mg L-1 | 0.01 mg L-1 | |
| 1 | 0.0051 | 0.0095 |
| 2 | 0.0042 | 0.0107 |
| 3 | 0.0046 | 0.0094 |
| 4 | 0.0048 | 0.0099 |
| 5 | 0.0052 | 0.0100 |
| Ave. | 0.0048 | 0.0099 |
| CV | 8.42 % | 5.20 % |
The determined concentrations matched the prepared concentrations, validating the accuracy of the curve. In addition, the coefficient of variation (CV) for the five measurements was less than 10%, indicating the high precision of the system.
Conclusion
– The long-path flow cell enabled low-absorbance measurements. The measurement accuracy at low absorbance was validated by the high linearity and the accuracy of the calibration curve.
– The vacuum sipper significantly reduced the time for cell cleaning to six times less than that for the standard cell holder*.
– This system can potentially be applied to the screening of a large number of samples with low absorbance.
*Based on the cell cleaning time required using a vacuum sipper or a standard cell holder. With a vacuum sipper, cell cleaning was performed by flushing with ultrapure water and blowing air through the flow, both of which were achieved simply by pushing the lever on the sipper. With a standard cell holder, the cell was washed five times with ultrapure water, followed by flushing with ethanol and acetone (two times each), and then blowing with N2 gas. These process were performed manually.
References
- National Institute of Environmental Health Sciences: “Hexavalent Chromium” <https://www.niehs.nih.gov/health/topics/agents/hex-chromium/index.cfm>, (accessed 2023.04.05)
- International Agency for Research on Cancer: “List of Classifications” <https://monographs.iarc.who.int/list-of-classifications>, (accessed 2023.04.05)
- U.S. Department of Labor: “Hexavalent Chromium” <https://www.osha.gov/hexavalent-chromium>, (accessed 2023.04.05)
- U.S. Environmental Protection Agency: “Chromium in Drinking Water” <https://www.epa.gov/sdwa/chromium-drinking-water>, (accessed 2023.04.05)


