Introduction
Many measurement methods such as CD measurement, fluorescence measurement and fluorescence anisotropy are complementarily used for protein structure analysis. With J-1500 circular dichroism spectrometer, multiple analysis for one sample can be realized because J-1500 corresponds to many measurement modes such as CD, absorption, fluorescence, florescence anisotropy and linear dichroism (LD) spectrum. (Multi-probe measurement)
Table 1 Structural information reflecting each measurement mode
| Far-UV region CD spectrum | CD signal derived from a peptide bond reflecting the secondary structure of protein |
| Near-UV region CD spectrum | CD signal derived from the side chain of aromatic amino acids reflecting the tertiary structure of a protein |
| Fluorescence spectrum | Fluorescence signal reflecting environmental change of side chain of aromatic amino acids in protein |
| Fluorescence anisotropy | Signal reflecting the rotational motility of the side chain of aromatic amino acids in protein |
In this report, the temperature controlled CD/fluorescence simultaneous spectral measurement of 12 mg (0.04 mg/mL, 300 mL) α-chymotripsin was performed, and secondary structure and tertiary structure of α-chymotripsin was analyzed. J-1500 CD spectrometer, FMO-522 emission monochromator, PTC-510 water-cooled peltier thermostatted cell holder, CD/fluorescence micro quartz cell (5 mm x 5 mm) and 5 mm microcell jacket were used in this experiment.
J-1500 CD Spectrometer
Experimental
Measurement program: Temperature/Wavelength Scan Measurement Program
Sample: α-chymotripsin aqueous solution
Rising temp. condition: 1 ºC/min
Measurement temp.: 20 ºC-80 ºC (5 ºC interval, temp. rise was stopped during spectrum measurement)
Excitation wavelength: 280 nm
Keywords
Microscale measurement, secondary structure, tertiary structure
Results
Figure 1 shows the temperature control CD spectrum of the α-chymotripsin. With rise in temperature, the negative peak at 203 nm is shifted to 199 nm and CD intensity is increased. Changes in far-UV CD spectrum below 250 nm reflect changes in the secondary structure of protein, and analysis of protein secondary structure can be used to estimate the changes in the abundance ratio of secondary structure.
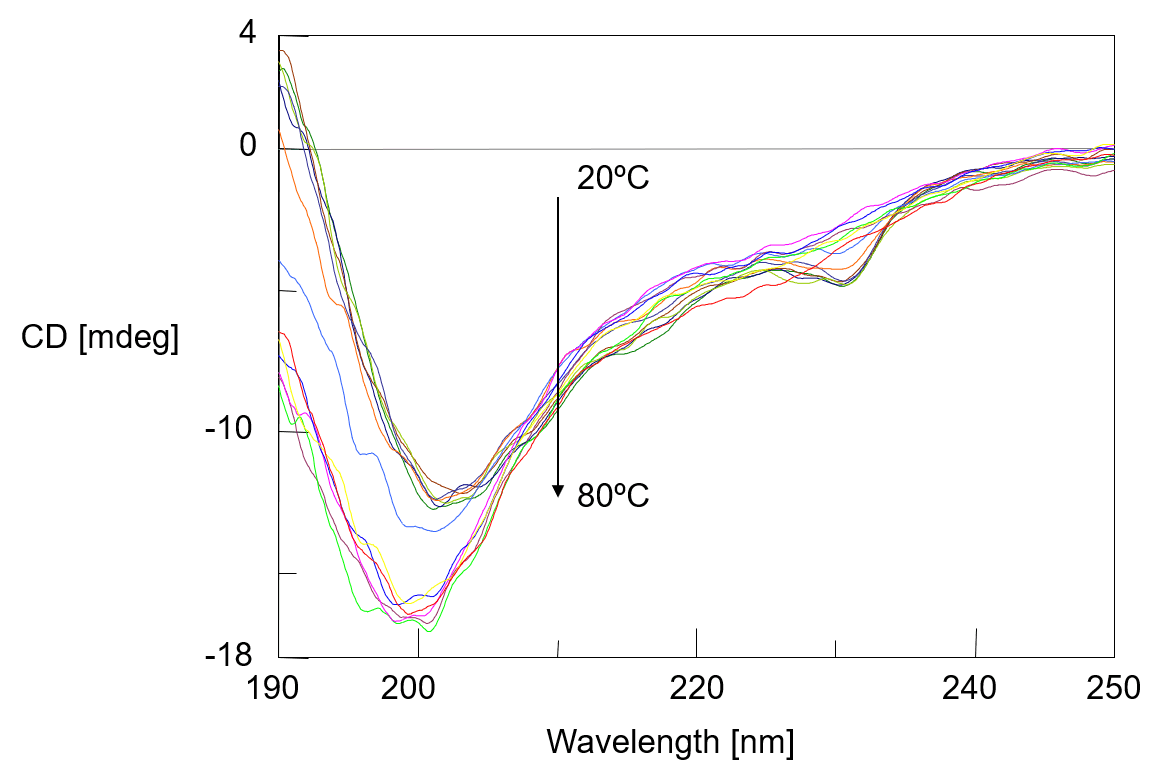
Fig. 1 Temperature control CD spectra of α-chymotripsin
Figure 2 shows the secondary structure change of α-chymotripsin caused by temperature change estimated by [JWMVS-529 CD multivariate SSE analysis] program. The ratio of the random structure increases most greatly at from 50 ºC to 55 ºC, indicating that the secondary structure is largely denatured in this temperature range.
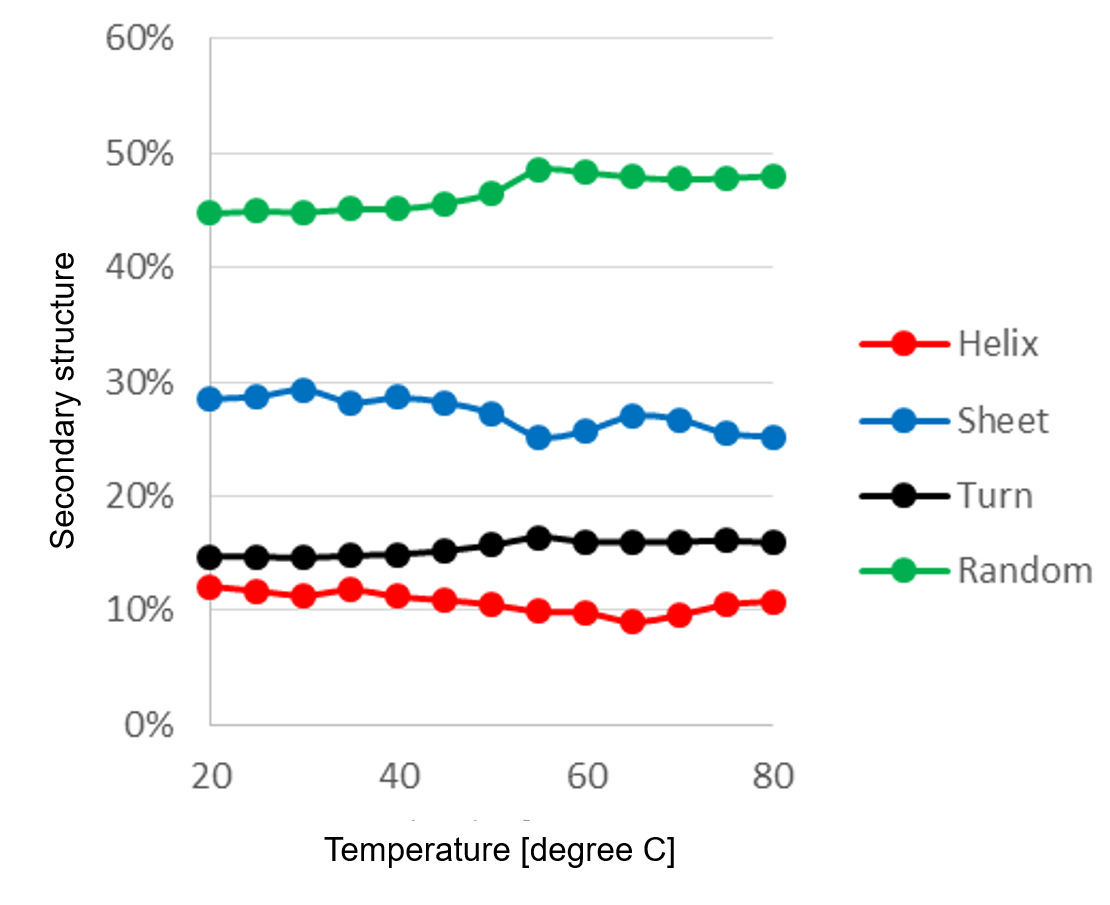
Fig. 2 Temperature control of secondary structure ratio
(PCR method, number of main components: 5)
The temperature control fluorescence spectra which were measured simultaneously with the CD spectra were shown in figure 3. The fluorescence peak observed around 332 nm at 20 ºC shifts to around 355 nm as the temperature rises. It is known that fluorescence peak derived from the tryptophan residue sensitively react with the polarity of the surrounding environment, and when the surrounding environment changes from a hydrophobic environment buried inside the protein to a hydrophilic environment of the protein surface, its fluorescence peak shifts to the long wavelength. From this, it is assumed that the environment around the tryptophan residues in α-chymotrypsin has changed to protein surface which contact with water due to heat denaturation. Figure 4 shows the peak ratio of fluorescence intensity at 332 nm and 355 nm plotted against temperature. The peak ratio of the fluorescence intensity sharply changes from exceeding 45 ºC. This result indicates that the environment around the tryptophan residues (the tertiary structure of the protein) drastically changes from around 45 ºC.
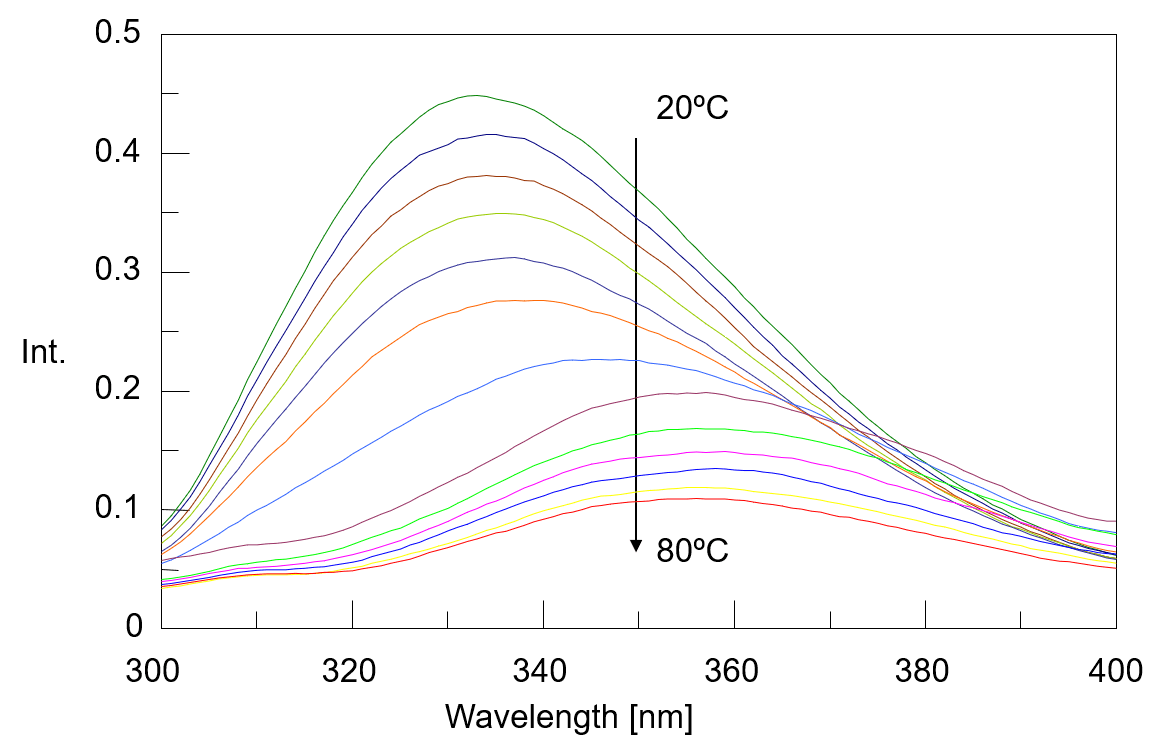
Fig. 3 Temperature control fluorescence spectra of α-chymotripsin

Fig. 4 Temperature control plot of fluorescence intensity ratio (332 nm/355 nm )
References
(1) S. V. Konev, “Fluorescence and Phosphorescence of Proteins and Nucleic Acids”, Plenum Press, New York, p.21 (1967)


