Introduction
Near-IR spectroscopy is widely used for quantitative analysis of components in food product. Its method has the feature that it is possible to perform non-destructive measurement without any special sample preparation. Therefore, not depending on the status of sample (such as liquid, paste, solid or particle), just putting it on the sampling plate or cell in the analytical instrument can perform the measurement easily. In addition, since the multivariate analysis can provide the quantitative information of mult-component from one spectrum simultaneously without splitting the spectrum into several spectra, applying its technique enables to get a lot of information rapidly and easliy.
This article shows the simultaneous quantitative analysis result of each component in commercial food product by a series of near-IR measurement.
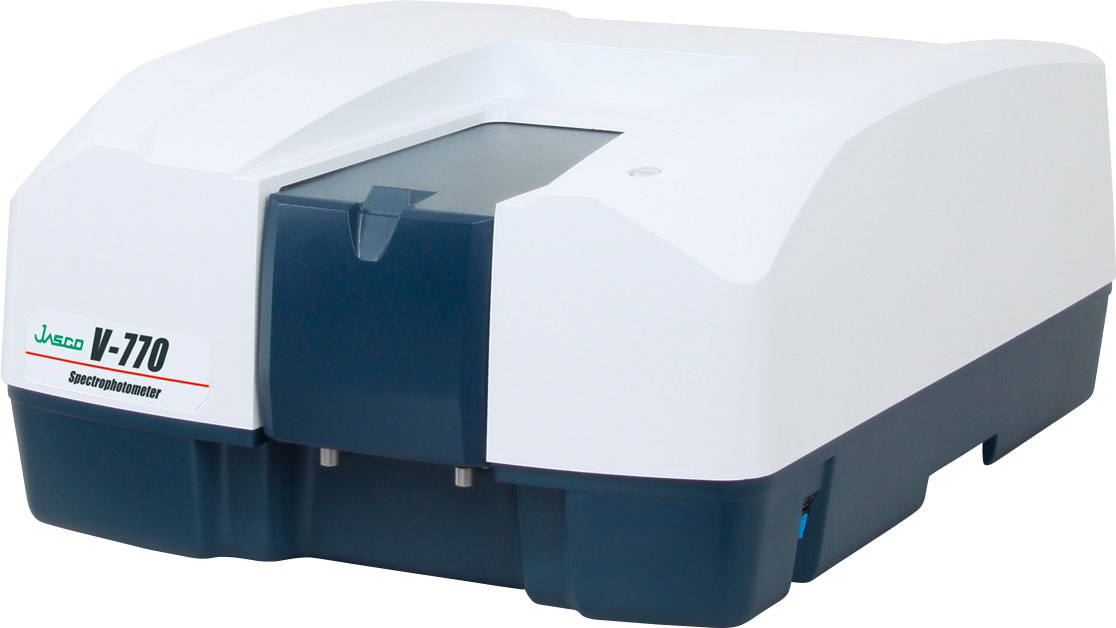
V-770 UV/Vis-NIR spectrophotometer
Experimental
15 kinds of condensed soup, whose concentration of each component is already known, were prepared, and diffuse transmission measurements of them were performed by using UV/Vis-NIR spectrophotometer with integrating sphere unit. Figure 1 shows the spectra of each condensed soup. Although these spectra are similar, there are slight difference among them.
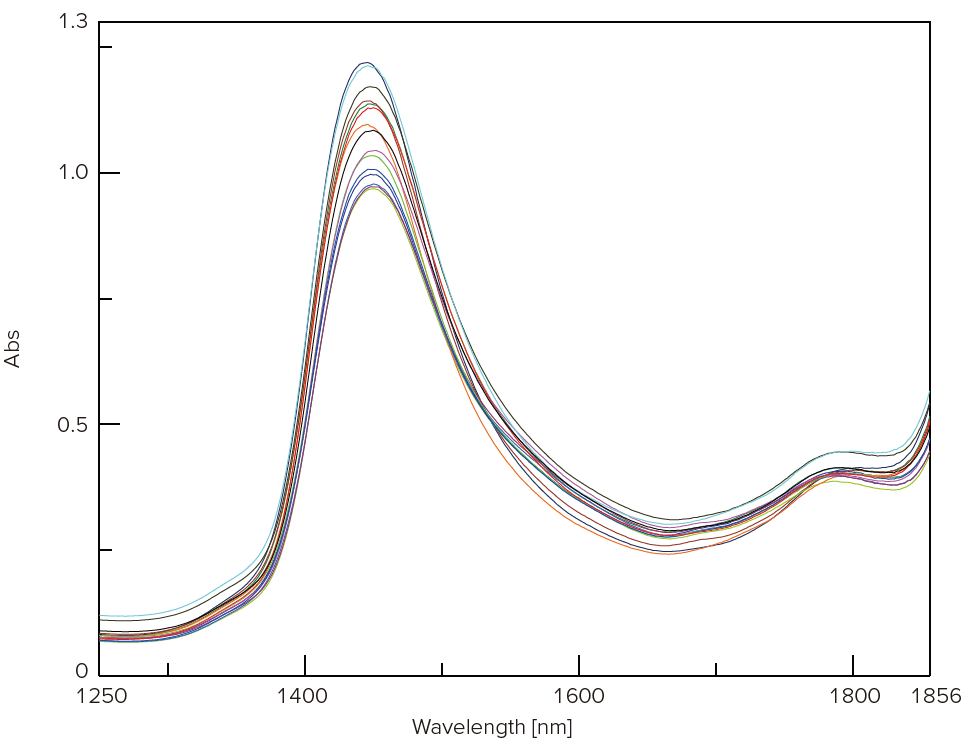
Figure 1. Spectra of each condensed soup
Next, based on the measured data, the calibration model of salt was created by PLS (Figure 2). As a result, the calibration model with high correlation coefficient could be obtained. It means that the salt can be quantified by using the phenomenon that the peak of water is shifted depending on the salt concentration even though the salt does not have the absorption in near-IR region.
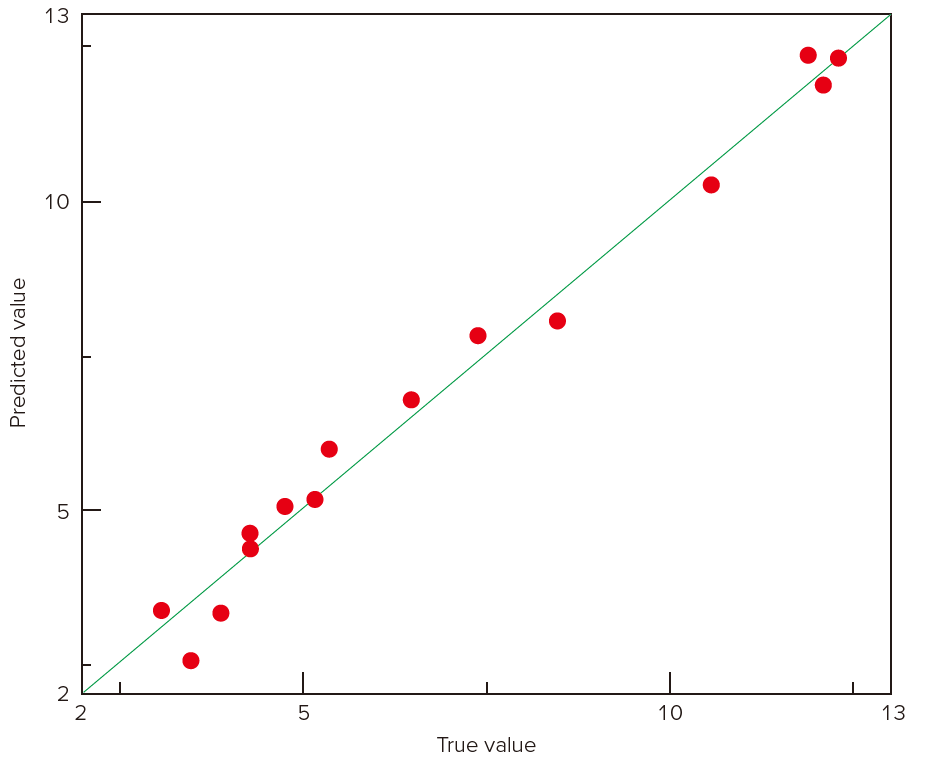
Figure 2. PLS calibration model of salt
Calibration models of other components (water and protein) were also created by using the same method. Table 1 shows the correlation coefficients of each calibration model. It indicates that the calibration models were created with high correlation coefficient, and means that this technique can quantify the multi-components simultaneously.
Table 1. Calibration model of each component and their correlation coefficient
| Component | Number of samples | Range (%) | Correlation coefficient | Error of prediction |
| Water | 15 | 55.7 to 77.4 | 0.961 | 2.04 |
| Protein | 15 | 1.0 to 4.7 | 0.955 | 0.470 |
| Salt | 15 | 3.1 to 12.3 | 0.992 | 0.415 |


