Introduction
Circular dichroism (CD) spectroscopy is a well known method for easily assessing the higher-order structure (HOS) of antibodies at low concentrations. For the development and quality control of antibody drugs, it has been widely used for secondary structure estimation (SSE) and HOS similarity assessment. In recent years, CD spectroscopy has been utilized to perform a wide variety of inspections, to investigate HOS similarities between innovators and biosimilars, as described in guidelines1, 2 such as those published by the FDA3 and EMA4, and to assess the effect of changes in manufacturing processes, as defined in ICH Q5E.5
In order to precisely estimate the secondary structure of proteins, it is necessary to convert the vertical axis of the measured CD spectrum into mean residue ellipticity or delta epsilon using the exact sample concentration. For HOS similarity assessment, it is also necessary to eliminate the influence of sampling errors in order to detect differences in the CD spectrum with high sensitivity. Conventionally, the sample concentration has been obtained by using a UV/Vis spectrophotometer or the absorbance measurement function of a CD spectrometer. While measurements using a UV/Vis spectrophotometer allow high accuracy, the fact that the operator has to use two spectrometers to obtain both CD and absorbance spectra has remained an issue, especially when a large number of samples are measured. Here, we successfully conducted SSE and HOS similarity assessment of antibodies in an efficient and accurate way by a JASCO J-1500 CD spectrometer, which can measure CD and absorption spectra at the same time with high accuracy.
J-1500 CD spectrometer
Information about antibody drugs obtained from CD spectra
CD signals in the far-UV region are derived from peptide bonds in antibody drugs and reflect main-chain conformations such as α-helix and β-sheet configurations. The fraction of the secondary structure of antibodies can be estimated by analyzing the CD spectrum in the far-UV region. The CD signals in the near-UV region are derived from side chains of aromatic amino acids and disulfide bonds, and are affected by the orientation of aromatic amino acids and the surrounding environment. Therefore, the HOS similarity can be assessed by comparing the CD spectra of two different antibody drugs, such as innovators and biosimilars, in the far-UV and near-UV regions.
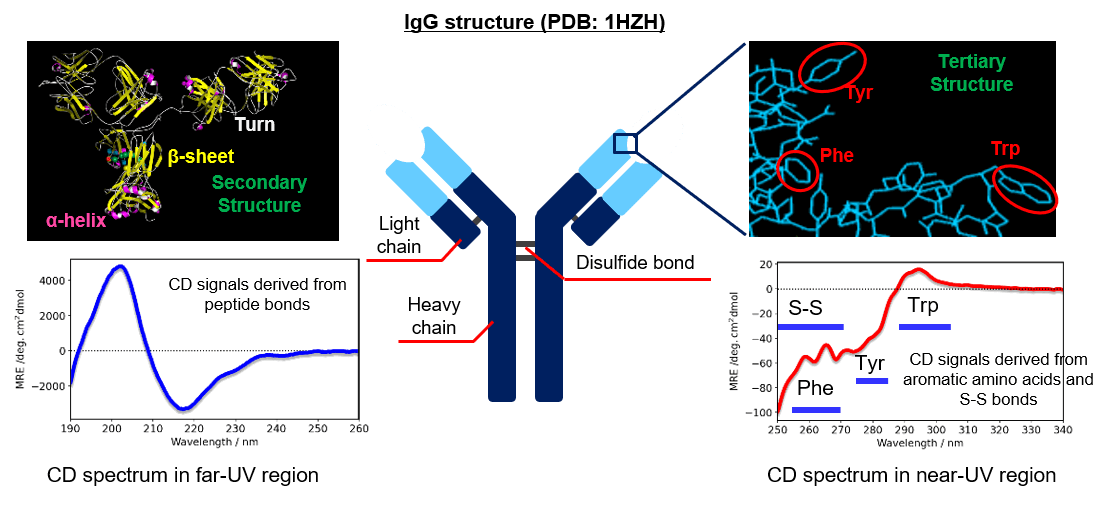
Fig. 1 IgG structure and CD spectra
Experimental
System
– J-1500 CD Spectrometer
In order to measure the absorbance with the same accuracy reported in this application note, it is necessary to calibrate the CD spectrometer in advance.
– V-760 UV-Visible Spectrophotometer
– JWMVS-529 CD Multivariate SSE Analysis Program
– BeStSel
BeStSel (http://bestsel.elte.hu/) is a secondary structure analysis program developed by the research group of Dr. József Kardos at ELTE Eötvös Loránd University.6, 7 The algorithm deconvolves the β-sheet structure into four substructures, taking into account the twist between β-strands. This enables highly accurate secondary structure analysis of β-sheet-rich proteins such as protein aggregates, amyloid fibrils and IgG.
– JWQHOS-531 qHOS program
The [qHOS] program converts the spectral difference into a parameter called the “Euclidean distance”. By weighting the Euclidean distance to account for noise and spectral variation, differences between spectra can be detected with high sensitivity (“weighted Euclidean distance”).8 The [qHOS] program allows statistical significance testing to determine whether the differences between spectra are due to noise or sample preparation errors, or are in fact chemically meaningful differences (Fig. 2). Three types of statistical tests can be selected according to the purpose (Table 1).
Table 1. Procedure for each statistical test
| Assay | Features |
| Student’s t-test | – This method tests for significant differences in spectral distances, taking into account the variance in standard sample spectral distances. – Data for multiple standard samples and a single unknown sample are used. This test is used for quality assessment of manufactured antibody drugs. |
| Welch’s t-test | – This method tests for significant differences in spectral distances, taking into account the variances in both standard and sample spectral distances. – Data for multiple standards and unknown samples are used. – This test is used for comparing the HOS of innovators and biosimilars, the HOS for antibody drugs before and after manufacturing process changes, and for lot inspections. |
| Equivalence test (TOST) | – This method tests for significant differences in spectral distances, taking into account the variances in both standard and sample spectral distances. In this method, it can be set a range (equivalence margin) in which the distance between the spectrum of each standard sample and the average spectrum of standard samples, and the distance between the spectrum of each unknown sample and the average spectrum of unknown samples, are equivalent respectively. – Data for multiple standards and unknown samples are used. – Tests can be performed based on the FDA guidance for similarity assessment.9 |
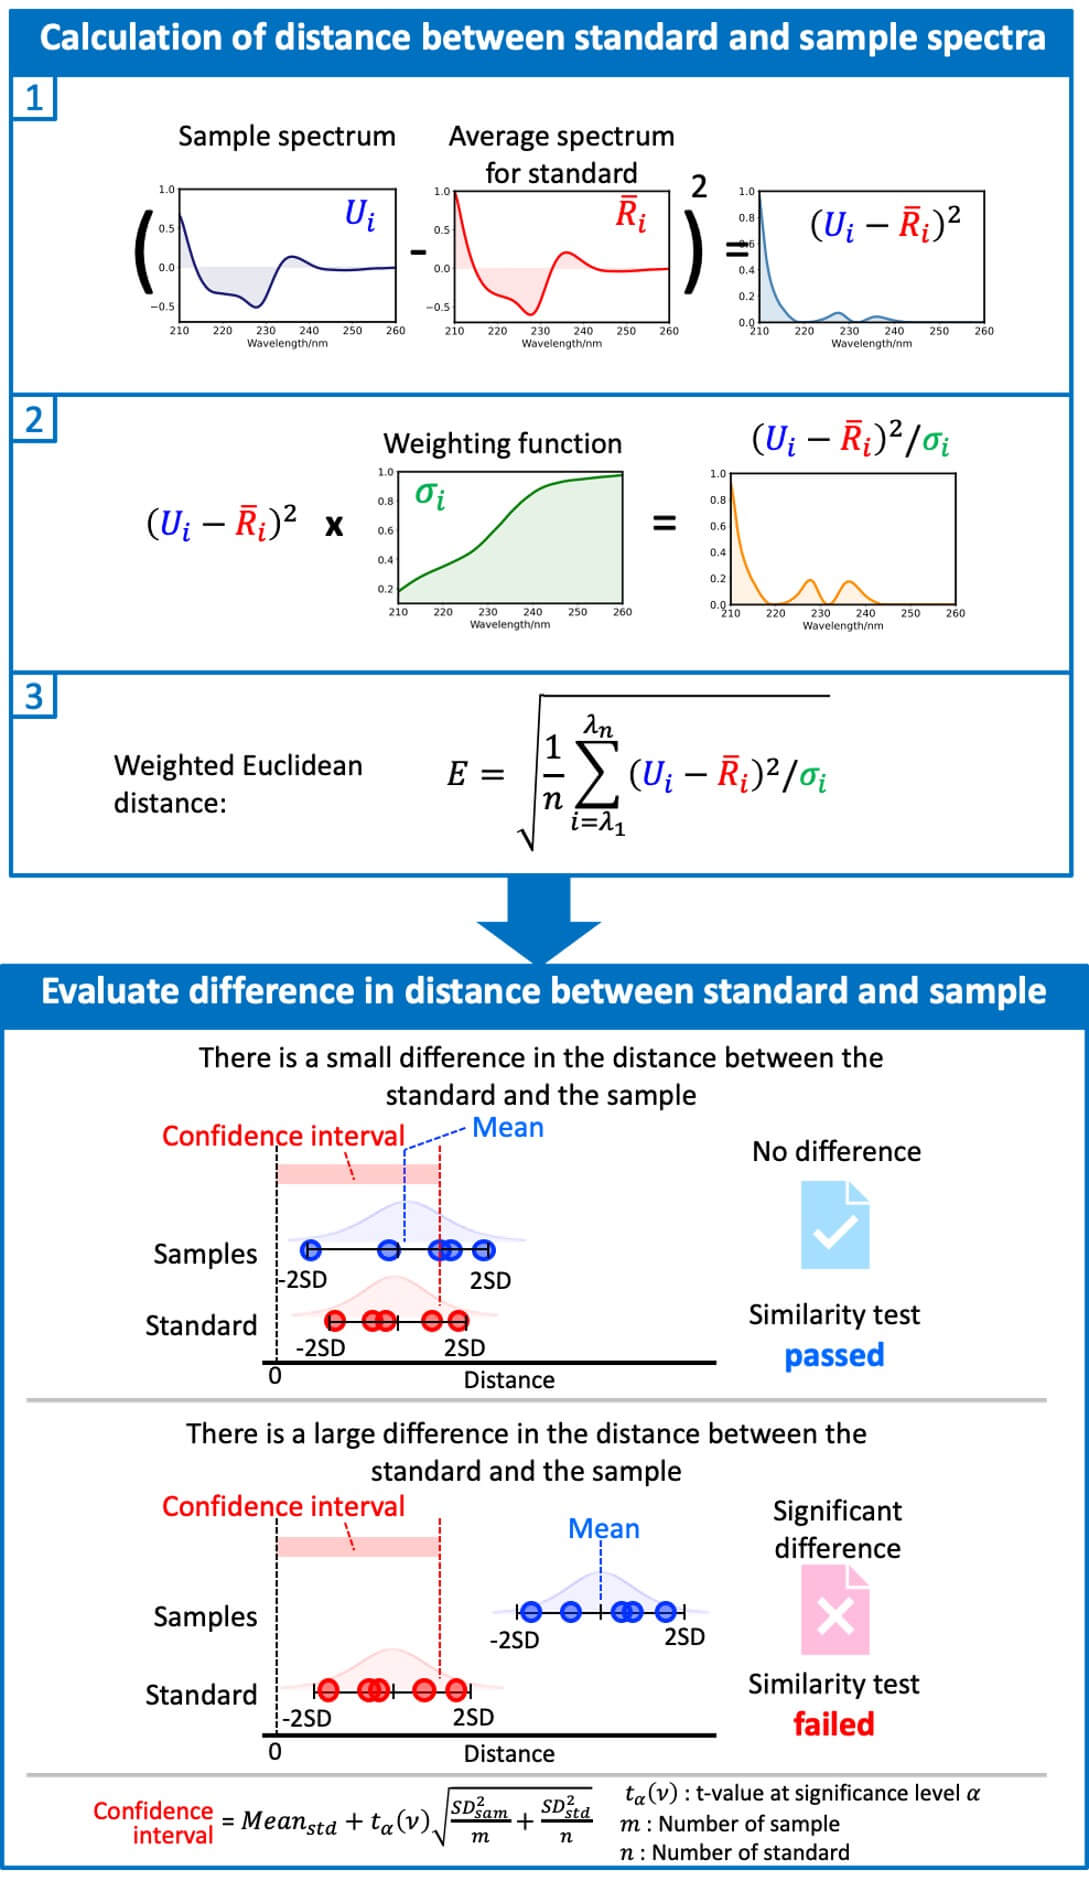
Fig. 2 Procedure for spectral similarity assessment.
Samples
– Herceptin® (Roche)
0.16 mg/mL (far-UV region), 0.8 mg/mL (near-UV region)
– IgG, from human serum (Sigma Aldrich)
Abs measurement of IgG : 0.00, 0.10, 0.21, 0.43, 0.64, 0.88 mg/mL
CD measurement: 0.1 mg/mL (far-UV region), 0.49 mg/mL (near-UV region)
– Solvent : Milli-Q water
Keywords
Antibody drugs, Higher-order structure, HOS, Secondary structure, Tertiary structure, Biosimilar, Herceptin®, Trastuzumab, Circular dichroism
Results
Absorption measurement of IgG by using the J-1500 and V-760
Absorption spectra of IgG solutions were measured by the J-1500 and V-760 spectrometers (Fig. 3). It was found that the difference in the measured absorbance was less than +/-0.005 Abs, which is quite small (Fig. 4).
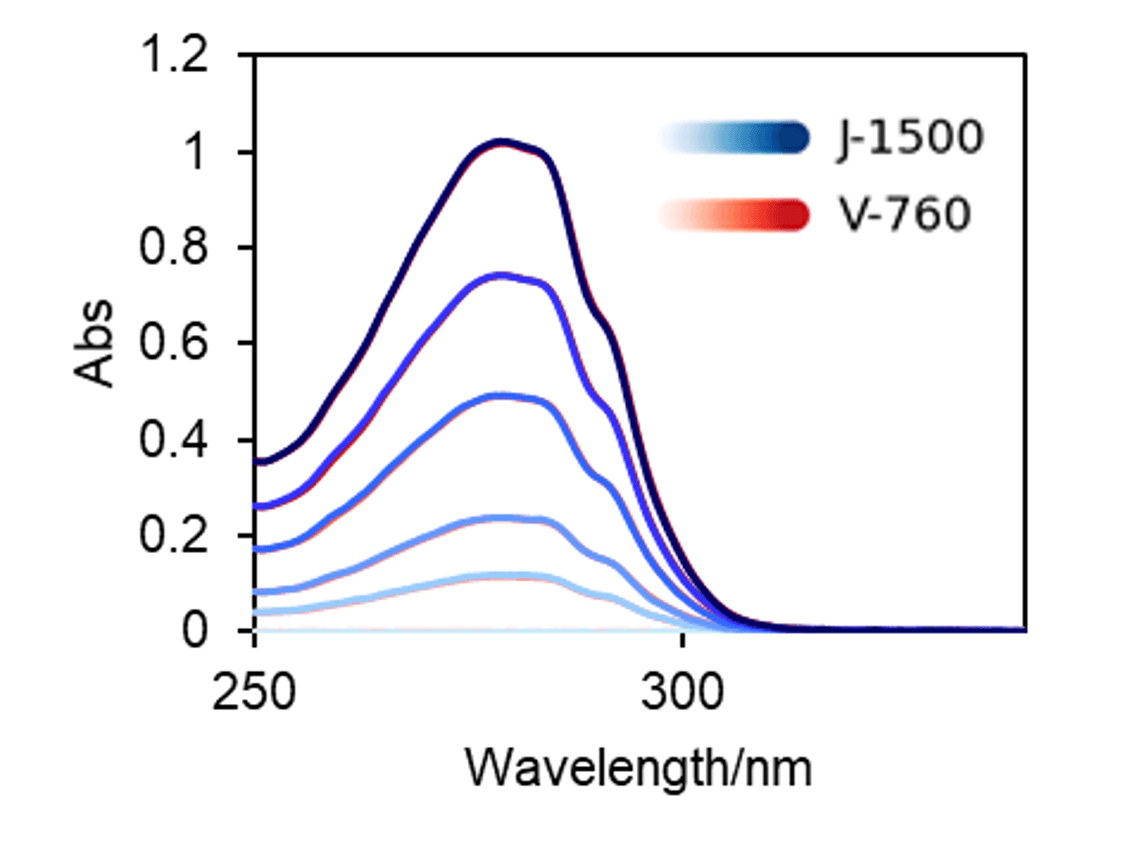
Fig. 3 Absorption spectra of IgG aqueous solution
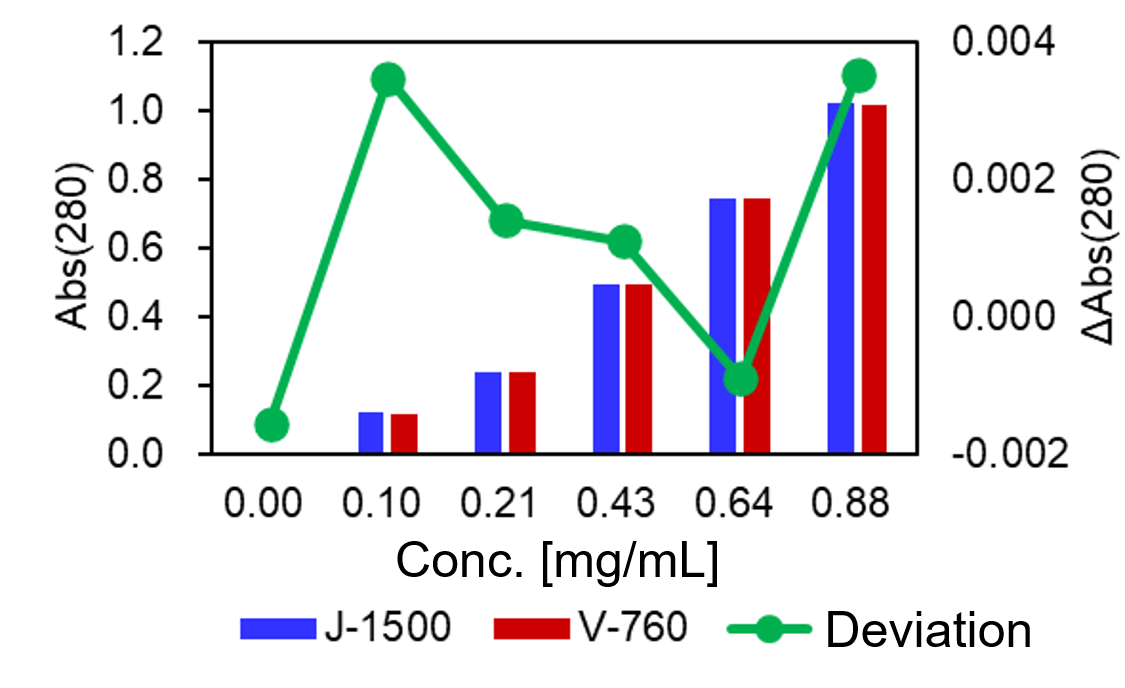
Fig. 4 Absorbance and deviation at 280 nm
CD spectra of IgG and Herceptin®
Five samples of IgG and Herceptin® solutions were prepared, and CD and absorption spectra were measured by using the J-1500 (top panels in Figs. 5 and 6, respectively) and absorption spectra were measured by using the V-760. The CD value was converted to the mean molar ellipticity by using the absorbance obtained by both spectrometers (bottom panels in Figs. 5 and 6, respectively). The coefficient of variation for the CD value is shown in Table 2. These results show that converting the CD value to the mean molar ellipticity eliminates the effect of concentration errors caused by sample preparation and reduces the coefficient of variation for the measured CD value. In addition, no significant difference was found in the coefficient of variation for the mean molar ellipticity obtained using the absorbance values determined by both spectrometers.
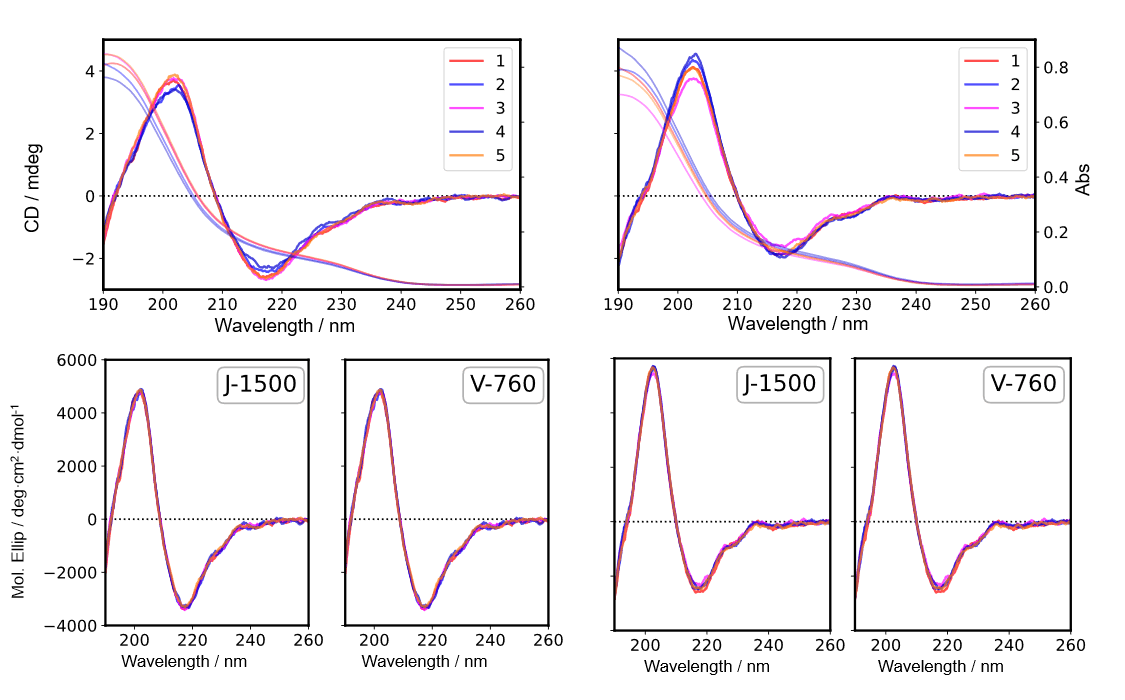
Fig. 5 CD spectra in far-UV region (Left: IgG, Right: Herceptin®)
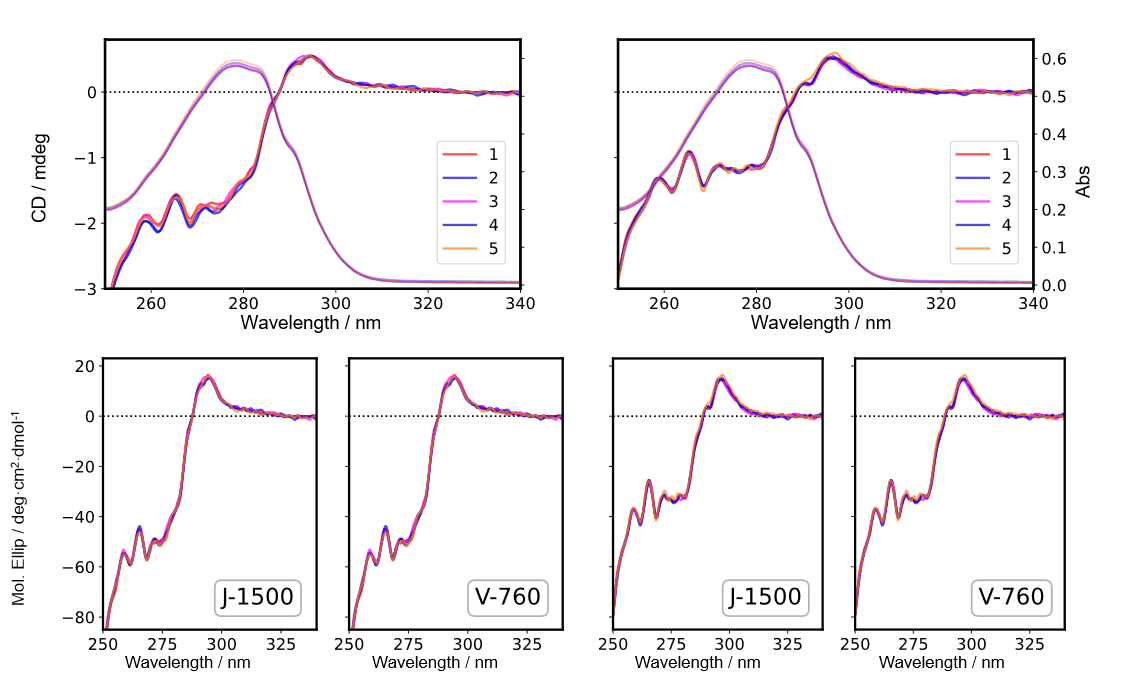
Fig. 6 CD spectra in near-UV region (Left: IgG, Right: Herceptin®)
Table 2. Coefficient of variation for measured CD value
| IgG (217 nm) | IgG (217 nm) | IgG (268 nm) | Herceptin® (268 nm) | |
| mdeg | -6.7 | -7.6 | -2.5 | -2.5 |
| Mol. Ellip (J-1500) | -2.3 | -2.3 | -0.70 | -1.7 |
| Mol. Ellip (V-760) | -1.7 | -3.4 | -0.62 | -1.6 |
Estimation of the fraction of the secondary structure
Secondary structures for IgG and Herceptin® were performed by using the both BeStSel, which can analyze β-sheet-rich proteins such as IgG with high accuracy, and the JASCO CD Multivariate SSE Analysis Program, which is compliant with FDA21 CFR Part 11 (Figs. 7 and 8). Using the same calculation method, the difference in the fraction of the secondary structure fraction calculated using the absorbance was within 0.05 % between the J-1500 and V-760 results. This means that the absorbance difference between spectrometers does not affect the results of secondary structure analysis. In addition, using different calculation methods, the maximum difference in the secondary structure fraction was 4% for the IgG (α-helix), and for other components, showing that almost the same results were obtained. This is thought to be due both to the difference in calculation methods and the difference in secondary structure classification.
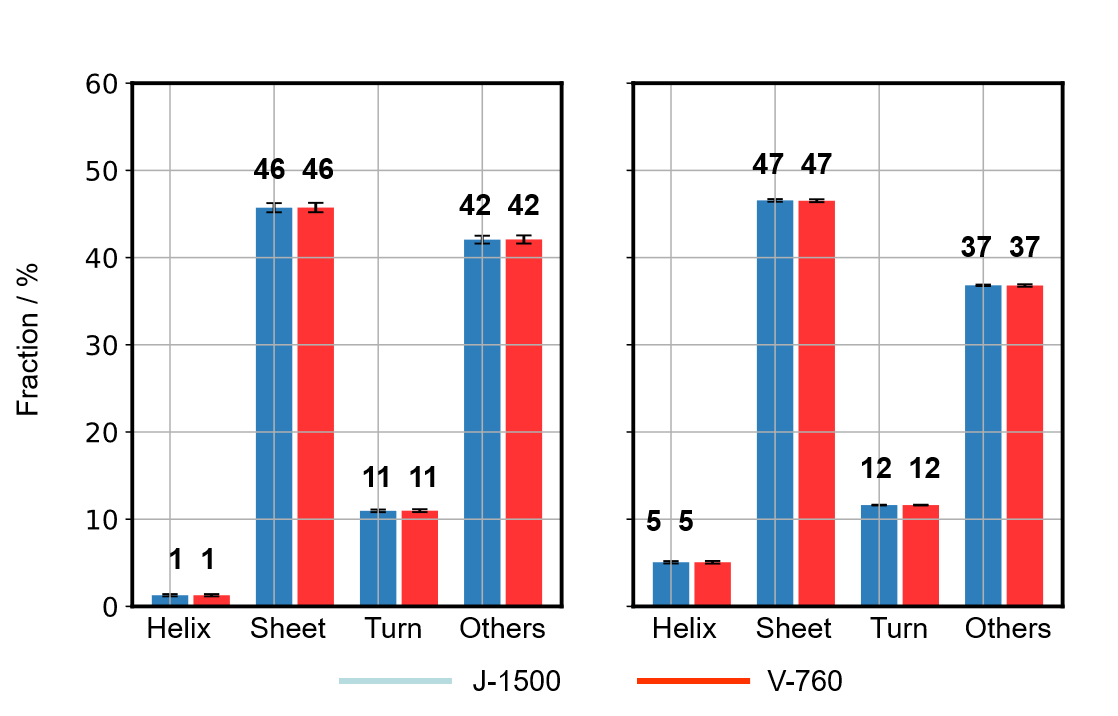
Fig. 7 SSE of IgG (Left: BeStSel, Right: JASCO program)
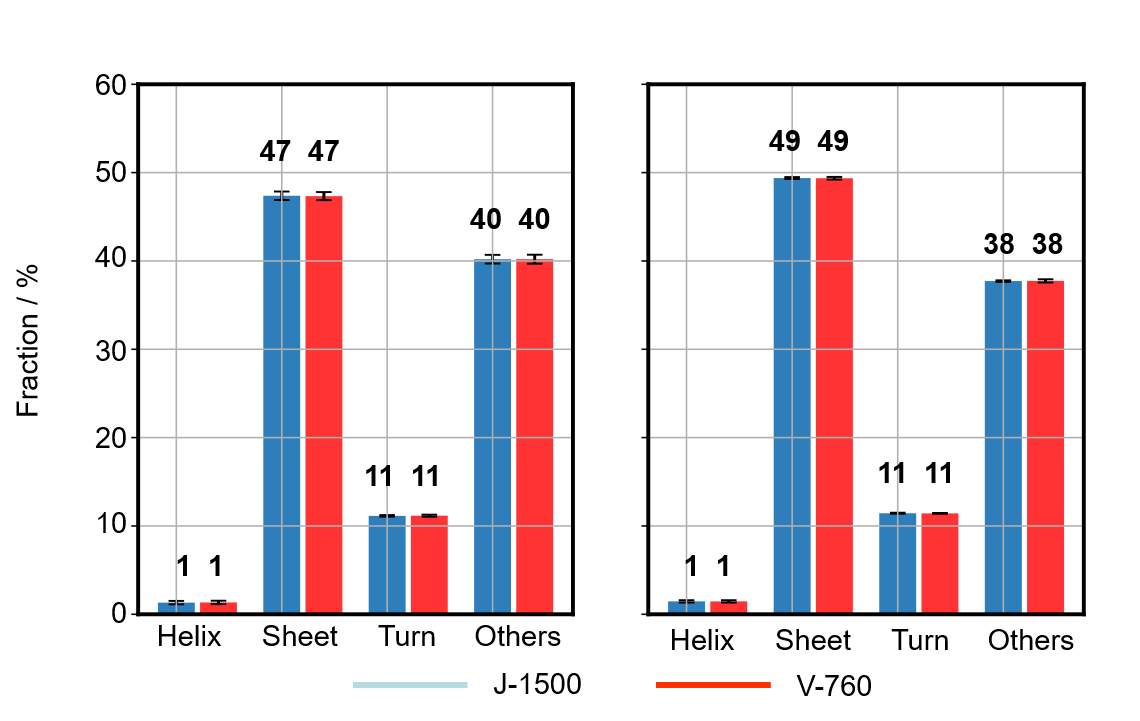
Fig. 8 SSE of Herceptin® (Left: BeStSel, Right: JASCO program)
HOS similarity assessment using qHOS program
The similarity of the secondary and tertiary structures of IgG and Herceptin® before and after the conversion of the mean residue molar ellipticity was evaluated using CD spectra in the far-UV and near-UV regions (Fig. 9). It was found that the effect of concentration errors caused by sample preparation was eliminated by converting the CD value to the mean molar ellipticity. As a result, the variation in spectral distance was reduced, and the difference in HOS could be captured with higher sensitivity. In addition, the spectral distances obtained using the absorbance values determined by the J-1500 and V-760 spectrometers and their variations were similar, showing that the absorbance measurement errors for both instruments did not affect the HOS similarity assessment.
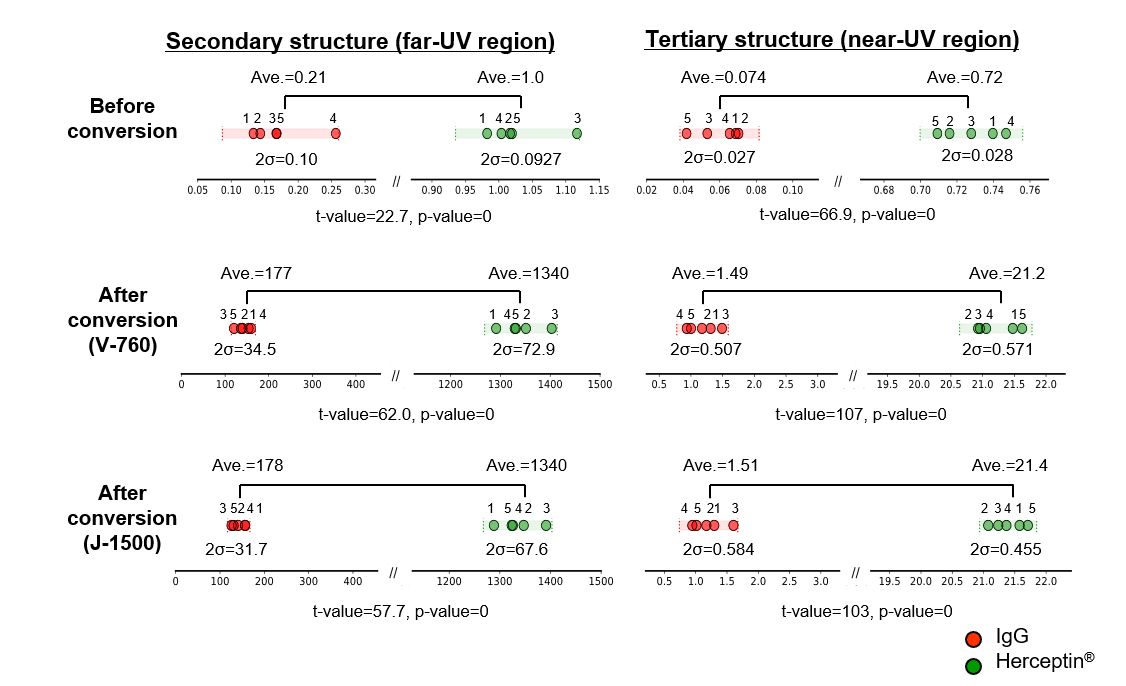
Fig. 9 HOS similarity assessment results for IgG and Herceptin®
Conclusion
Absorbance measurement accuracy of CD spectrometer
The J-1500 CD spectrometer exhibited excellent photometric accuracy for a single-beam instrument.
Effect of absorbance measurement accuracy on HOS assessment results
The difference in absorbance between the J-1500 single-beam and V-760 double-beam spectrometers did not affect the results of secondary structure analysis or HOS similarity assessment. Therefore, it can be concluded that the J-1500 has sufficient absorbance measurement accuracy for these assessments.
Appendix
Measurement conditions
J-1500
Abs measurement of IgG
Bandwidth: 1 nm
Scan speed: 100 nm/min
Response: 1 sec
Data interval: 0.1 nm
No. of accumulations: 1
Optical path length: 10 mm
CD measurement of IgG and Herceptin®
[Far-UV region]
Bandwidth: 1 nm
Scan speed : 50 nm/min
Response: 2 sec
Data interval: 0.1 nm
No. of accumulations: 9
Optical path length : 1 mm
[Near-UV region]
Bandwidth: 1 nm
Scan speed : 20 nm/min
Response: 4 sec
Data interval: 0.1 nm
No. of accumulations: 9
Optical path length : 10 mm
V-760
Bandwidth: 1 nm
Scan speed : 100 nm/min
Response: 0.96 sec
Data interval: 0.1 nm
No. of accumulations: 1
References
1) Department Biotechnol Govt. India. Guideline on similar biologics: Regulatory requirements for marketing authorization in India. 2012
2) Center for drug evaluation of China National Medical Product Administration. Technical guideline for development and evaluation of biosimilars. 2015
3) US Food and Drug Administration. Development of Therapeutic Protein Biosimilars: Comparative Analytical Assessment and Other Quality-Related Considerations. 2019
4) European Medicines Agency. Guideline on similar biological medicinal products containing biotechnology-derived proteins as active substance: quality issues (revision 1). 2014
5) International Conference on Harmonisation (ICH) of Technical Requirements for registration of Pharmaceuticals for Human Use. ICH AUTHORIZED MANUFACTURING CHANGES FOR THERAPEUTIC MABS 833 Harmonised Tripartite Guideline Comparability of Biotechnological/ Biological Products Subject to Changes in their Manufacturing Process Q5E. 2004
6) A. Micsonai, F. Wien, L. Kernya, Y.H. Lee, Y. Goto, M. Refregiers, J. Kardos, Accurate secondary structure prediction and fold recognition for circular dichroism spectroscopy, PNAS 112 (2015) 3095-3103.
7) A. Micsonai, F. Wien, E. Bulyaki, J. Kun, E. Moussong, Y.H. Lee, Y. Goto, M. Refregiers, J. Kardos, BeStSel: a web server for accurate protein secondary structure prediction and fold recognition from the circular dichroism spectra, Nucleic Acids Res. 46 (2018) 315-322.
8) T. Oyama, S. Suzuki, Y. Horiguchi, A. Yamane, K. Akao, K. Nagamori and K. Tsumoto, Performance Comparison of Spectral Distance Calculation Methods, Appl, Spectrosc. (2022)
9) Y. Tsong, X. Dong, M. Shen, Development of statistical methods for analytical similarity assessment, J. Biopharm. Stat. (2017)


