Introduction
Since the first monoclonal antibody was approved by the U.S. Food and Drug Administration (FDA) in 1986, the market for therapeutic proteins has expanded rapidly, and antibody drugs have become predominant treatment modality for various diseases over the past 25 years 1. The development of biopharmaceuticals such as antibody drugs requires the evaluation of physicochemical, chemical, biological, or microbiological properties that should be within the appropriate range to ensure their efficacy and safety. These properties are called critical quality attributes (CQAs) and are analyzed by various analytical methods 2-4.
In addition, antibody drugs may form dimer, trimer, and aggregates due to mechanical stress in each manufacturing process and environmental factors during transportation and storage 5, 6. Aggregates need to be evaluated as one of CQAs because they may cause a decrease in drug efficacy and side effects. In 2014, the FDA provided guidance on the evaluation of the immunogenicity of therapeutic protein products (the ability of a drug to act as an antigen, produce anti-drug antibodies in the body and provoke an immune response). For protein aggregates contained in biopharmaceuticals, it is recommended to assess the validity of each analysis result by comparing the results using multiple methods with different measurement principles (Orthogonal Assessment) 7.
Moreover, evaluation of physicochemical properties is considered to be important to show that the subsequent products (biosimilars) have similar quality, safety, and efficacy to preceding biopharmaceuticals (innovators). Among the physicochemical properties, higher order structure (HOS) is an essential element of characterization, which should include similarity assessment of primary to tertiary structure and quaternary structure including aggregates using appropriate analytical techniques, and again the Orthogonal Assessment for one property is recommended 8, 9.
Aggregates are classified into <100 nm, 100 nm-1 µm, 1 µm-100 µm, and 100 µm< according to their size, and analytical methods are employed according to each size 10, 11. Size exclusion chromatography (SEC) is often used as one of the qualitative and quantitative evaluation methods for aggregates of 50 nm or less 12, 13.
In this application note, we will introduce that some antibody drugs with IgG-derived sequences in addition to IgG from human serum were measured by using SEC to separate and detect monomer, multimers, and aggregates. The measured antibody drugs were innovator rituximab (MabThera®) and biosimilar (RIABNI™) for the treatment of non-Hodgkin lymphoma, and innovator trastuzumab (Herceptin®) for the treatment of breast cancer.
Experimental
Conditions
Column: TSKgel G3000SWXL (7.8 mmI.D. x 300 mmL, 5 µm)
Eluent: 0.2 mol/L sodium phosphate buffer (pH 6.7)
Flow rate: 0.8 mL/min
Column temp.: 25 ºC
Wavelength: 220 nm
Inj. volume: 10 µL
Sample
Standard sample: Protein standard mix 15-600 kDa (Merck) 30 mg/mL in water
Unknown sample: IgG from human serum (Merck)
MabThera® 100 mg/10 mL (Roche)
RIABNI™ 100 mg/10 mL (AMGEN)
Herceptin® 150 mg powder for concentrate for solution for infusion (Roche)
(Pretreatment methods are described later.)
Keywords
biopharmaceutical, antibody drug, CQA, HOS, aggregate, MabThera®, RIABNI™, Herceptin®, TSKgel G3000SWXL, SEC, UV detector
Results
Figure 1 shows UV chromatograms of a blank (ultrapure water) and a protein standard sample. The column used in this experiment has exclusion limit with globular proteins of 800 kDa and measurement range of approximately 10 to 500 kDa. As shown in Figure 2, a molecular weight calibration curve was created from the retention times and molecular weights of the four components except for p-aminobenzoic acid that eluted after the permeation limit (around 13.8 min). Based on this calibration curve, the molecular weight of each sample was calculated.
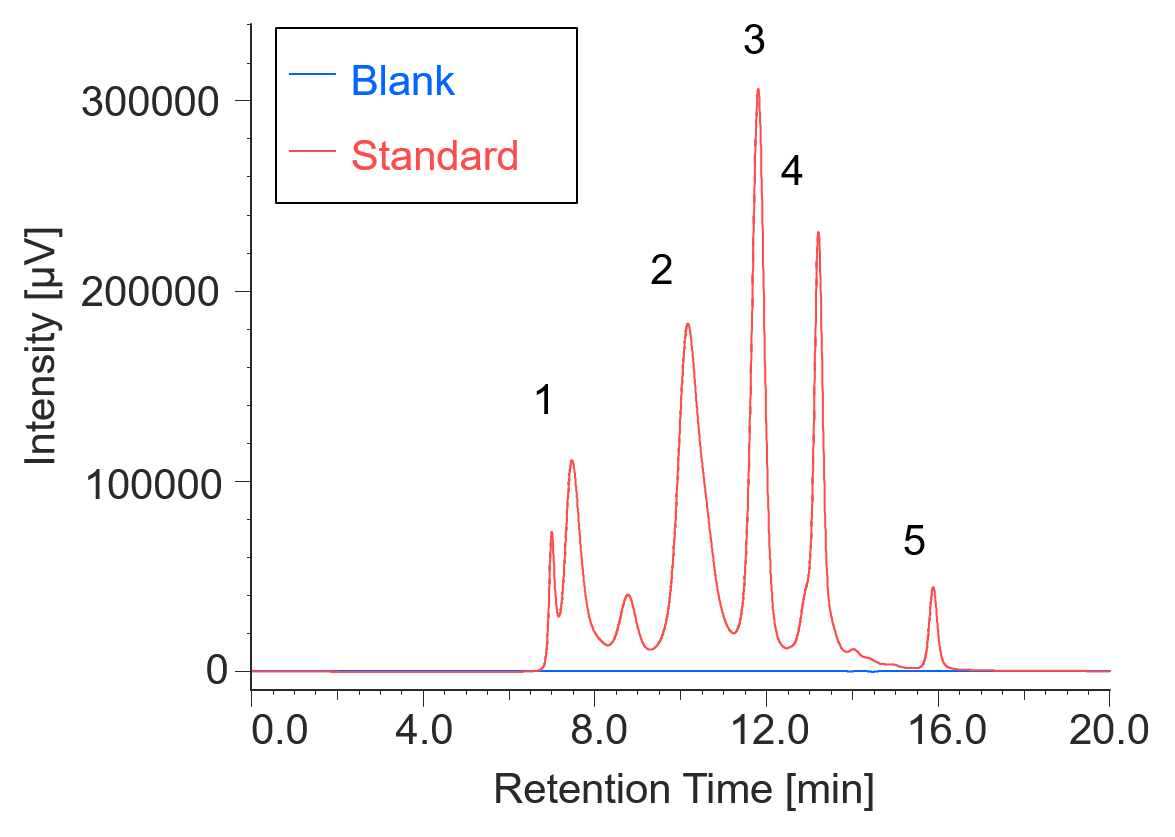
Fig. 1 UV chromatograms of a blank and a protein standard
1: Thyrogrobulin (670 kDa), 2: γ-globulins (150 kDa), 3: Ovalbumin (44.3 kDa), 4: Ribonuclease A (13.7 kDa), 5: p-amino-benzoic acid (0.137 kDa)
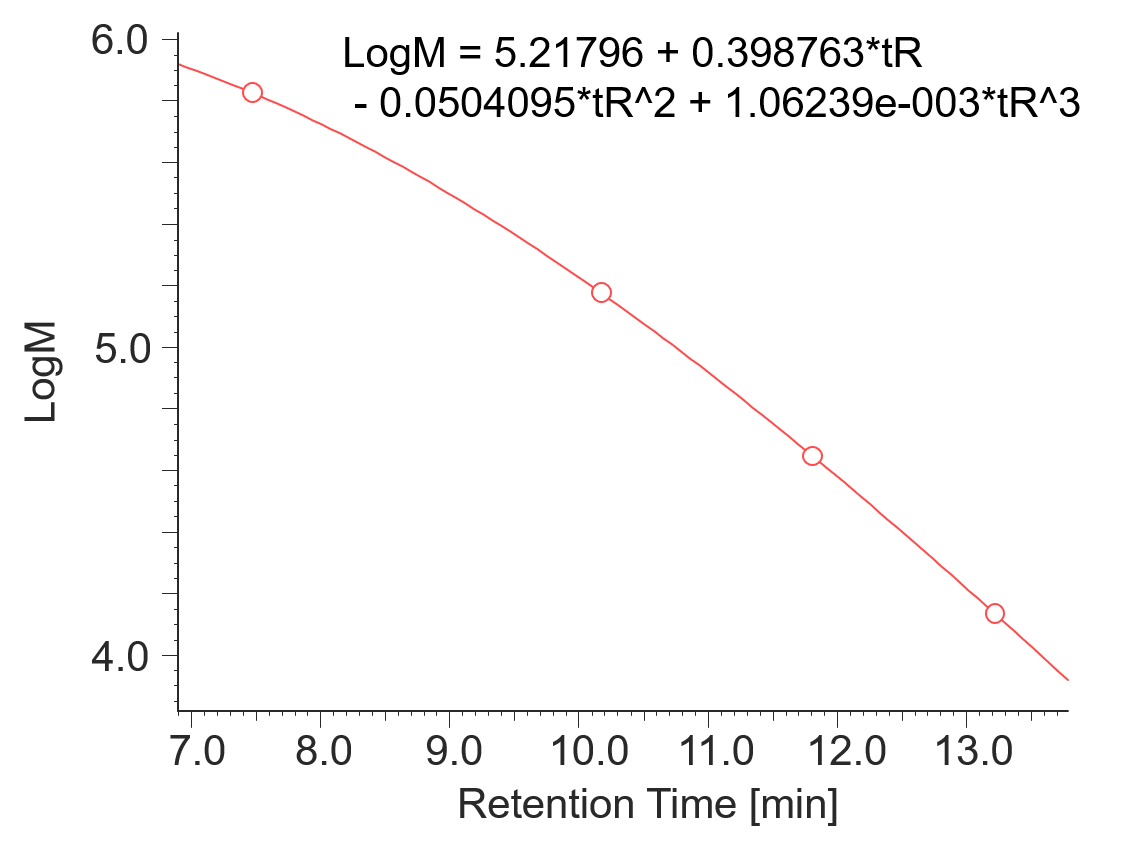
Fig. 2 Molecular weight calibration curve
Figure 3 shows a UV chromatogram of IgG derived from human serum. Table 1 shows the calculation results of the peak top molecular weight (Mp) of IgG derived from human serum and the area ratio of respective sections.
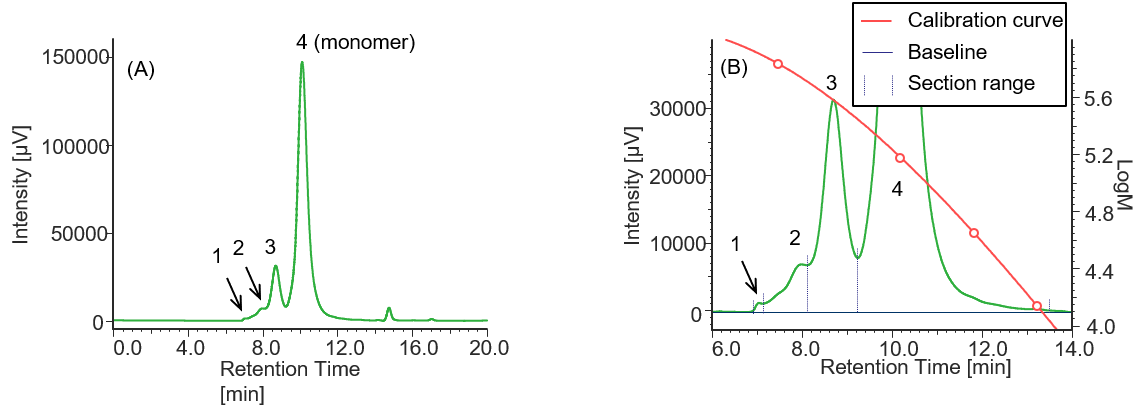
Fig. 3 UV chromatogram of IgG derived from human serum
(A) : Full scale, (B) : Enlarged view near the baseline at 6-14 min (shown with molecular weight calibration curve)
Pretreatment: 1 mg of IgG derived human serum was dissolved in 1 mL of ultrapure water.
Table 1 Calculation results of peak top molecular weights and area ratios of IgG derived from human serum converted based on the results of standard sample
| Peak No. | Section range [min.] | Baseline range [min.] | tR [min.] | Mp | Section area | Area % |
| 1 | 6.873-7.120 | 6.000-18.000 | 7.043 | 788938 | 11988 | 0.16 |
| 2 | 7.120-8.107 | 6.000-18.000 | 7.987 | 535189 | 234438 | 3.04 |
| 3 | 8.107-9.243 | 6.000-18.000 | 8.703 | 371957 | 1160566 | 15.04 |
| 4 | 9.243-13.573 | 6.000-18.000 | 10.117 | 155903 | 6308812 | 81.76 |
Similarly, Figures 4 to 6 and Tables 2 to 4 show the UV chromatograms and calculation results of molecular weight for MabThera®, RIABNI™, and Herceptin®, respectively. The peaks that elute after the permeation limit in Figures 4 to 6 are considered to be the peaks derived from the additives contained in each antibody drug.
Comparison of the Mp of the monomer peaks (peak 3) in Tables 1 to 4 revealed that the molecular weight of each antibody drug was about 10 kDa smaller than that of IgG. The molecular weights of MabThera®, RIABNI™, and Herceptin® were calculated to be 145 kDa (published value: 145 kDa), 146 kDa (published value: 145 kDa), and 149 kDa (published value: 148 kDa), respectively. All the molecular weights were close to the published values 14-16.
In addition, judging from their molecular weights (27 to 28 kDa), peaks 4 eluted at 12 to 13 min in each sample except for IgG were thought to correspond to one light chain constituting each antibody drug eluted as a fragment peak.
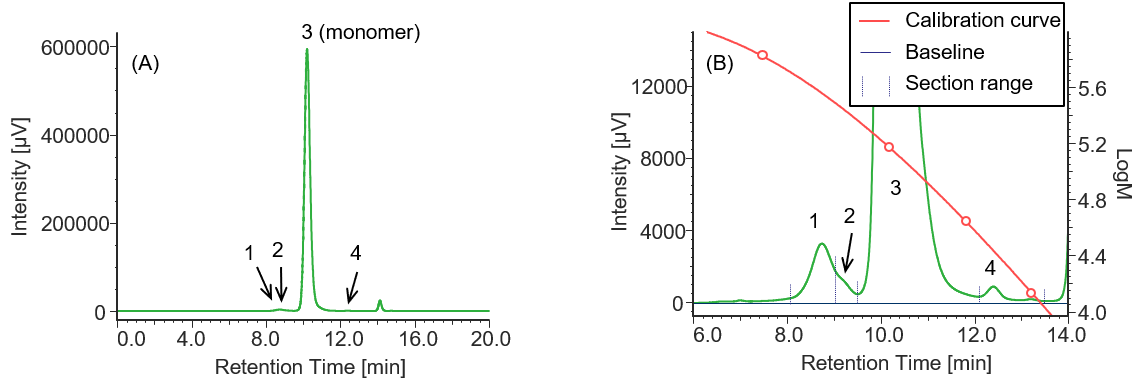
Fig. 4 UV chromatogram of MabThera®
(A) : Full scale, (B) : Enlarged view near the baseline at 6-14 min (shown with molecular weight calibration curve)
Pretreatment: 100 mg/10 mL of MabThera® was diluted with ultrapure water to 1 mg/mL.
Table 2 Calculation results of peak top molecular weights and area ratios of MabThera ® converted based on the results of standard sample
| Peak No. | Section range [min.] | Baseline range [min.] | tR [min.] | Mp | Section area | Area % |
| 1 | 8.100-9.043 | 6.000-18.000 | 8.743 | 363886 | 105056 | 0.78 |
| 2 | 9.043-9.510 | 6.000-18.000 | 9.257 | 270669 | 28743 | 0.21 |
| 3 | 9.510-12.117 | 6.000-18.000 | 10.220 | 145271 | 13226663 | 98.80 |
| 4 | 12.117-13.570 | 6.000-18.000 | 12.407 | 27215 | 27055 | 0.20 |

Fig. 5 UV chromatogram of RIABNI™
(A) : Full scale, (B) : Enlarged view near the baseline at 6-14 min (shown with molecular weight calibration curve)
Pretreatment: 100 mg/10 mL of RIBNI™ was diluted with ultrapure water to 1 mg/mL.
Table 3 Calculation results of peak top molecular weights and area ratios of RIBANI™ converted based on the results of standard sample
| Peak No. | Section range [min.] | Baseline range [min.] | tR [min.] | Mp | Section area | Area % |
| 1 | 8.027-9.043 | 6.000-18.000 | 8.737 | 365223 | 125379 | 0.73 |
| 2 | 9.043-9.507 | 6.000-18.000 | 9.183 | 282810 | 36310 | 0.21 |
| 3 | 9.507-12.093 | 6.000-18.000 | 10.217 | 145605 | 17083631 | 98.86 |
| 4 | 12.093-13.630 | 6.000-18.000 | 12.403 | 27291 | 34582 | 0.20 |
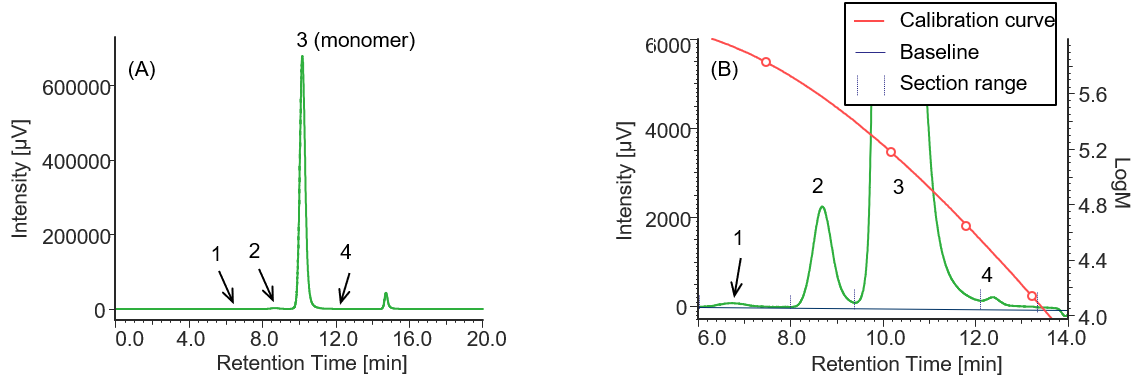
Fig. 6 UV chromatogram of Herceptin®
(A) : Full scale, (B) : Enlarged view near the baseline at 6-14 min (shown with molecular weight calibration curve)
Pretreatment: 1 mg of Herceptin® was dissolved in 1 mL of ultrapure water.
Table 4 Calculation results of peak top molecular weights and area ratios of Herceptin® converted based on the results of standard sample
| Peak No. | Section range [min.] | Baseline range [min.] | tR [min.] | Mp | Section area | Area % |
| 1 | 6.057-8.050 | 6.000-18.000 | 6.737 | 873721 | 3800 | 0.03 |
| 2 | 8.050-9.387 | 6.000-18.000 | 8.690 | 374673 | 70616 | 0.48 |
| 3 | 9.378-12.107 | 6.000-18.000 | 10.183 | 148974 | 14738697 | 99.45 |
| 4 | 12.107-13.373 | 6.000-18.000 | 12.37 | 28058 | 7586 | 0.05 |
Table 5 shows the results of comparing the area ratios of monomer, high molecular weight species (HMWS) containing aggregates that elute earlier than the monomer, and low molecular weight species (LMWS) that elute later than the monomer in each sample. These results show that the innovator and biosimilar of rituximab (MabThera® and RIABNI™) exhibit very similar area ratios. Comparison with the data reported by Goyon et al. revealed that HMWS of MabThera® was 0.99% (literature value: 0.7%) and LMWS was 0.20% (literature value: 0.3%), both of which were close to their literature values. On the other hand, in the case of innovator trastuzumab (Herceptin®), the comparison value of LMWS is not available, but the HMWS was 0.51% (literature value: 0.4%), which is also very close to the literature value 17.
Table 5 Comparison of area ratios of HMWS, monomer, and LMWS for each sample
| MW classification | ||||
| HMWS | Monomer | LMWS | ||
| Sample | MabThera | 0.99 % | 98.80 % | 0.20 % |
| RIABNI | 0.94 % | 98.86 % | 0.20 % | |
| Herceptin | 0.51 % | 99.45 % | 0.05 % | |
Conclusion
Through this experiment, it was confirmed that the measurement method using SEC can successfully separate and detect monomer and aggregates containing multimers in antibody drugs. In addition, it was also confirmed that this method is a powerful tool for evaluating the similarity of HOS, which is an important item of CQAs.
References
1.R. M. Lu, Y. C. Hwang, I. J. Liu, C. C. Lee, H. Z. Tsai, H. J. Li, H. C. Wu, J. Biomed. Sci., 27 (1), 2 (2020). DOI: 10.1186/s12929-019-0592-z
2.European Medicines Agency: “ICH Topic Q6B Specifications: test procedures and acceptance criteria for biotechnological/biological products” <https://www.ema.europa.eu/en/documents/scientific-guideline/ich-q-6-b-test-procedures-acceptance-criteria-biotechnological/biological-products-step-5_en.pdf>, (accessed 2022. 5. 25).
3.European Medicines Agency: “ICH guideline Q8 (R2) on pharmaceutical development” <https://www.ema.europa.eu/en/documents/scientific-guideline/international-conference-harmonisation-technical-requirements-registration-pharmaceuticals-human-use_en-11.pdf>, (accessed 2022. 5. 25).
4.European Medicines Agency: “ICH guideline Q11 on development and manufacture of drug substances (chemical entities and biotechnological/biological entities)” <https://www.ema.europa.eu/en/documents/scientific-guideline/ich-guideline-q11-development-manufacture-drug-substances-chemical-entities-biotechnological/biological-entities_en.pdf>, (accessed 2022. 5. 25).
5.L. Zang, Am. Pharm. Rev., 21 (2), (2018). <https://www.americanpharmaceuticalreview.com/Featured-Articles/348833-Factors-Influencing-Biotherapeutic-Monoclonal-Antibody-Aggregation/>, (accessed 2022. 5. 25).
6.H. C. Mahler, W. Friess, U. Grauschope, S. Kiese, J. Pharm. Sci., 98 (9), 2909 (2009). DOI: 10.1002/jps.21566
7.U.S. Food and Drug Administration. Guidance for Industry: “Immunogenicity Assessment for Therapeutic Protein Products” <https://www.fda.gov/media/85017/download>, (accessed 2022. 5. 25).
8.European Medicines Agency: “Guideline on similar biological medicinal products containing biotechnology-derived proteins as active substance: quality issues (revision 1) “ <https://www.ema.europa.eu/en/documents/scientific-guideline/guideline-similar-biological-medicinal-products-containing-biotechnology-derived-proteins-active_en-0.pdf>, (accessed 2022. 5. 25).
9.U.S. Food and Drug Administration: “Guidance for Industry: Scientific Considerations in Demonstrating Biosimilarity to a Reference Product” <https://www.fda.gov/media/82647/download>, (accessed 2022. 5. 25).
10.L. O. Narhi, J. Schmit, K. B. Peters, D. Sharma, J. Pharm. Sci., 101 (2), 493 (2012). DOI: 10.1002/jps.22790
11.S. Uchiyama, Am. Pharm. Rev., 22 (4), 18 (2018). <https://www.americanpharmaceuticalreview.com/Featured-Articles/362044-Aggregates-Quantification-of-Biopharmaceuticals-in-a-Wide-Range-of-Sizes-Using-Orthogonal-Methods/>, (accessed 2022. 5. 25).
12.S. Fekete, A. Beck, J. L. Veuthey, D. Guillarme, J. Pharm. Biomed. Anal., 101, 161-173 (2014). DOI: 10.1016/j.jpba.2014.04.011
13.B. Bobaly, S. F. Souverain, A. Beck, J. L. Veuthey, D. Guillarme, S. Fekete, J. Pharm. Biomed. Anal., 147, 493-505 (2018). DOI: 10.1016/j.jpba.2017.06.022
14.European Medicines Agency: “Assessment report MabThera” <https://www.ema.europa.eu/en/documents/variation-report/mabthera-h-c-165-ii-149-epar-assessment-report-variation_en.pdf>, (accessed 2022. 5. 25).
15.AMGEN. RIABNI™ (rituximab-arrx) Safety Data Sheet. <https://www.msds.amgen.com/-/media/Themes/Amgen/msds-amgen-com/msds-amgen-com/documents/riabni-sds-20201218.pdf>, (accessed 2022. 5. 25).
16.Australian Government Department of Health: “AUSTRALIAN PRODUCT INFORMATION Herceptin (trastuzumab) powder for injection” <https://www.ebs.tga.gov.au/ebs/picmi/picmirepository.nsf/pdf?OpenAgent&id=CP-2011-PI-02054-3>, (accessed 2022. 5. 25).
17.A. Goyon, V. D’atri, O. Coals, S. Fekete, A. Beck, D. Guillarme, J. Chromatogr. B, 35-43 (2017). DOI: 10.1016/j.jchromb.2017.09.027


