Introduction
The market for therapeutic antibodies has been dramatically expanding over the past decade. Antibody drugs exhibit therapeutic effects such as inhibiting the growth of malignant tumor cells and the activity of immune cells by binding antigens expressed in target cells with high affinity and specificity.
Such antibody drugs are expected to be effective therapeutic agents for as yet unmet medical needs. Many antibody drugs are being used worldwide, and along with leading antibody drugs called innovators, many biosimilars, which have the same amino acid sequence as the innovators but are produced using different expression cells, are also beginning to be used.
Biosimilars tend to be thought of as having the same function and structure as the innovators because they have the same amino acid sequence. However, antibodies are subjected to various stimuli and post-translational modifications during the production process, which may result in a significant loss of function. The main factors are thermal stimulation and fragmentation by proteases. Therefore, measuring changes in antibody structure due to stimulation or modification is an essential step in the research and development process, and for quality control of antibody drugs.
The ICH Q5E1) guideline for quality control of biological products states that the comparability of the higher order structure (HOS) of antibodies before and after a change in the manufacturing process should be objectively evaluated. Global guidance2, 3) from the FDA4) and EMA5) also states that HOS comparisons should be performed and secondary structure composition ratios for innovators and biosimilars should be evaluated. Circular dichroism (CD) spectroscopy is widely used to evaluate antibody quality, as it is a simple way to obtain information on the HOS of antibodies. To implement the above guidelines, there is a need for a method that can objectively and sensitively evaluate the similarity of CD spectra. The JASCO [qHOS] program, which was developed to meet these requirements, is capable of detecting significant differences in spectra with high sensitivity, and performing statistical tests.
Here we report the results of an HOS similarity assessment of RIABNI™ (a biosimilar to MabThera®/Rituxan®, the innovator of Rituximab), and Herceptin® (the innovator of Trastuzumab), using the JASCO HTCD Plus high-throughput CD spectrometer (Fig. 1) and the [qHOS] program.
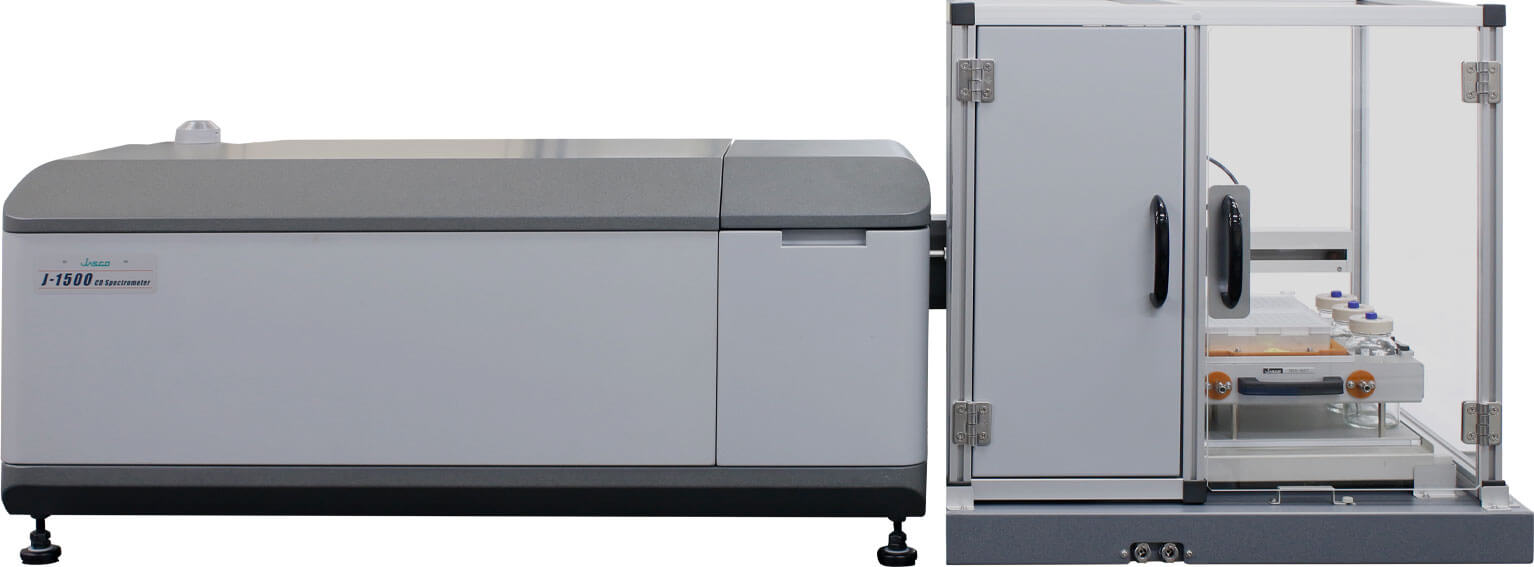
Fig. 1 HTCD Plus high-throughput CD spectrometer
Experimental
System
The HTCD Plus high-throughput circular dichroism spectrometer is capable of continuously measuring up to 192 samples (with two 96-well plates, up to 120 samples when using vials) in a fully automated manner, in addition to cleaning and drying samples, and is ideal for applications that require precise measurement of multiple samples, such as antibody drug similarity assessments.
The [qHOS] program converts the spectral difference into a parameter called the “Euclidean distance”. By weighting the Euclidean distance to account for noise and spectral variation, differences between spectra can be detected with high sensitivity (“weighted Euclidean distance”). The [qHOS] program allows statistical significance testing to determine whether the differences between spectra are due to noise or sample preparation errors, or are in fact chemically meaningful differences (Fig. 2). Three types of statistical tests can be selected according to the purpose (Table 1).
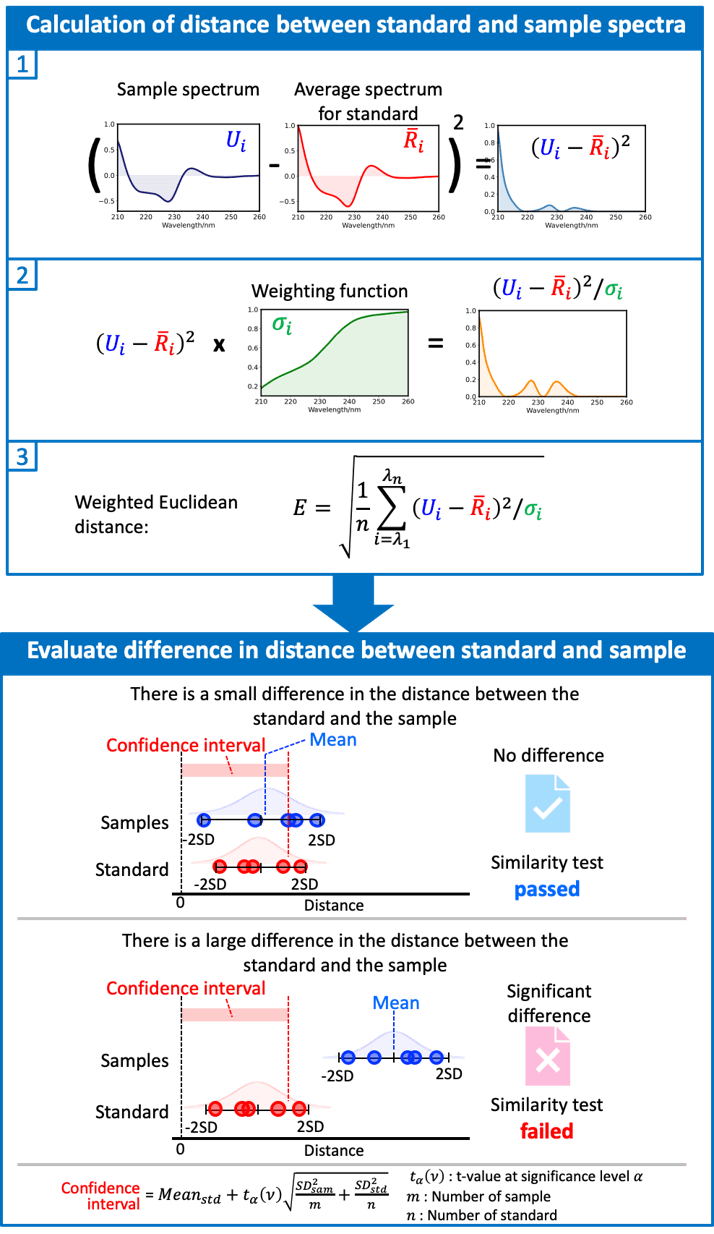
Fig. 2 Procedure for spectral similarity assessment.
Table 1 Procedure for each statistical test.
| Assay | Features |
| Student’s t-test |
|
| Welch’s t-test |
|
| Equivalence test (TOST) |
|
Samples
Rituximab: MabThera® (Innovator), RIABNI™ (Biosimilars)
Both samples were prepared to 10 mg/mL
Additive : Sodium citrate dihydrate 7.4 mg/mL, Sodium chloride 9.0 mg/mL, Sodium hydroxide 9.0 mg/mL, Polysorbate 80 0.7 mg/mL
Trastuzumab: Herceptin® (Innovator)
The powder was dissolved in H2O to a concentration of 10 mg/mL
Additives: trehalose hydrate 4.7 mg/mL, L-histidine hydrochloride hydrate 0.11 mg/mL, L-histidine 7.4 x 10⁻² mg/mL, polysorbate 2.1 x 10⁻² mg/mL
Analysis
Distance calculation method : Euclidean distance
Concentration correction : Absorbance (far-UV: Abs200, near-UV: 0.5 Abs280)
Smoothing : Savitzky-Golay
Weighting : Noise
Statistical testing : Welch’s t-test
Significance level : 0.05
Keywords
Antibody drugs, Higher order structure, HOS, Secondary structure, Tertiary structure, Biosimilars, Rituximab, MabThera®, RIABNI™, Trastuzumab, Herceptin®, Circular dichroism spectrometer, qHOS, Similarity assessment
Results
First, to confirm that this system can discriminate between the tertiary structures of antibody drugs with different targets and formulation conditions, we determined the similarity of the tertiary structures of MabThera®, the innovator of Rituximab, and Herceptin®, the innovator of Trastuzumab (Fig. 3). The shapes of the near-UV/CD spectra of MabThera® and Herceptin® differ significantly (Fig. 3a). Similarly, the average distances between MabThera® and Herceptin® calculated from the CD spectra show a large difference (Fig. 3b). The p-value obtained from the t-test is below the significance level of 0.05, indicating that Herceptin® has a different tertiary structure to MabThera®. These results show that the system can clearly distinguish differences in the tertiary structure of different antibody drugs.
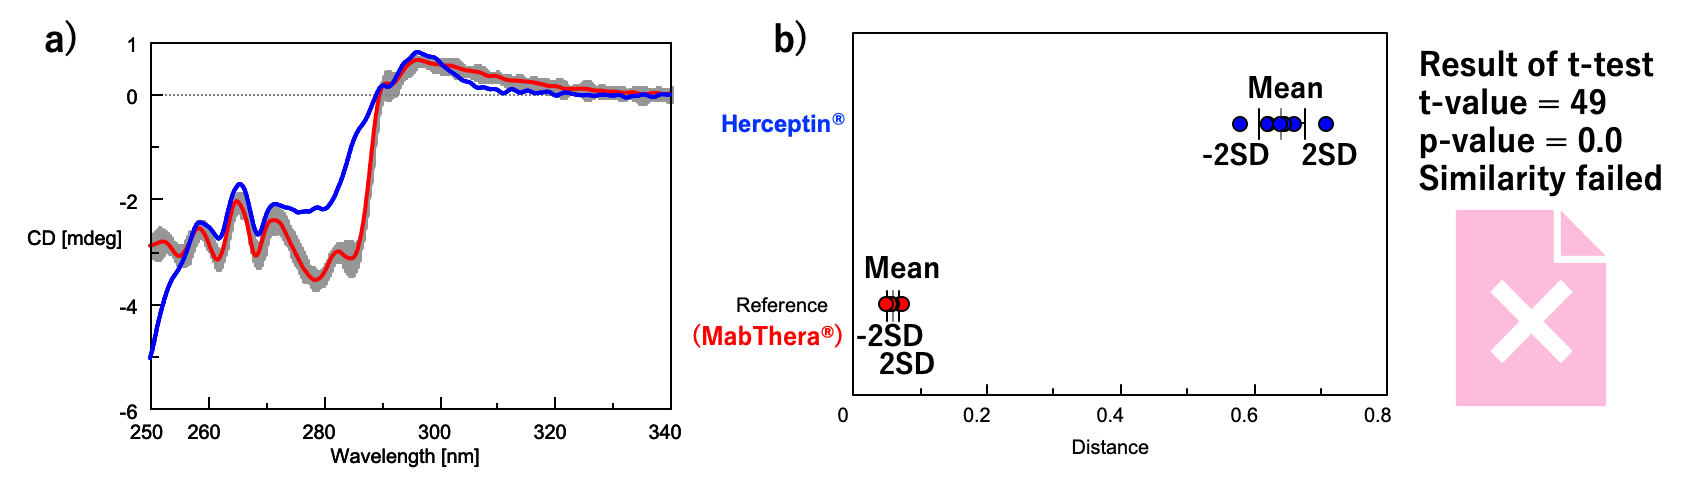
Fig. 3 Results of HOS similarity assessment for different antibody drugs.
a) Average spectra of MabThera® (red), Herceptin® (blue), and standard deviation for MabThera® (gray).
b) Distance and test results for MabThera® (red) and Herceptin® (blue).
Next, we determined the similarity of the tertiary and secondary structures of RIABNI™ and MabThera® (Fig. 4). The results for the tertiary structure similarity obtained from near-UV/CD spectra are shown in Figures 4a and 4b, and the results for the secondary structure similarity obtained from far-UV/CD spectra are shown in Figures 4c and 4d.
For both the near- and far-UV results, the CD spectrum of the biosimilar RIABNI™ is in excellent agreement with that of the innovator MabThera®, and the calculated distance is very small. The results of the t-test showed that the p-value was larger than the significance level of 0.05, objectively confirming that RIABNI™ has the same tertiary and secondary structures as MabThera®.
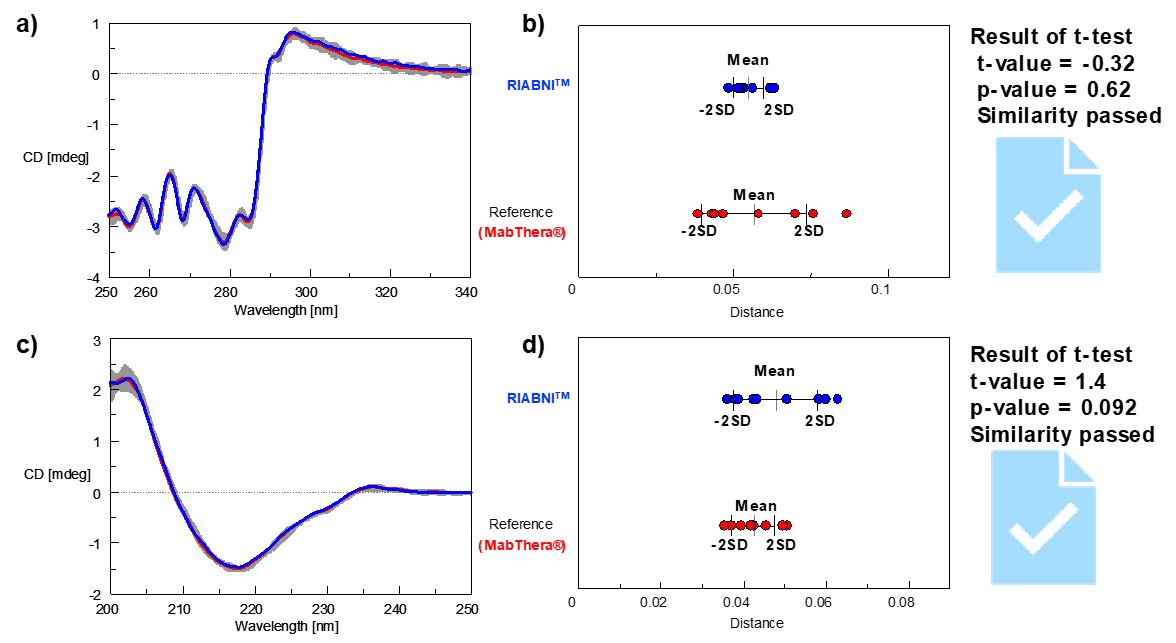
Fig. 4 Results of HOS similarity assessment for Rituximab innovator (red) and biosimilar (blue).
a) and c) mean spectra of MabThera® (red), RIABNI™ (blue), standard deviation for MabThera® (gray).
b) and d) distances and test results for MabThera® (red) and RIABNI™ (blue).
Conclusion
Using the HTCD Plus high-throughput CD spectrometer and the [qHOS] program, we found significant differences between the tertiary structures of MabThera® and Herceptin®, two antibody drugs with different targets and formulation conditions. On the other hand, RIABNI™, a biosimilar of MabThera®, was determined to have the same tertiary and secondary structures as MabThera® based on statistical testing. Using this system, it is possible to not only determine the similarity between the HOS of a biosimilar and an innovator, but also to accurately and easily evaluate whether the HOS of the antibody drug is changed by post-translational modification or external stress.
Appendix
Measurement conditions
Far-UV/CD spectrum
Bandwidth : 1.0 nm
Scanning speed : 50 nm/min
D.I.T. : 2 sec
Data interval : 0.1 nm
Accumulations : 4 times
Optical path length : 0.2 mm
Sample concentration : 0.5 mg/mL
Number of samples : 9
Near-UV/CD spectra
Bandwidth : 1.0 nm
Scanning speed : 2 0 nm/min
D.I.T. : 4 sec
Data interval : 0.1 nm
Accumulations : 4 times
Optical path length : 0.5 mm
Sample concentration : 10 mg/mL
Number of samples : 9
References
1) International Conference on Harmonisation (ICH) of Technical Requirements for Registration of Pharmaceuticals for Human Use. ICH AUTHORIZED MANUFACTURING CHANGES FOR THERAPEUTIC MABS 833 Harmonised Tripartite Guideline Comparability of Biotechnological/ Biological Products Subject to Changes in their Manufacturing Process Q5E. 2004
2) Department of Biotechnology, Government of India. Guidelines on similar biologics: Regulatory requirements for marketing authorization in India. 2012
3) Center for Drug Evaluation of China National Medical Product Administration. Technical guidelines for development and evaluation of biosimilars. 2015
4) US Food and Drug Administration. Development of Therapeutic Protein Biosimilars: Comparative Analytical Assessment and Other Quality-Related Considerations. 2019
5) European Medicines Agency. Guideline on similar biological medicinal products containing biotechnology-derived proteins as active substance: quality issues (revision 1). 2014
6) Y. Tsong, X. Dong, and M. Shen, Development of statistical methods for analytical similarity assessment, J. Biopharm. Stat. 2017


 spectrometer")


