Introduction
CD and CPL spectrometers are widely used for evaluation of the structure of chiral compounds, secondary structure estimation (SSE) for proteins, and CPL characterization of synthetic compounds. Most CD applications require not only the CD spectrum, but also the absorption (Abs) spectrum obtained using a UV/Vis spectrophotometer. For phosphors with CPL properties, the fluorescence (FL) spectrum of the sample is recorded using a spectrofluorometer, and the CPL and DC spectra are measured using a CPL spectrometer to obtain the glum value. Here, we describe example measurements using a JASCO J-1500 CD spectrometer, which can simultaneously record highly accurate CD and Abs spectra. The method for obtaining the FL spectrum using a CPL-300 CPL spectrometer and the accuracy of the spectral shape are discussed. An example of simultaneous measurement of CPL and FL spectra with the correct spectral shape for fluorescent substances such as Eu (facam)3 and camphor is presented.
This article shows the evaluation result of CPL-300 system performance (regarding the evaluation result of J-1500 system performance, please refer to the other article).
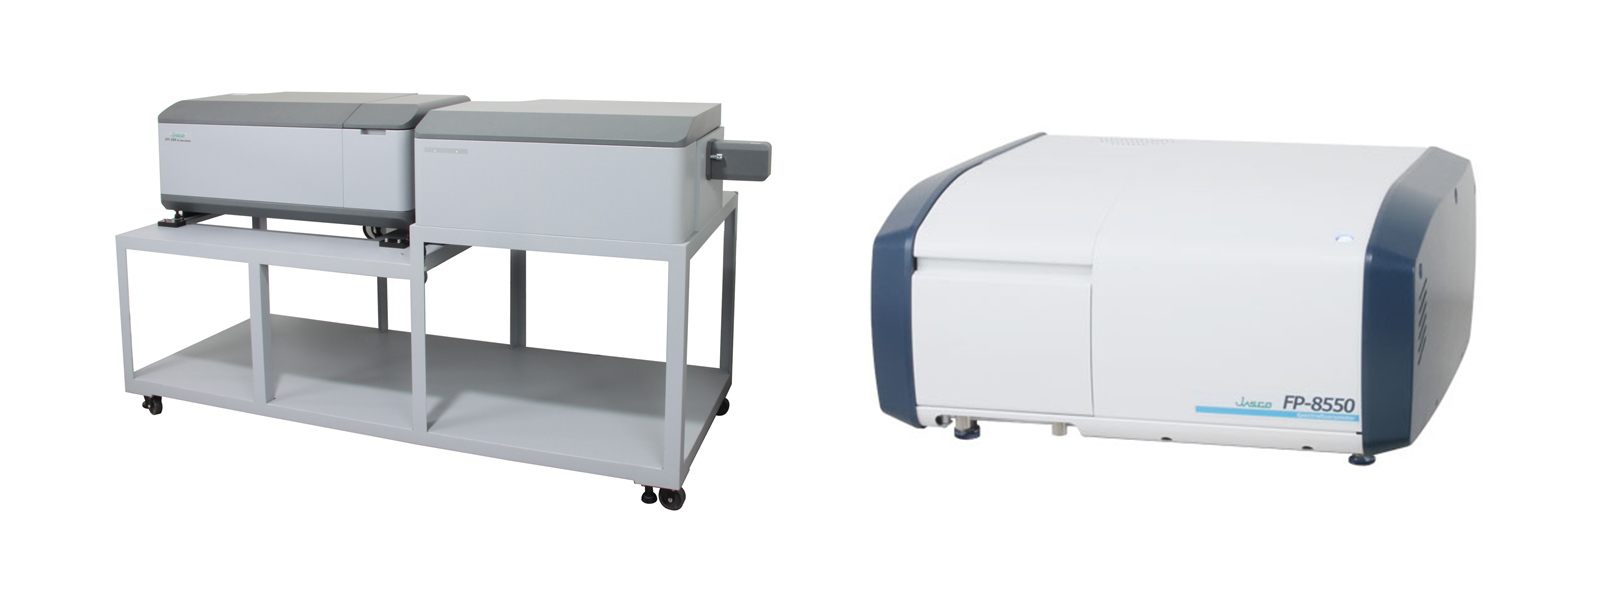
CPL-300 CPL Spectrometer (left) and FP-8550 Spectrofluorometer (right)
CPL-300 CPL Spectrometer
– 180° sample configuration to reduce artifacts
– Low stray light and no Wood’s anomalies
– Highly sensitive detection by lock-in amplifier
FP-8550 Spectrofluorometer
– Best-in-class sensitivity
– User-friendly operation
– Instrument maintenance functions
Experimental
Evaluation of Accuracy of FL Spectral Shape
The DC spectrum of a sample with a known FL spectrum was measured using the CPL-300. Spectral correction was performed, and the shapes of the corrected and reference spectra were compared.
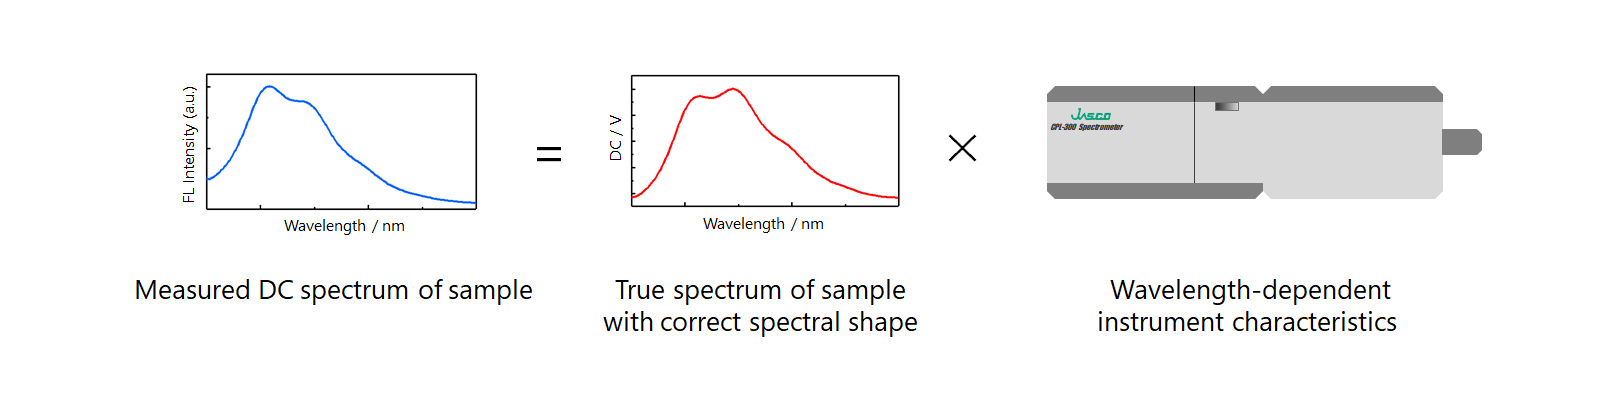
Figure 5. Need for spectral correction
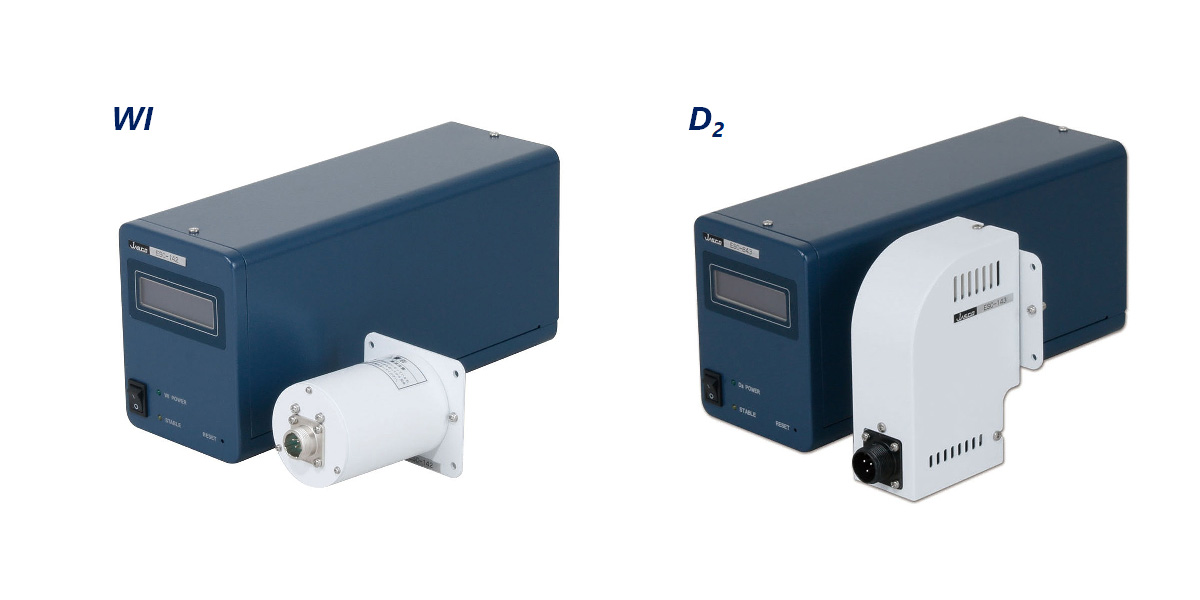
Light Source for Spectral Correction
(Halogen and deuterium lamps with emission spectra linked to national measurement standards.)
<Sample>
– NIST SRM 2943
– 0.77 mg/L tryptophan in water, 0.16 mg/L tetraphenylbutadiene (TPB) in cyclohexane, 0.16 mg/L coumarin 153 in methanol, 0.04 mg/L 4-(dicyanomethylene)-2-methyl-6-(p-dimethylaminostyryl)-4H-pyran (DCM) in methanol
Simultaneous Measurements of CPL and FL spectra
PL and DC spectra of typical CPL samples were measured using the CPL-300, and FL spectra of the samples were obtained using the FP-8550. Spectral correction was performed for each, and the shapes of the corrected spectra were compared.
<Sample>
– 5g/L Eu(facam)3 in DMSO, 4 g/L (+)-camphor, (-)-camphor, (±)-camphor in ethanol
Results
Accuracy of FL Spectral Shape for CPL-300
Figure 6 shows FL spectra of NIST SRM 2943 measured by CPL-300. The FL spectrum can be obtained with high accuracy using the CPL-300.
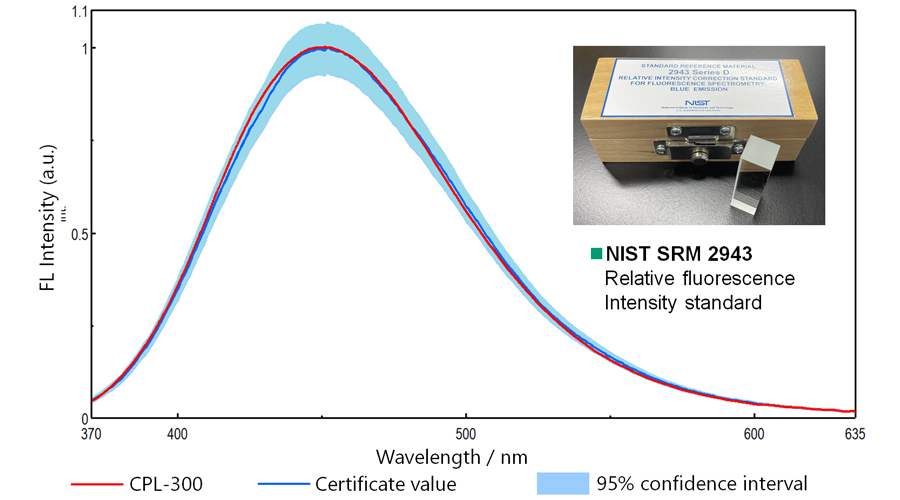
Figure 6. FL spectra of NIST SRM 2943
Figure 7 shows FL spectra of secondary FL standard solutions measured by CPL-300. FL spectra with the correct shape can be obtained over a wide wavelength range.
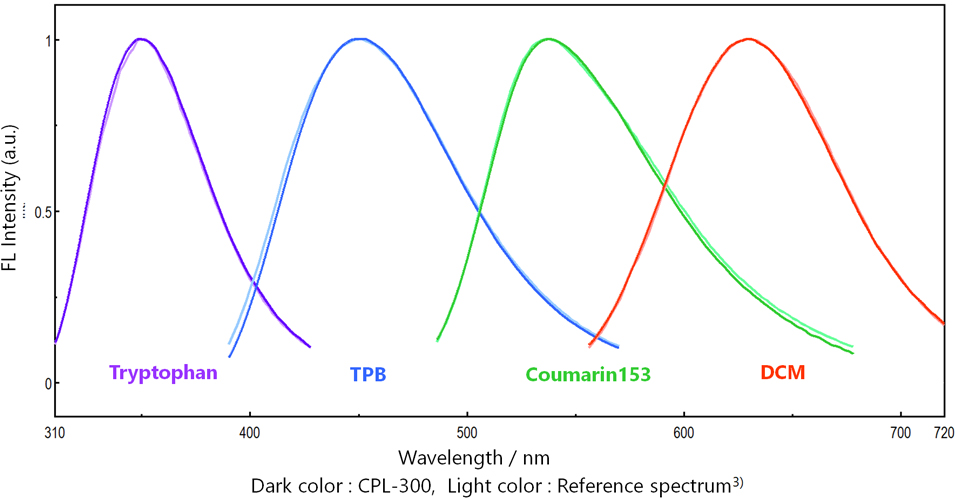
Figure 7. FL spectra of secondary FL standard solutions
Simultaneous Measurements of CPL and FL spectra
Figure 8 shows the CPL and FL spectra of each sample. FL spectra obtained by CPL-300 and FP-8550 showed good agreement.
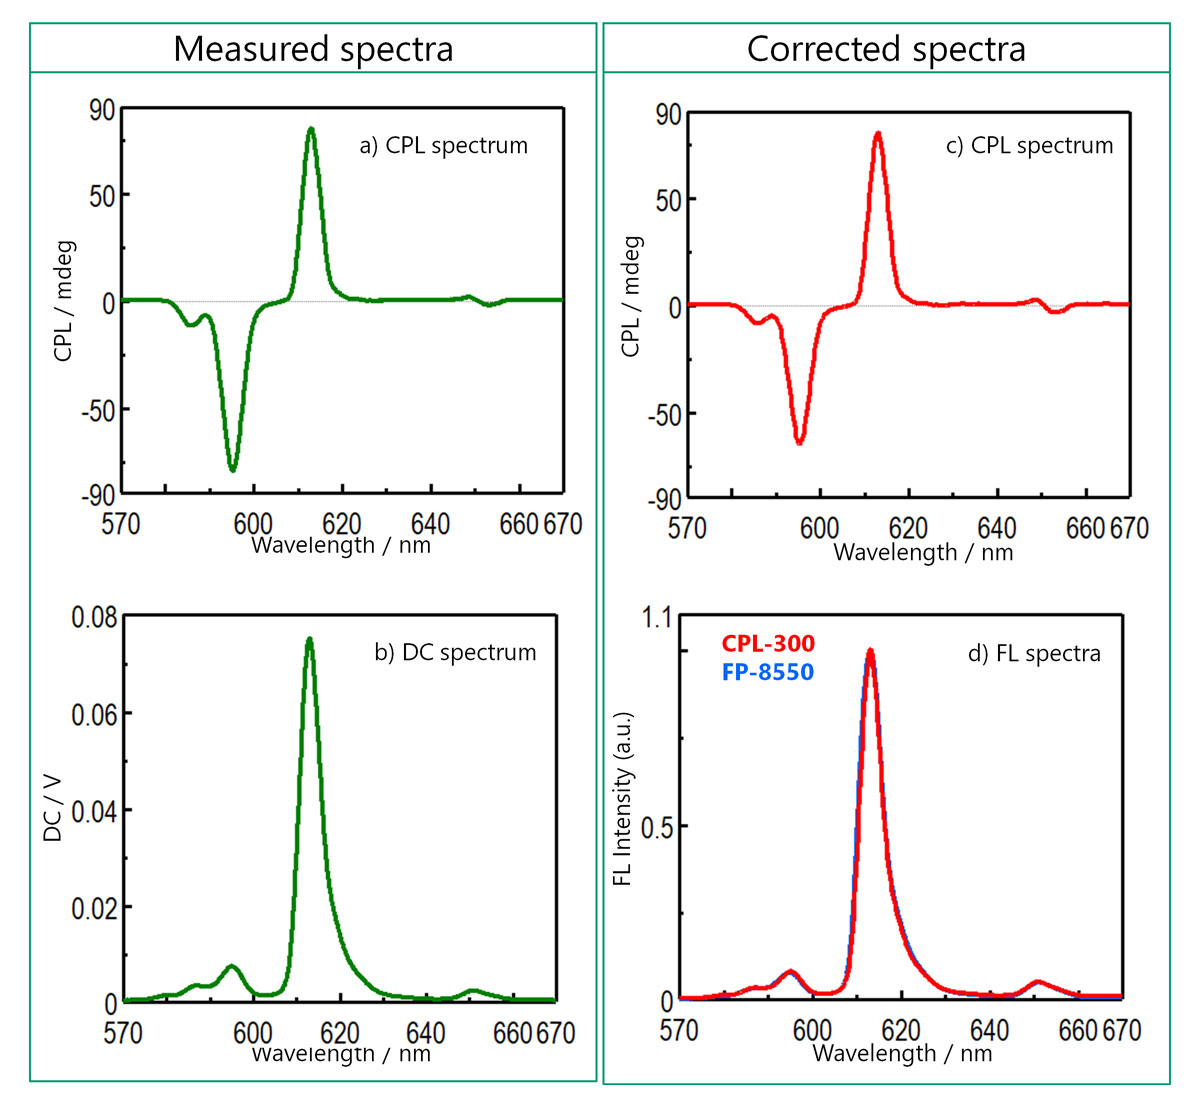
Figure 8. (a) CPL and FL spectra before and after spectral correction (Eu(facam)3 in DMSO)
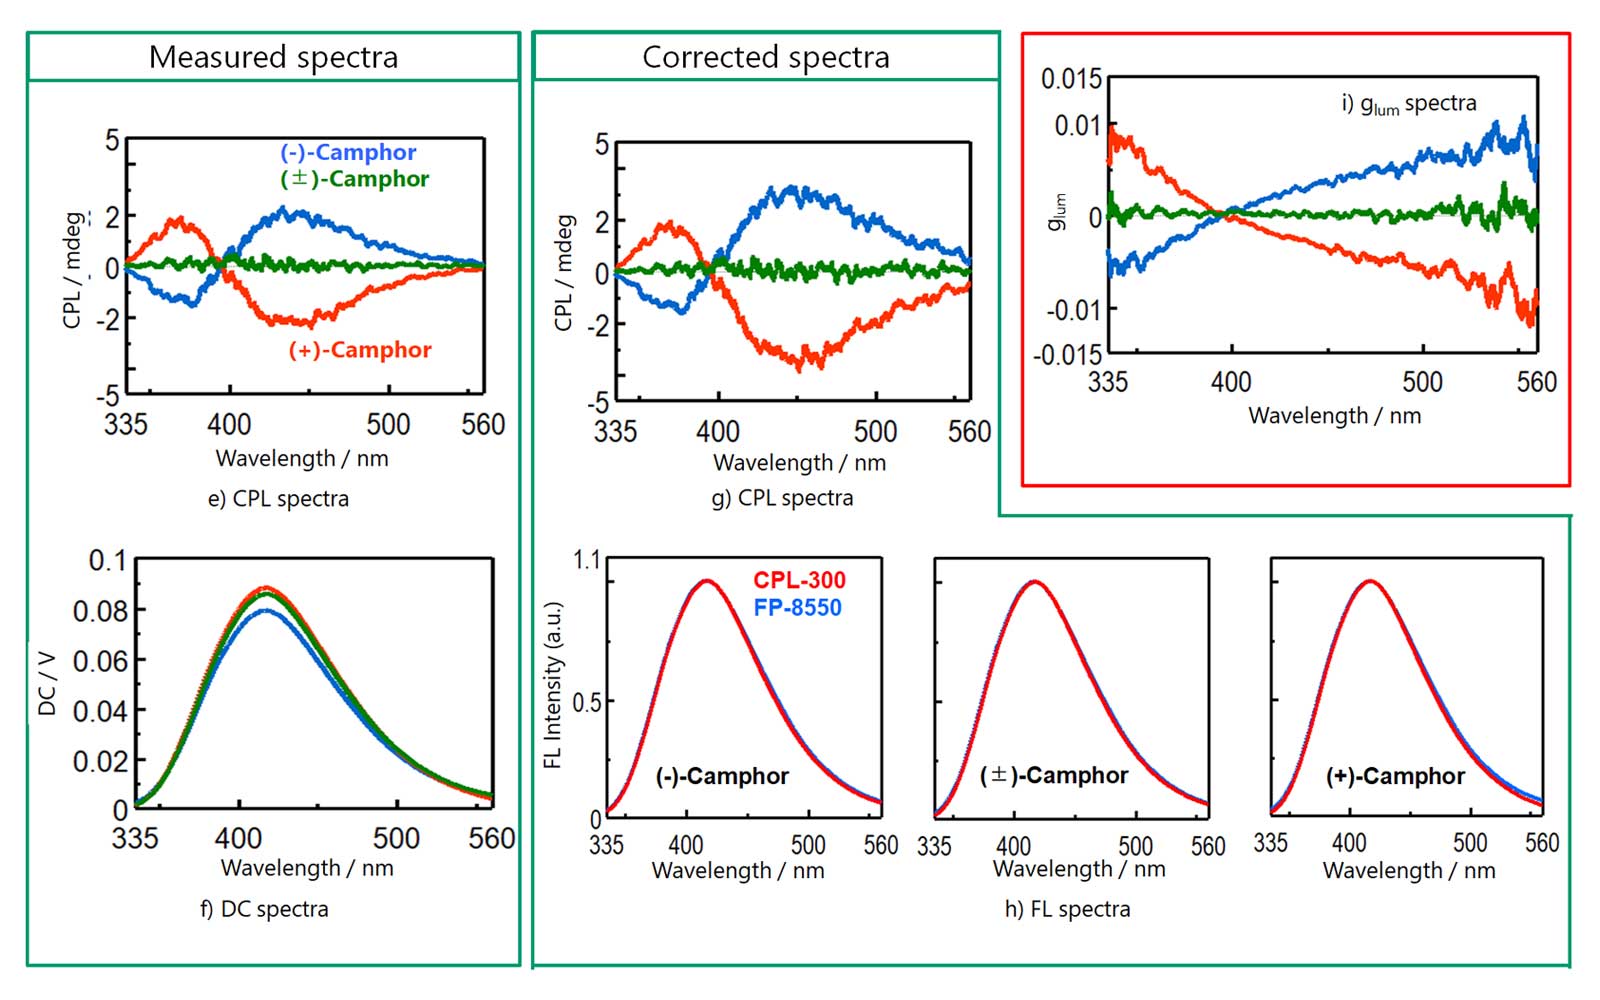
Figure 8. (b) CPL and FL spectra before and after spectral correction (Camphor in Methanol)
Conclusion
- It was demonstrated that fluorescence spectra with the correct shape can be obtained over a wide wavelength range by performing spectral correction of the DC signal measured by the CPL-300.
- It may be useful to perform spectral correction not only for the DC spectrum but also for the CPL spectrum to compare the spectral shapes between instruments.
References
Poster Session at ICCC-2022 (International CREST-CPL Conference 2022 , March 3 – 4, 2022, in Awaji, JAPAN)
Satoko Suzuki, Akio Kaneta, and Ken-ichi Akao
JASCO Corporation, Tokyo, Japan
3) J. A. Gardecki, M. Maroncelli, Appl. Spectrosc., 52 (1998) 1179-1189.


 properties of platinum complexes using a CPL measurement system and a spectrofluorometer")

