Introduction
CD and CPL spectrometers are widely used for evaluation of the structure of chiral compounds, secondary structure estimation (SSE) for proteins, and CPL characterization of synthetic compounds. Most CD applications require not only the CD spectrum, but also the absorption (Abs) spectrum obtained using a UV/Vis spectrophotometer. For phosphors with CPL properties, the fluorescence (FL) spectrum of the sample is recorded using a spectrofluorometer, and the CPL and DC spectra are measured using a CPL spectrometer to obtain the glum value. Here, we describe example measurements using a JASCO J-1500 CD spectrometer, which can simultaneously record highly accurate CD and Abs spectra. The method for obtaining the FL spectrum using a CPL-300 CPL spectrometer and the accuracy of the spectral shape are discussed. An example of simultaneous measurement of CPL and FL spectra with the correct spectral shape for fluorescent substances such as Eu (facam)3 and camphor is presented.
This article shows the evaluation result of J-1500 system performance (regarding the evaluation result of CPL-300 system performance, please refer to the other article).
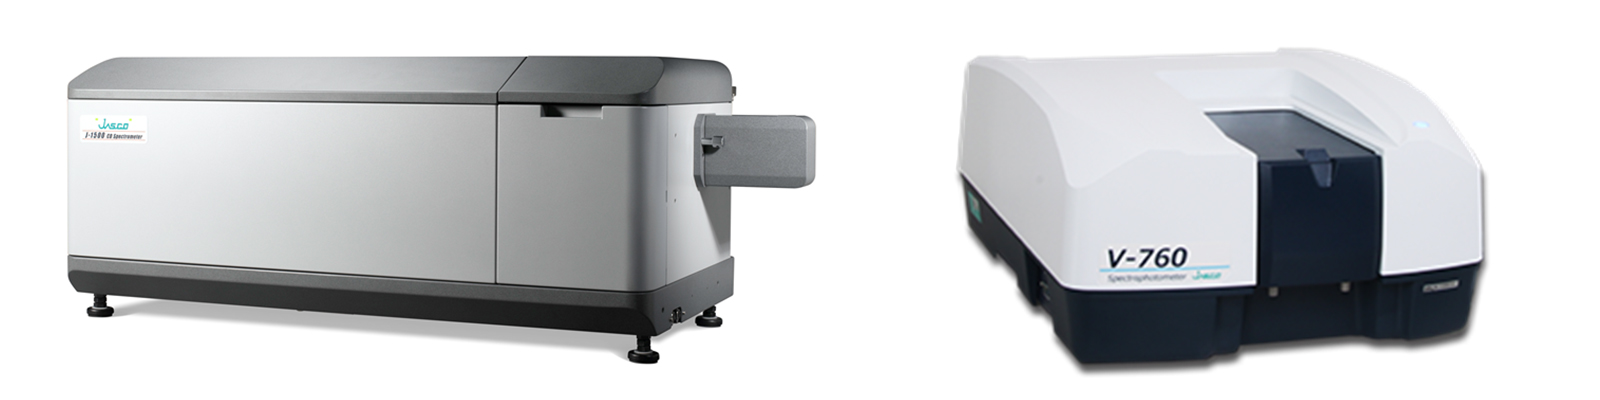
J-1500 CD Spectrometer (left) and V-760 UV/Vis Spectrophotometer (right)
J-1500 CD Spectrometer
– Simultaneous measurement of CD, Abs, and FL spectra
– High S/N data can be acquired
V-760 UV/Vis Spectrophotometer
– Excellent photometric and wavelength accuracy
– Measurable up to Abs 6
Experimental
Evaluation of Abs Accuracy of J-1500
The Abs value for the standard NIST SRM 930 sample for determining the photometric accuracy of spectrophotometers was obtained using the HT-Abs formula in advance, and the accuracy was calculated. In addition, the absorption spectra of IgG aqueous solutions with different concentrations were measured using the J-1500 and V-760 and the results were compared.
<Sample>
– NIST SRM 930
– 0.1, 0.21, 0.43, 0.64, 0.88 mg/L IgG from human serum in water
Comparison of SSE using Abs value determined using J-1500 and V-760
CD and absorption spectra of the proteins were measured using the J-1500, and absorption spectra were also measured using the V-760. The concentration of each sample was calculated from the measured Abs214 using the ε214 obtained from the amino acid sequence. The vertical axis was converted to mean residue ellipticity (MRE), and SSE was performed using BeStSel.
<Sample>
– 0.16 mg/mL Herceptin® in water
– 0.1 mg/L IgG from human serum in water
<SSE>

http://bestsel.elte.hu/index.php1), 2)
– Online Web server used worldwide.
– Superior SSE performance
Results
Accuracy of Abs value for J-1500
Table 1 shows the evaluation result of Abs accuracy of J-1500. The results for the NIST SRM 930 sample using the J-1500 gave a photometric accuracy of ±0.01 or less (Table 1), indicating that the J-1500 has excellent measurement accuracy for a single-beam spectrophotometer.
Table 1. Abs accuracy for J-1500
| Criterion | 0.5577 | 0.7297 | 1.033 |
|---|---|---|---|
| Average | 0.5614 | 0.7327 | 1.0391 |
| Deviation | 0.004 | 0.003 | 0.006 |
Comparison of Abs Between J-1500 and V-760
Figure 1 shows absorption spectra of IgG measured by J-1500 and V-760, and figure 2 shows Abs value and its difference for IgG at 280 nm. The results revealed that the difference between the J-1500 and V-760 at 280 nm was ±0.005 Abs or less, and the difference was very small (Fig. 2).
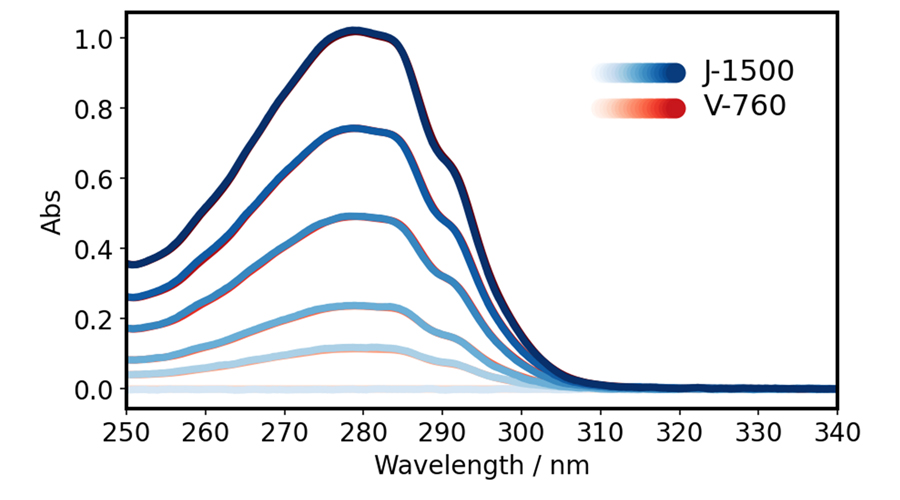
Figure 1. Abs spectra of IgG
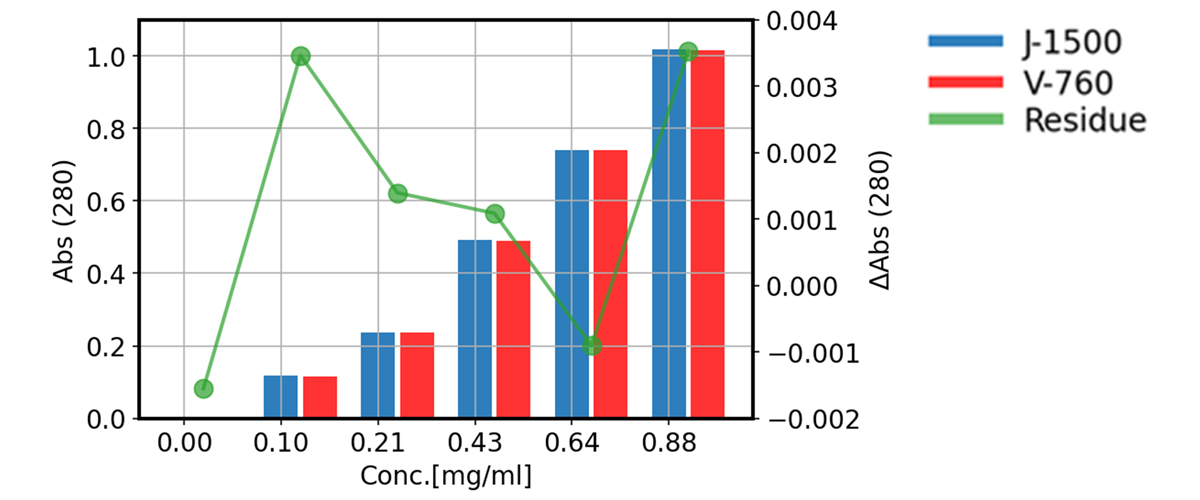
Figure 2. Abs and difference for IgG at 280 nm
CD, Abs, and MRE Spectra
Figure 3 (a) shows CD and absorption spectra of each sample measured by J-1500, and Figure 3 (b) shows MRE spectra of each sample. No significant difference was found in the MRE calculated using the absorbance obtained with either instrument.
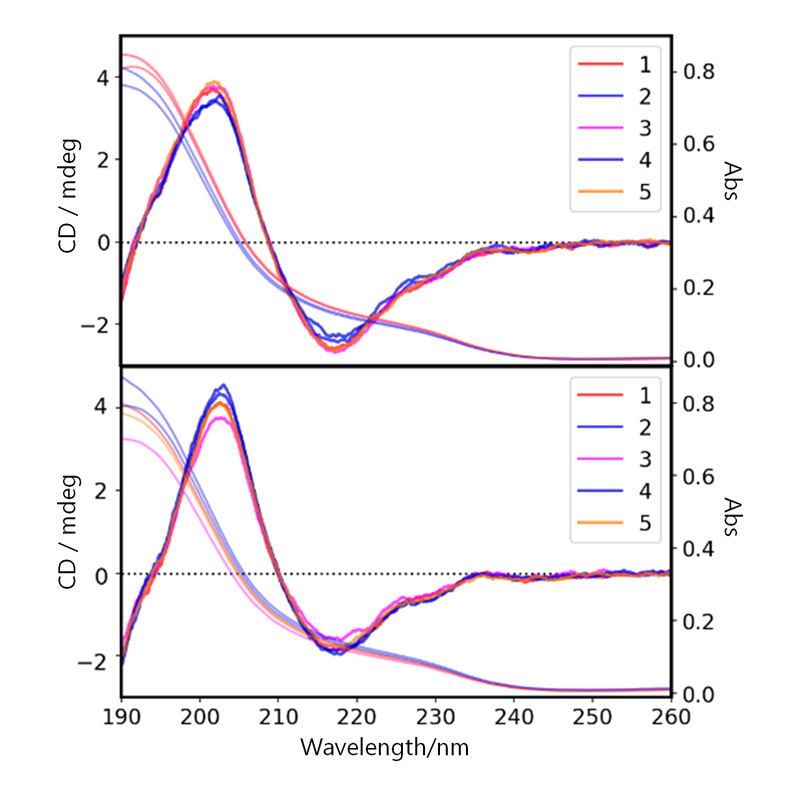
Figure 3. (a) CD and Abs spectra (Top panel: IgG, bottom panel: Herceptin)
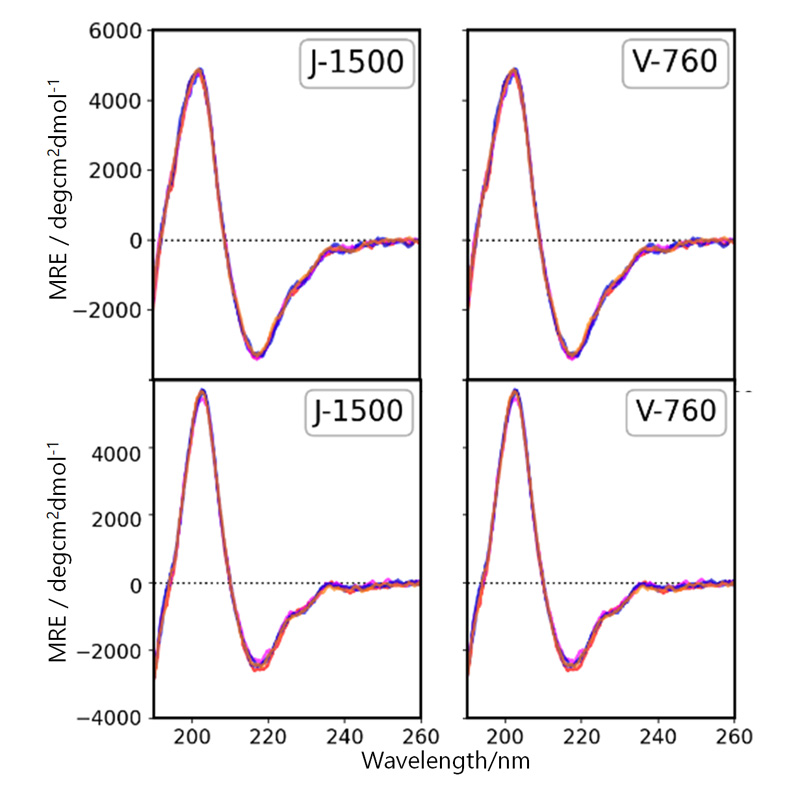
Figure 3. (b) MRE spectra (Top panel: IgG, bottom panel: Herceptin)
Results of SSE
Figure 4 shows the results of SSE. The absorbance difference between the J-1500 and V-760 does not affect the results of SSE.
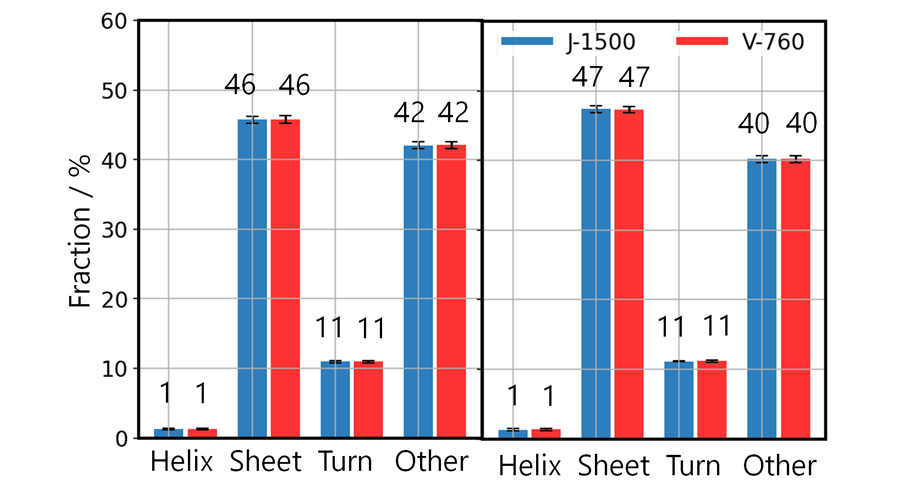
Figure 4. Results of SSE (Left l: IgG, Right: Herceptin)
Conclusion
- The J-1500 CD spectrometer exhibited excellent photometric accuracy for a single-beam instrument.
- The absorbance difference between the J-1500 and V-760 did not affect the results of SSE. Therefore, it can be concluded that the J-1500 has sufficient absorbance measurement accuracy for performing detailed assessments.
References
Poster Session at ICCC-2022 (International CREST-CPL Conference 2022 , March 3 – 4, 2022, in Awaji, JAPAN)
Satoko Suzuki, Akio Kaneta, and Ken-ichi Akao
JASCO Corporation, Tokyo, Japan
1) A. Micsonai, F. Wien, L. Kernya, Y.H. Lee, Y. Goto, M. Refregiers, J. Kardos, PNAS, 112 (2015) 3095-3103.
2) A. Micsonai, F. Wien, E. Bulyaki, J. Kun, E. Moussong, Y.H. Lee, Y. Goto, M. Refregiers, J. Kardos, Nucleic Acids Res, 46 (2018) 315-322.


 properties of platinum complexes using a CPL measurement system and a spectrofluorometer")

