Introduction
Higher-order structure (HOS) is an important antibody drug physicochemical property.1) The most well-known method for HOS characterization is circular dichroism (CD) spectroscopy. CD spectroscopy can provide robust information of secondary and tertiary structures under various formulation conditions such as temperature, pH, and additives.2) However, since these measurements require considerable time and effort when performed manually, automation of the process is desirable. Secondary structure estimation (SSE) offers a route to evaluate protein HOS, but historically has not worked well for proteins such as antibodies with high amounts of β-sheets. Recently, Micsonai et al. developed the BeStSel algorithm that can accurately estimate the secondary structure from a CD spectrum by taking into account parallel-antiparallel orientations of β-strands and twisting of antiparallel β-sheets. BeStSel has the following features: 1) high estimation accuracy for a wide range of proteins, including β-strand-rich proteins such as antibodies, 2) provides eight types of secondary structure information, 3) capability to predict protein folding following CATH classification, and 4) open web server.3-7)
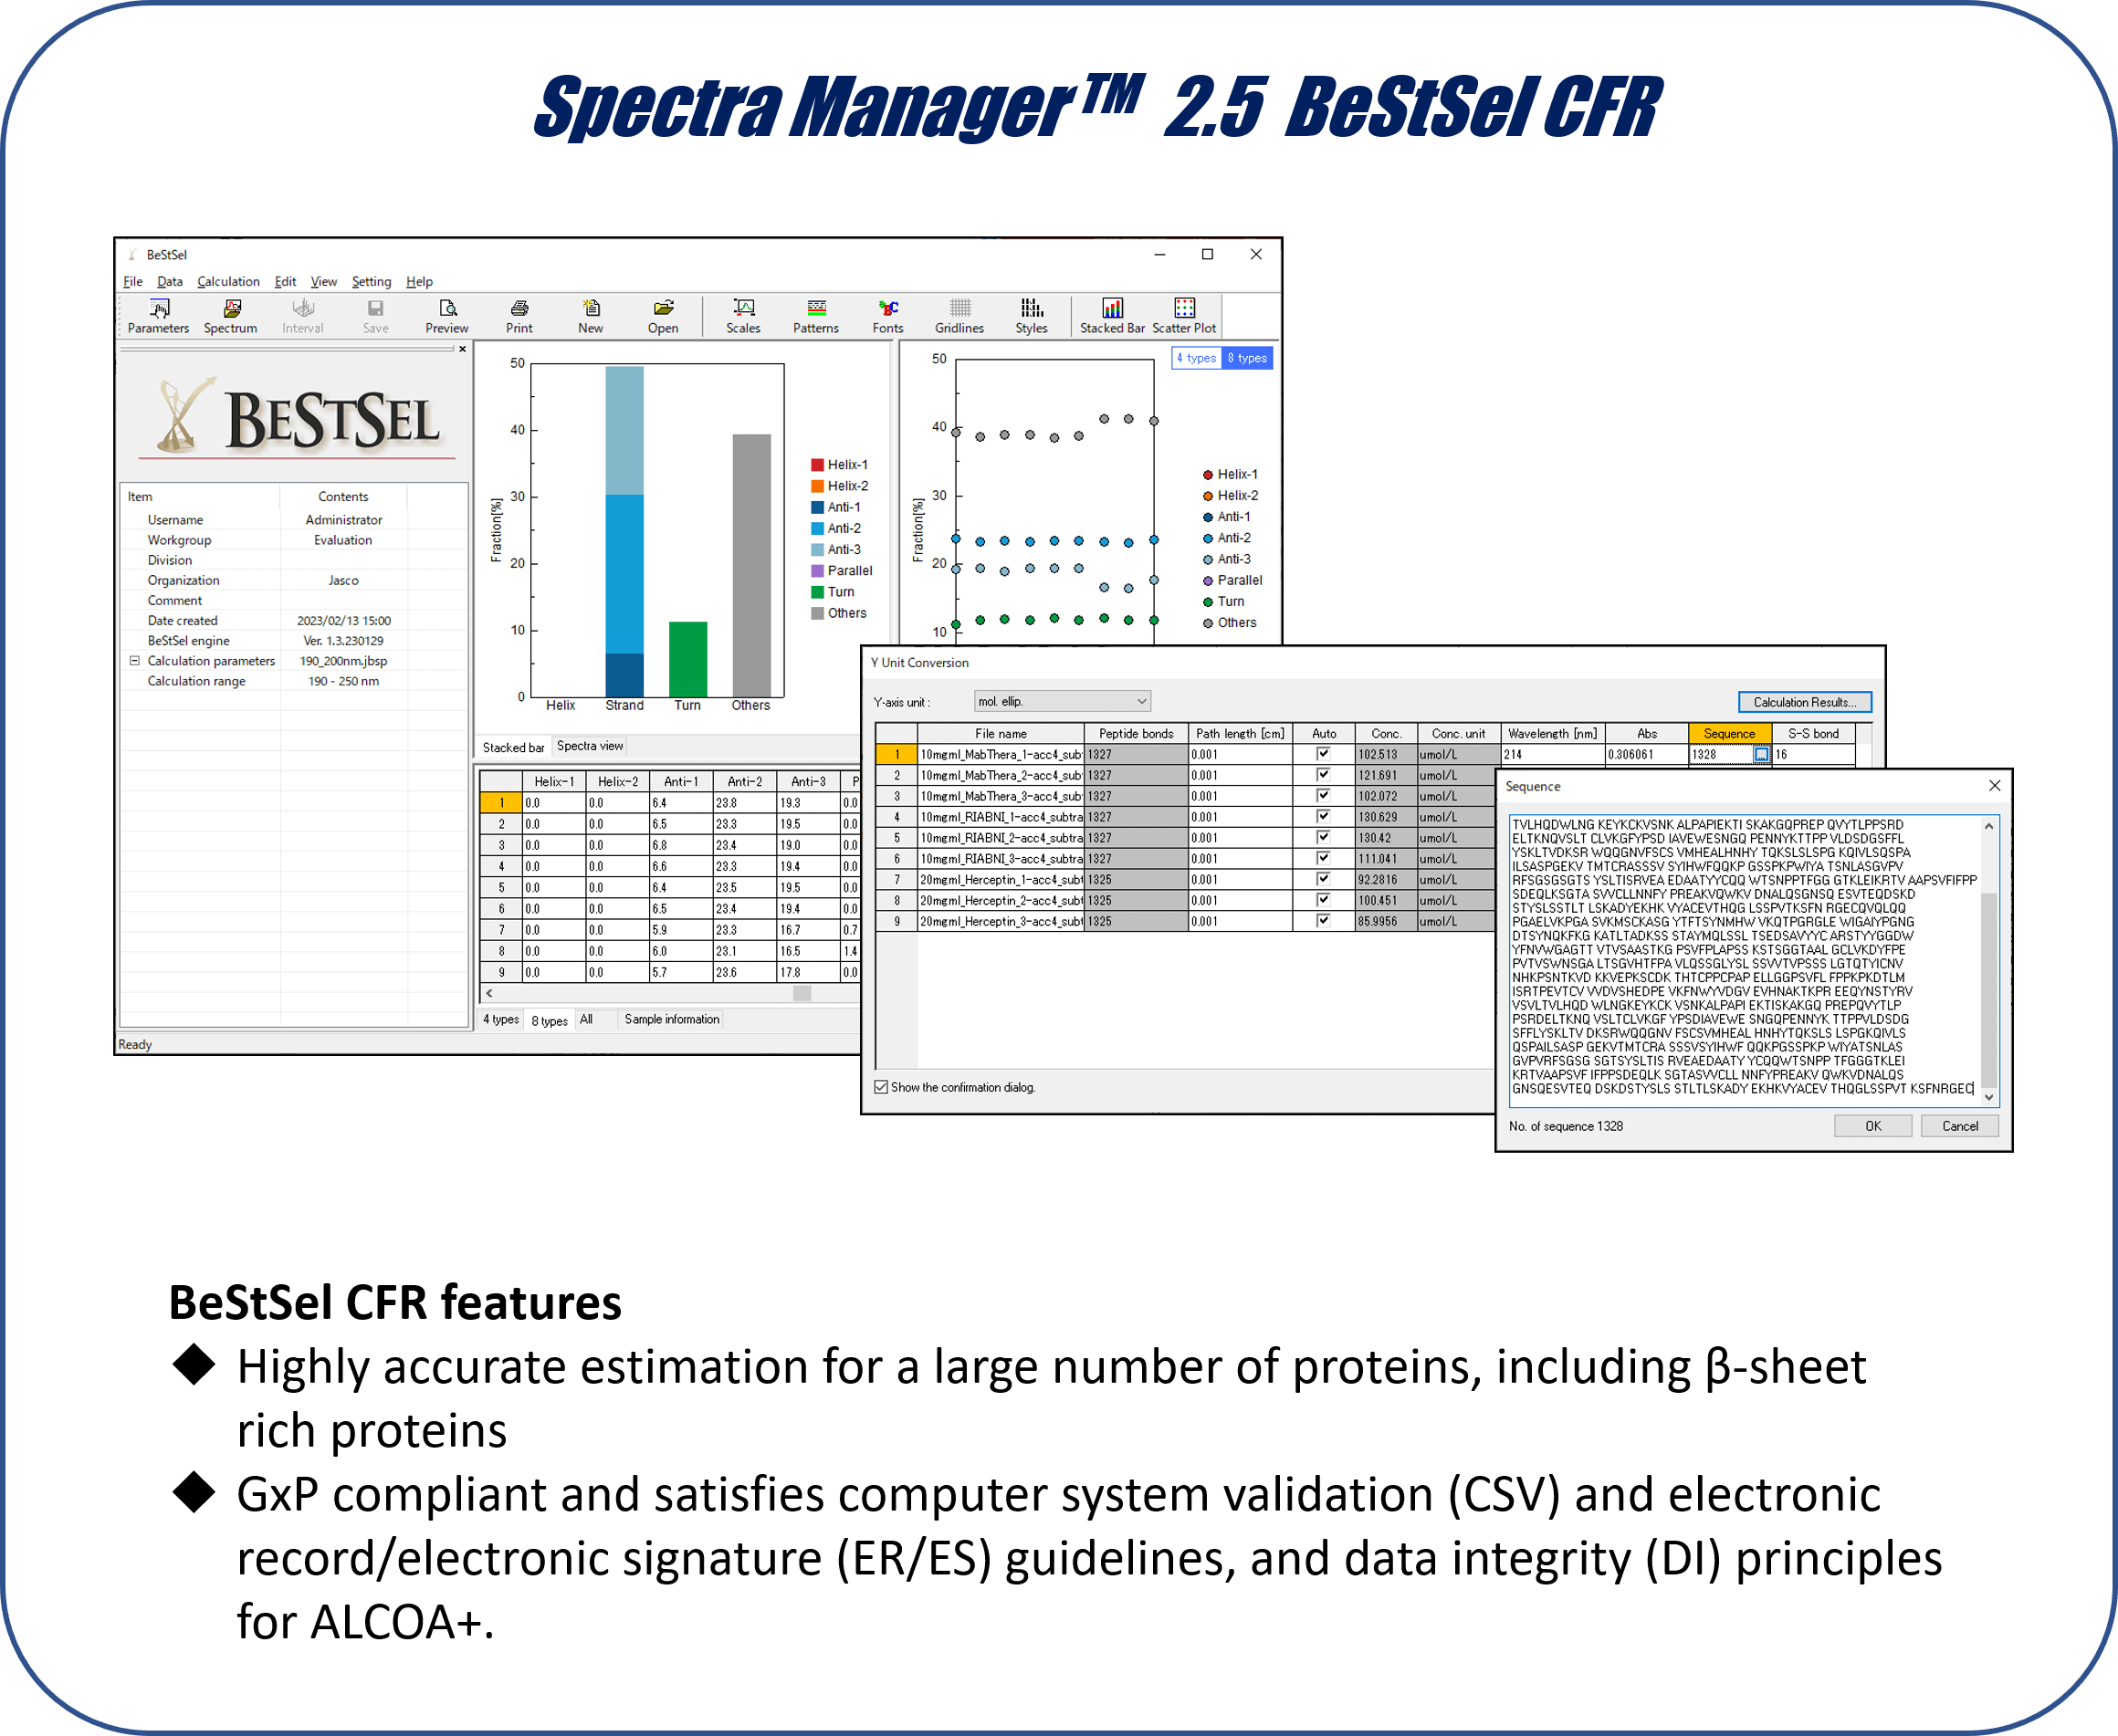
While many academic researchers use the BeStSel web server, researchers in biopharma companies who need to work in a GxP environment have not been able to benefit from BeStSel. To make BeStSel accessible to biopharma, we developed Spectra Manager™ 2.5 BeStSel CFR as an add-on to Spectra Manager™, which is a control and analysis platform for JASCO CD spectrometers that is compatible with GxP.
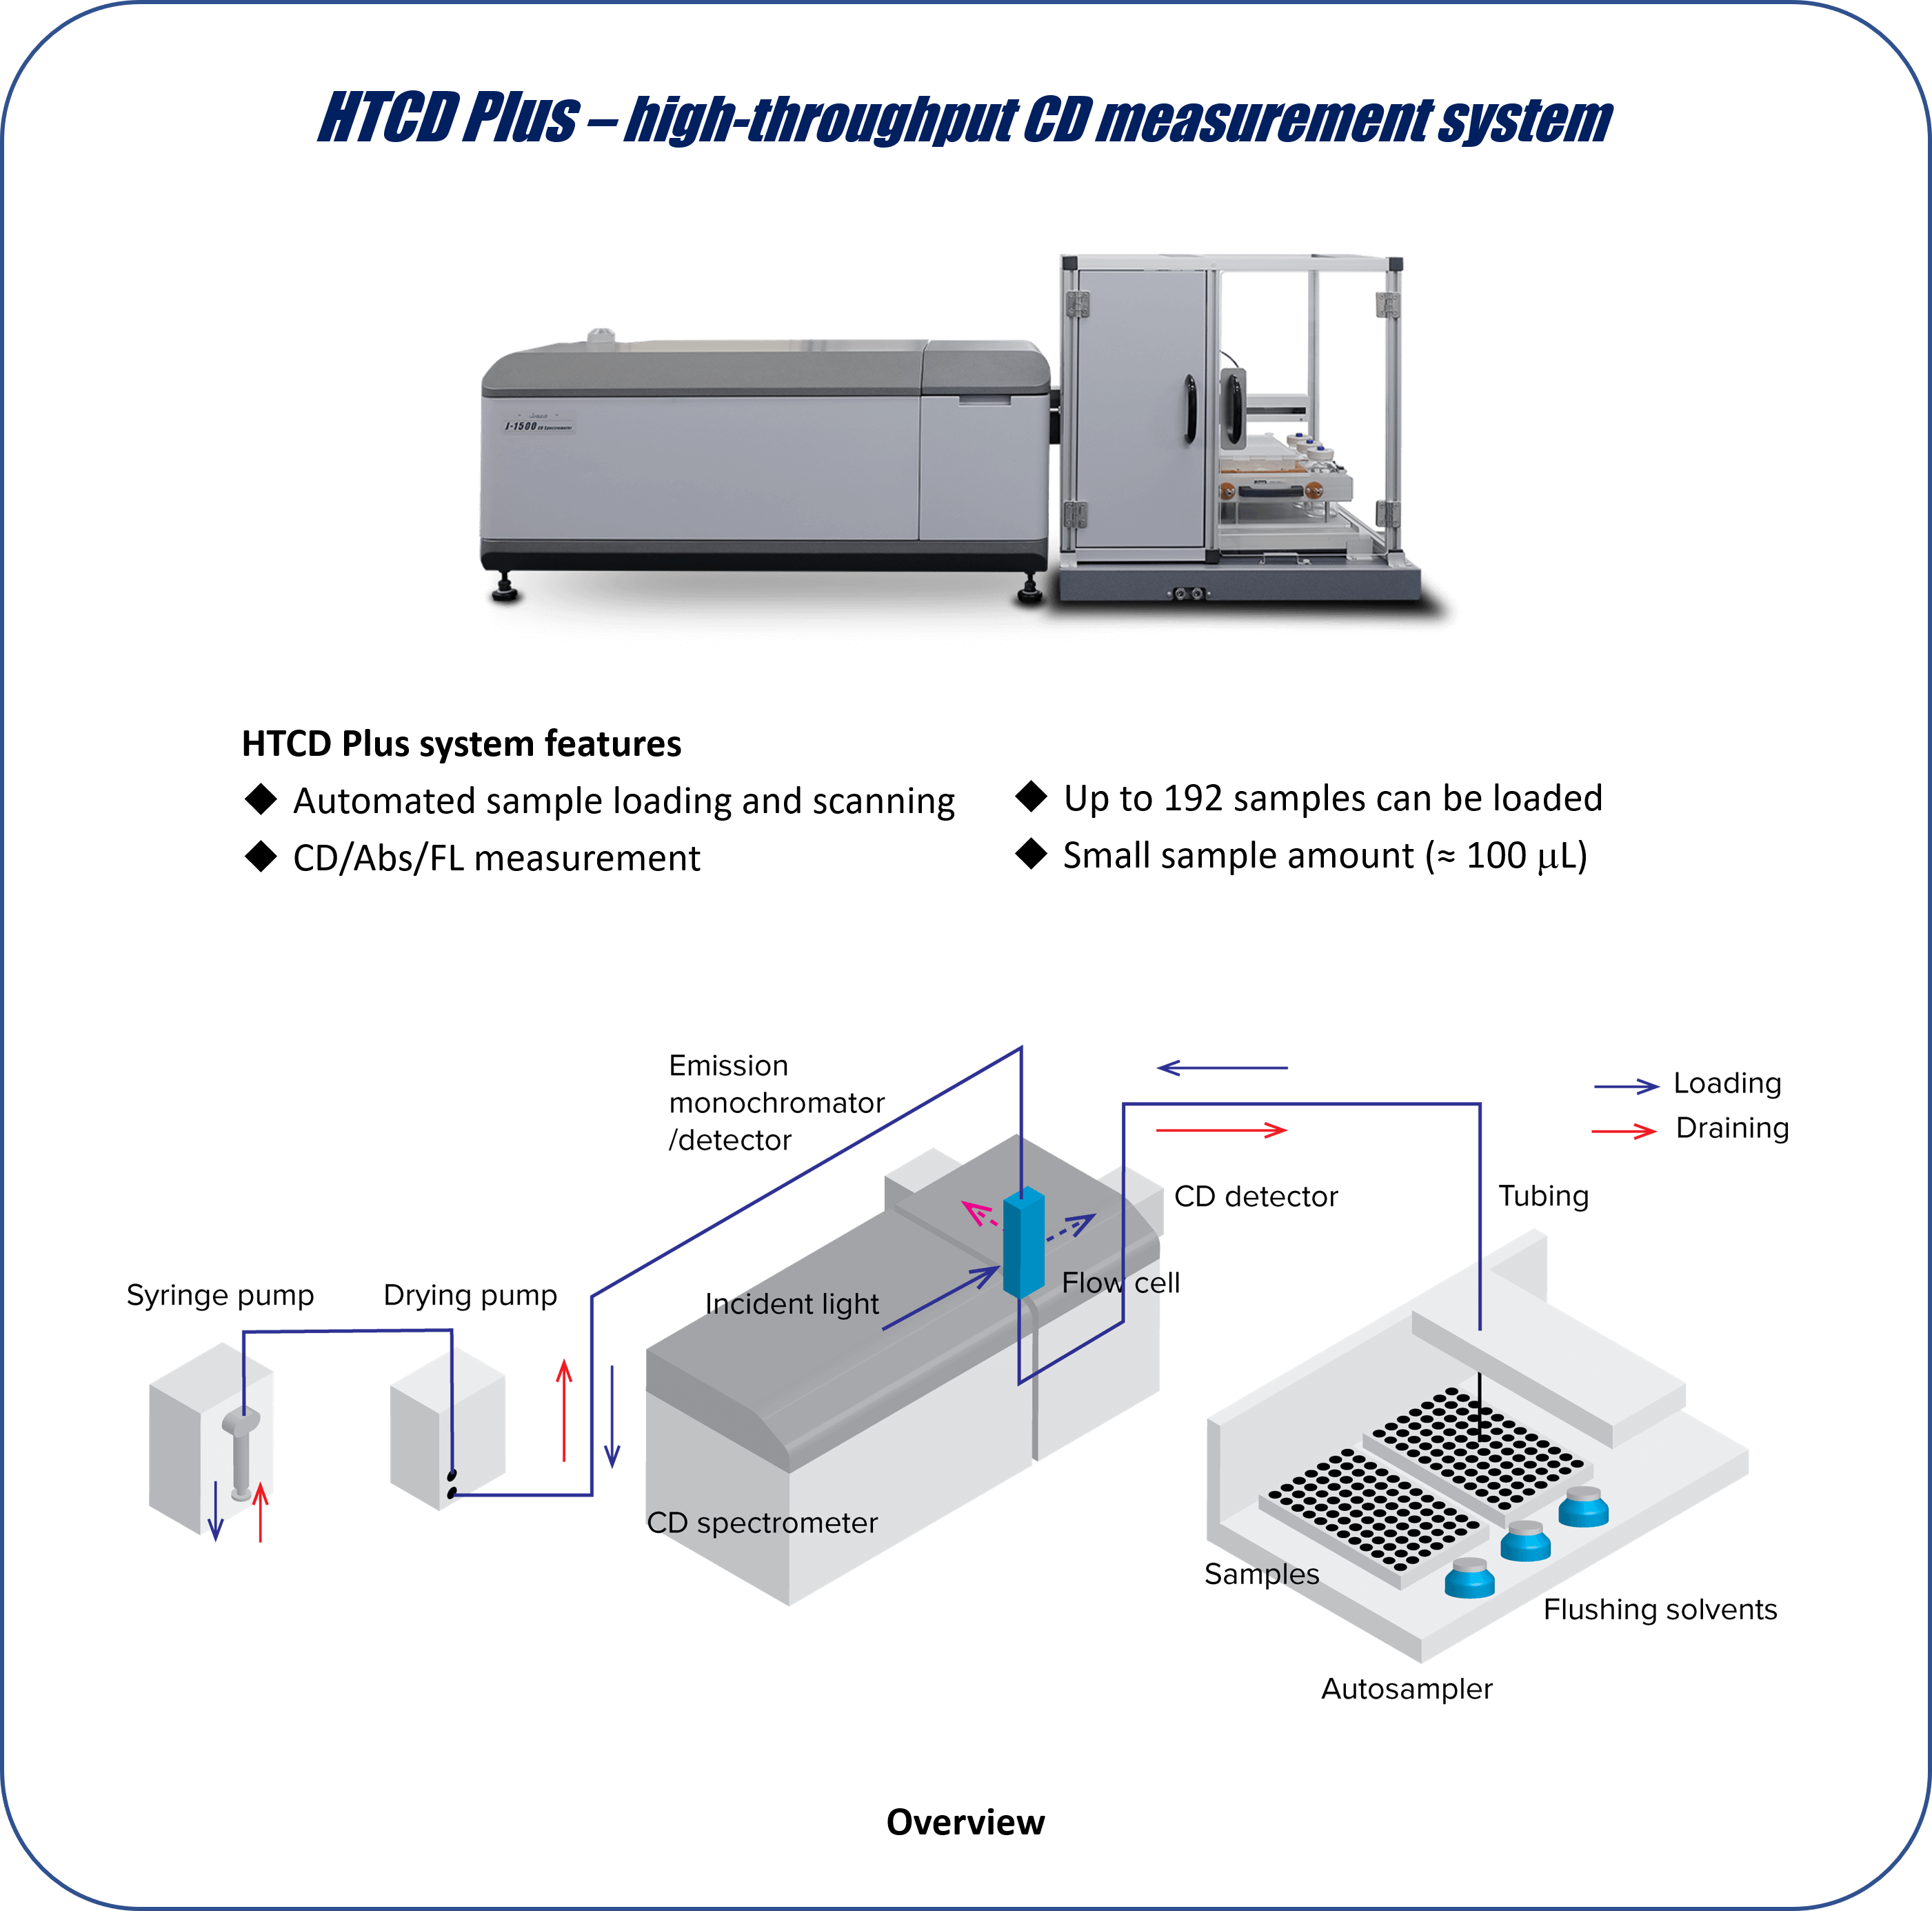
Here, we report the results of a comprehensive analysis of the secondary structure of antibody drugs under various pH conditions utilizing a seamless workflow that combines the automated CD/Absorbance(Abs)/Fluorescence(FL) measurement system HTCD Plus and Spectra Manager 2.5 BeStSel CFR.
Experimental
Instrument
Parameters
• Each sample was loaded four times, with 120 μL of sample used for each measurement. All the spectra were collected at 25 ⁰C.
• Parameters for CD spectrum collection: pathlength = 1 mm; D.I.T. = 2 sec; bandwidth = 1 nm; scan speed = 50 nm/min; averaging over four accumulated scans per sample.
• Parameters for FL spectrum collection: pathlength = 10 mm; D.I.T. = 1 sec; excitation wavelength = 280 nm; data pitch = 1 nm.
• Parameters for flow washing: 1st wash = 1% Hellmanex® III 250 μL x 1; 2nd wash = ultrapure water 300 μL x 4; 3rd wash = ethanol 300 μL x 2; drying = 60 sec.
Materials
Herceptin® (trastuzumab, Roche) was dissolved in ultrapure water. After overnight dialysis at room temperature, the solution was diluted with phosphate buffer spanning the pH range 2 to 10 to give samples with a final concentration of 0.2 mg/mL.
RIABNI™ (Rituximab, AMGEN, 10 mg/mL) was diluted 10-fold with ultrapure water. After overnight dialysis at room temperature, the solution was diluted with phosphate buffer spanning the pH range 2 to 10 to give samples with a final concentration of 0.2 mg/mL.
Results
Figure 1 shows the MRE and FL spectra of antibody drugs at different pH values. By using the HTCD Plus, high-quality CD/FL/Abs spectra of Herceptin and RIABNI at different pH values could be obtained simultaneously. MCD spectra were seamlessly converted from raw MRE spectra using a function in Spectra Manager 2.5 BeStSel CFR (Figs. 1a and 1b).
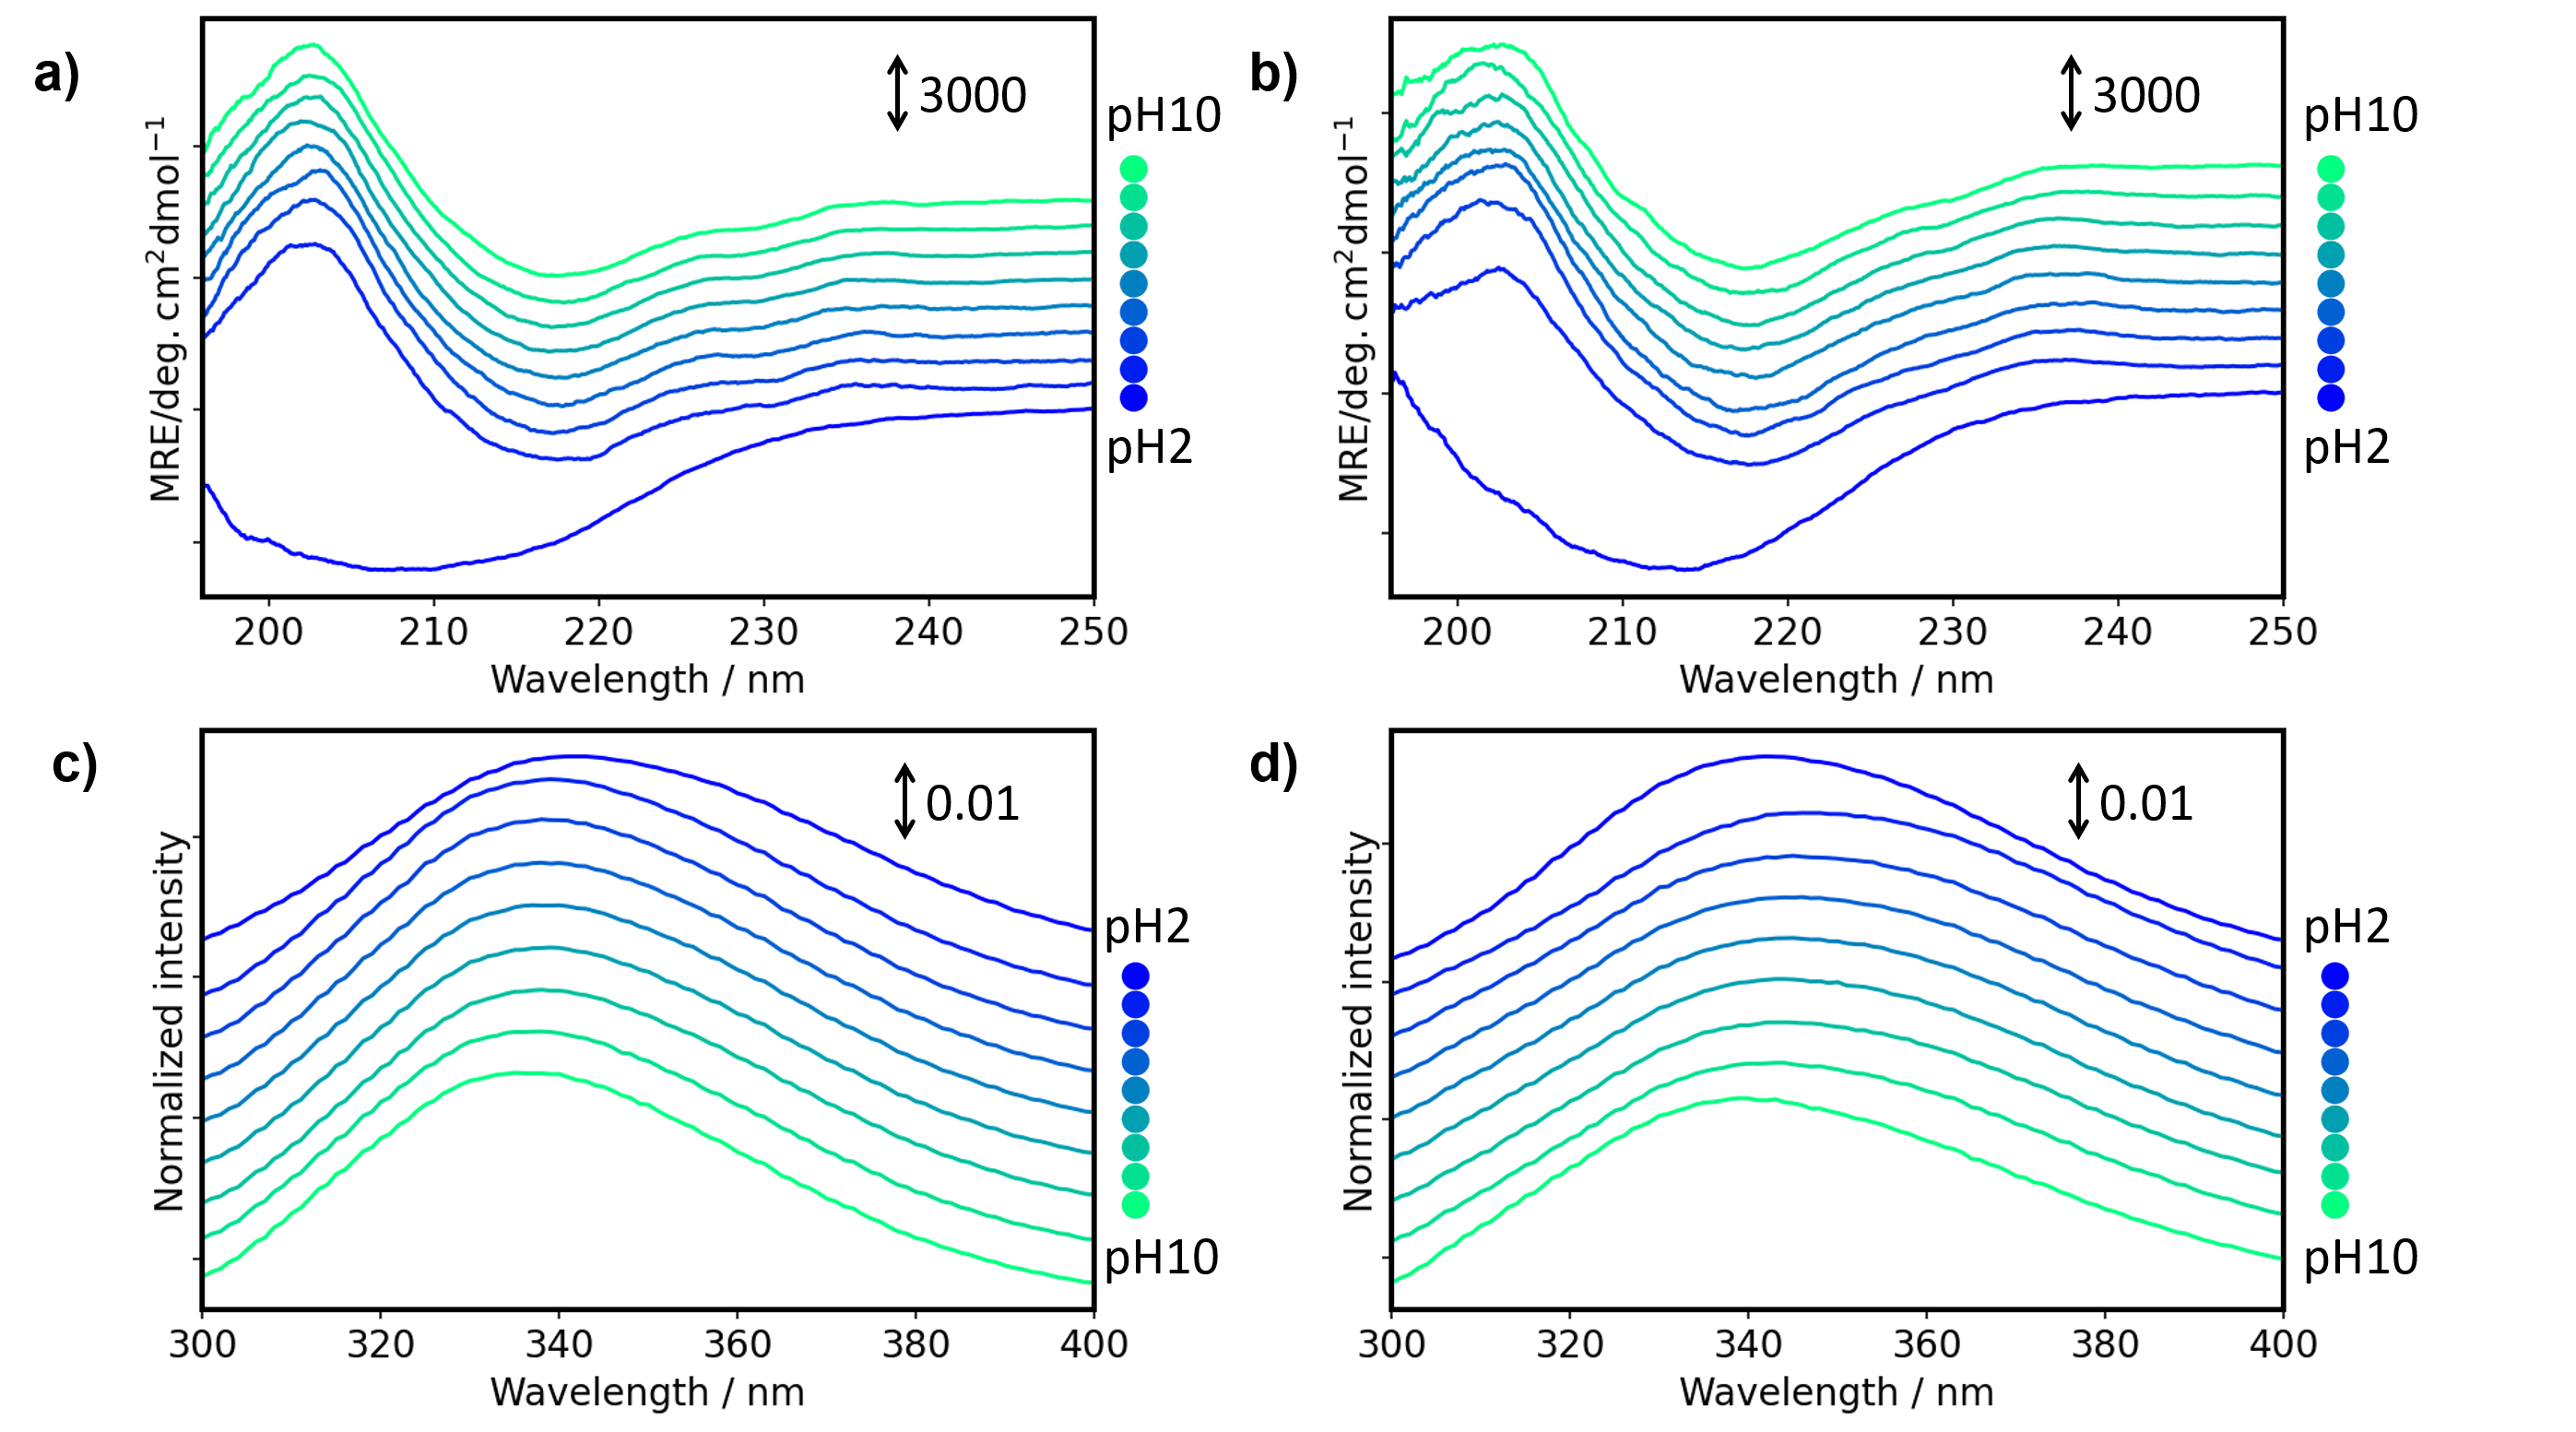
Figure 1. MRE and FL spectra of antibody drugs at different pH values
MRE spectra of a) Herceptin and b) RIABNI. FL spectra of c) Herceptin and d) RIABNI
MRE spectra were converted from raw data using amino acid sequence and absorbance at 214 nm, which was simultaneously measured with CD. FL spectra were normalized by the area of each spectrum.
Figure 2 and 3 show the SSE result of antibody drugs calculated by Spectra Manager 2.5 BeStSel CFR. Results of SSE showed that both Herceptin and RIABNI retained their secondary structure down to pH 3, but the ratio of Helix, β-strand, and Others changed significantly at pH 2.
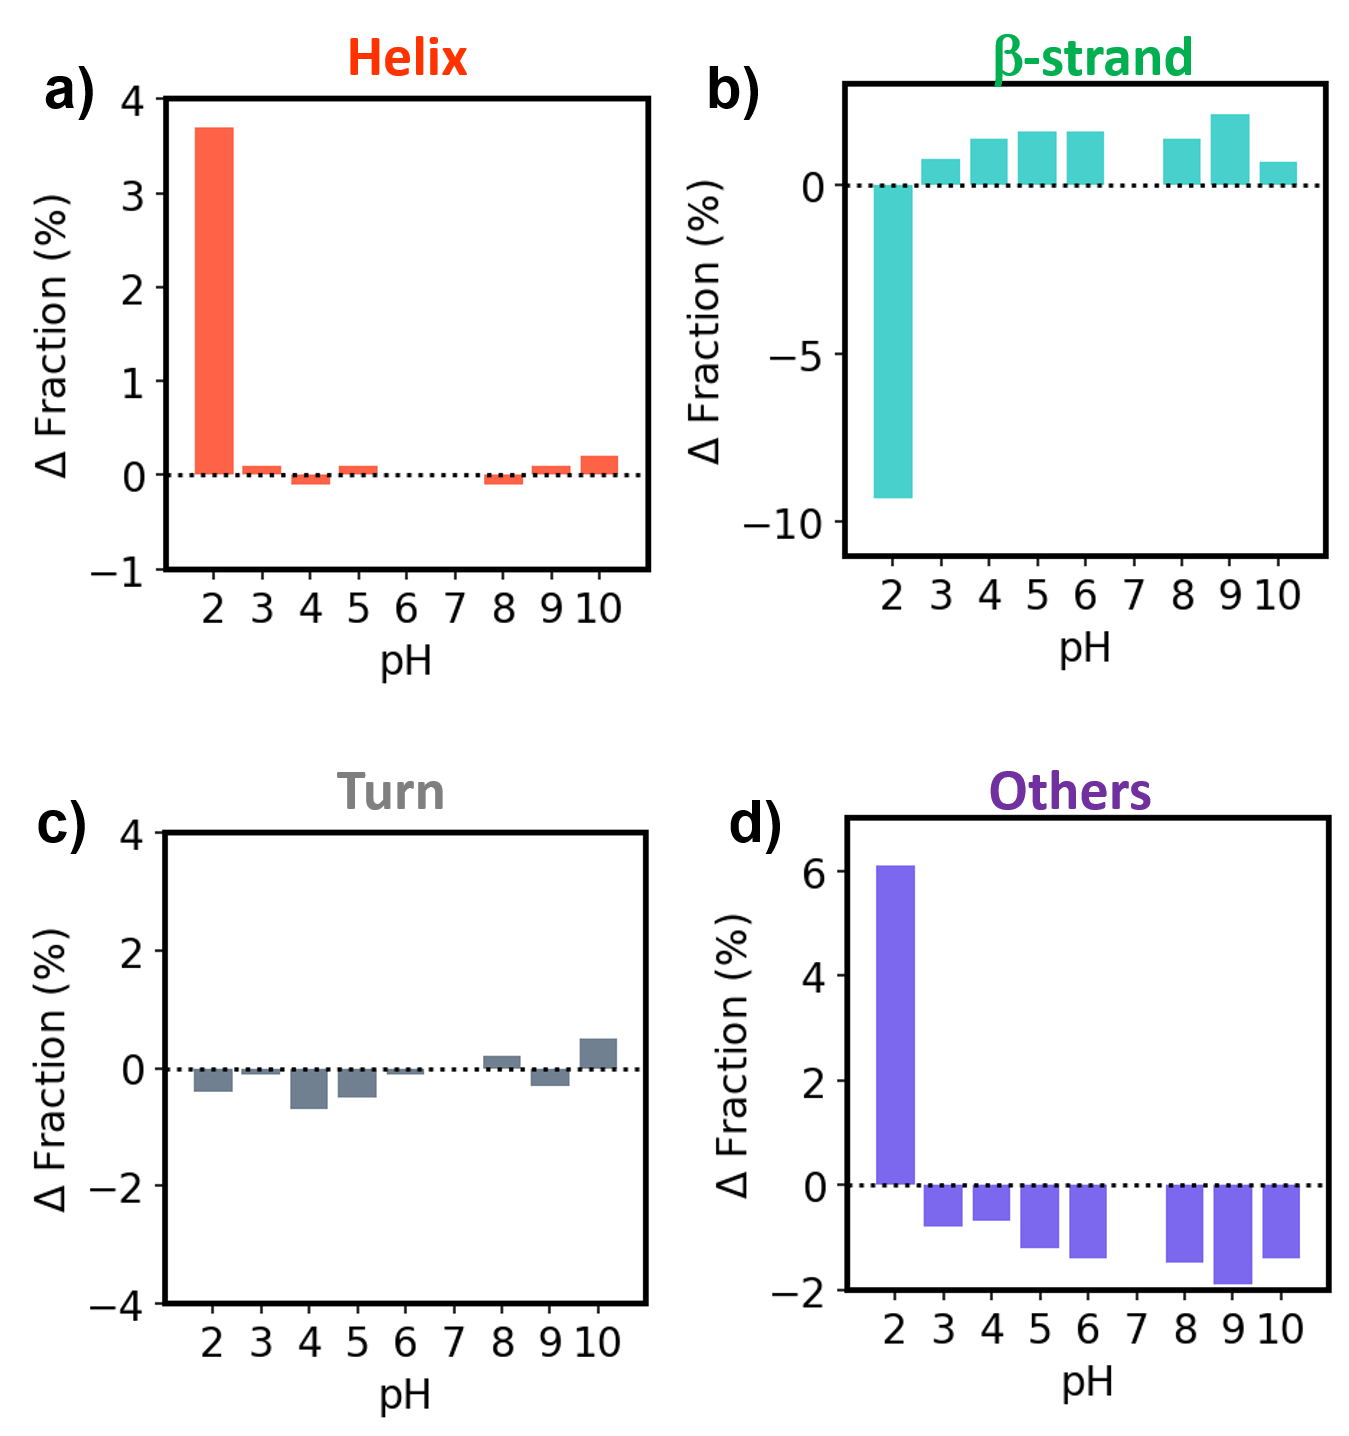
Figure 2. SSE results for Herceptin
Δ Fraction for a) Helix , b) β-strand, c) Turn and d) Others. Each bar represents the difference from the fraction at pH 7.
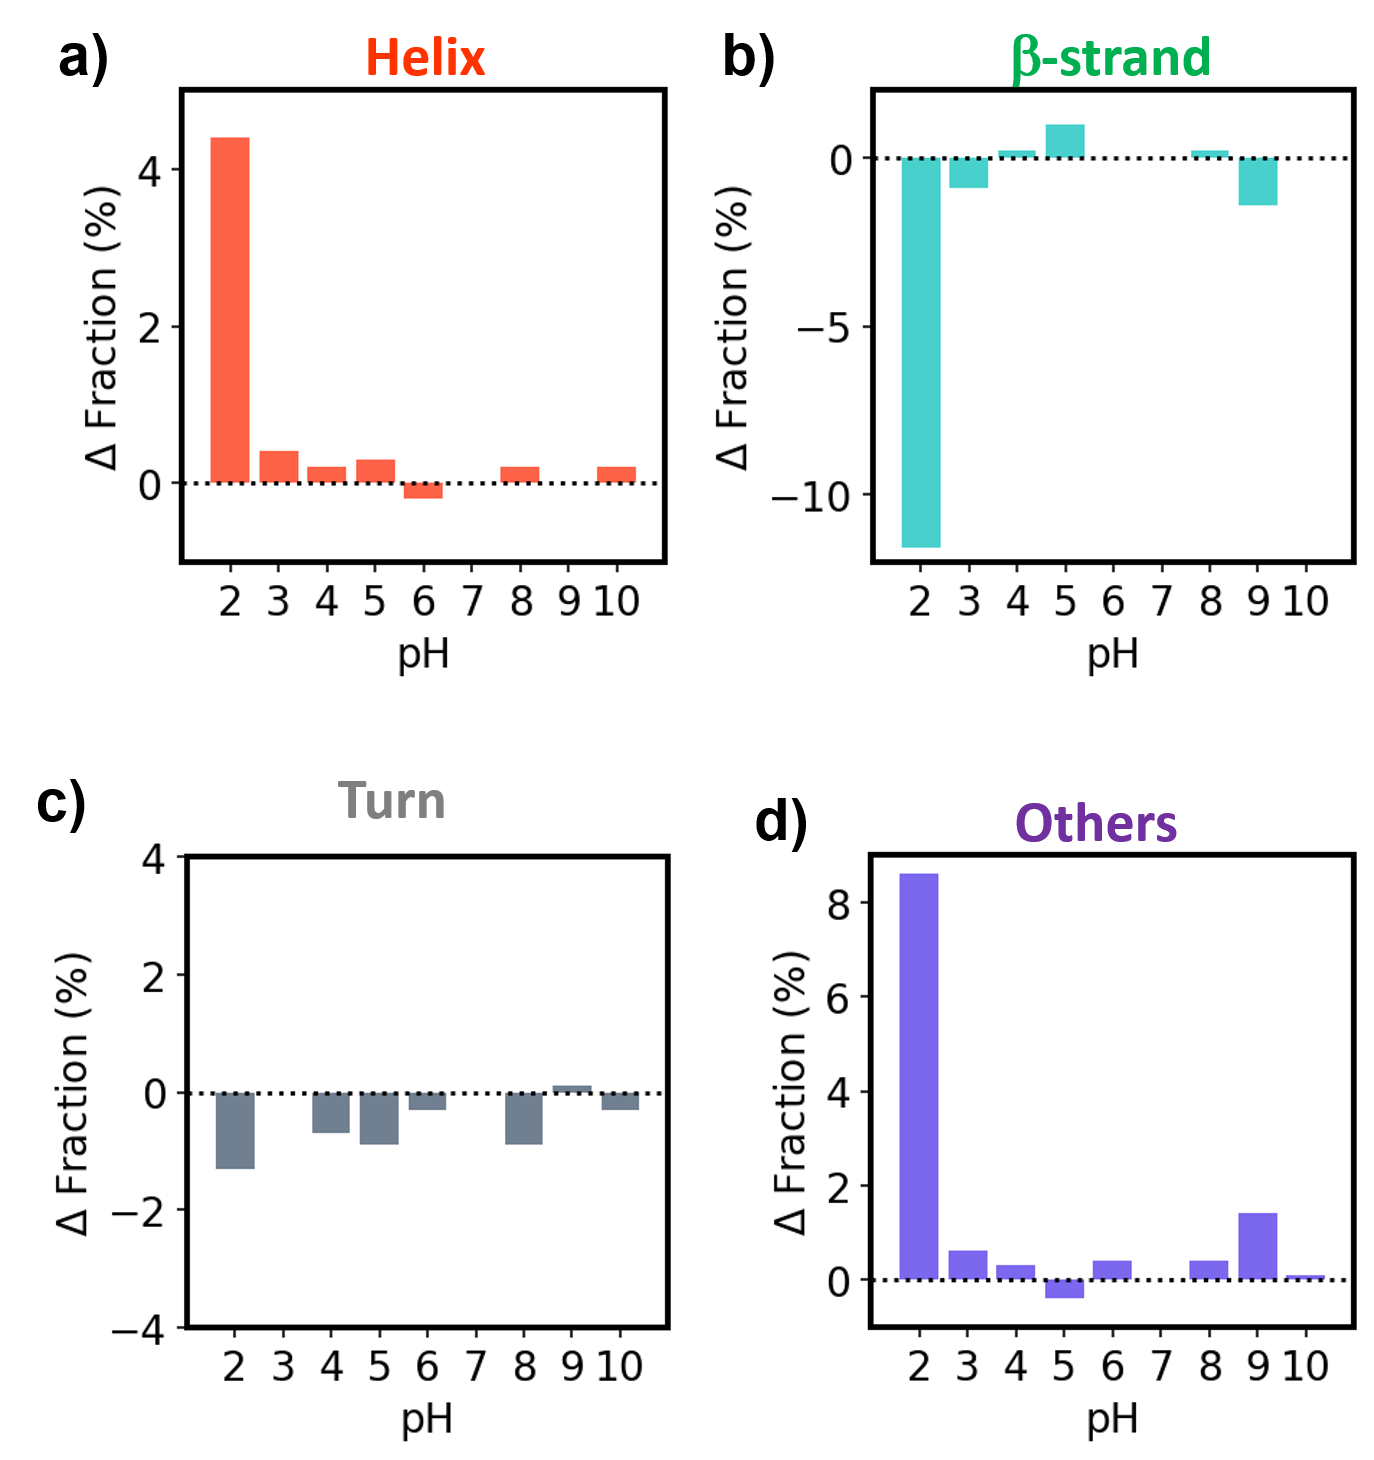
Figure 3. SSE results for RIABNI
Δ Fraction for a) Helix , b) β-strand, c) Turn and d) Others. Each bar represents the difference from the fraction at pH 7.
Figure 4 shows the evaluation result of tertiary structure change for each antibody drug by using Barycentric mean (BCM). Evaluation of peak shifts from FL spectra, which provide information on tertiary structure, showed that both Herceptin and RIABNI show a gradual change at pH 10-3 and a significant shift at pH 2.

Figure 4. Tertiary structure change for each antibody drug.
BCM for Herceptin (red) and RIABNI (blue).
Conclusion
– HTCD Plus is suitable for continuous CD/Abs/FL scanning for a large number of specimens.
– Spectra Manager 2.5 BeStSel CFR offers a GxP compliant environment that satisfies CSV and ER/ES guidelines, and DI in compliance with ALCOA+ principles.
– Both Herceptin and RIABNI showed a significant change in secondary and tertiary structures at pH 2.
References
Poster Session at 23rd Annual Meeting of the Protein Science Society of Japan (PSSJ2023, July 5 – 7, 2023, in Nagoya, Japan)
Satoko Suzuki1, Taiji Oyama1, Ai Yamane1, András Micsonai2, József Kardos2, Ken-ichi Akao1
1JASCO Corporation, Hachioji, Tokyo 192-8537, Japan, 2ELTE NAP Neuroimmunology Research Group, Department of Biochemistry, Institute of Biology, ELTE Eötvös Loránd University, Budapest H-1117, Hungary
1) Ama, D., Hasegawa, J., Uchiyama, S. & Fukui, K. (2010). Netsu sokutei (Japan), 38, 9-15.
2) Wallace B.A. (2019). Curr. Opin. Struct. Biol., 58, 191–196.
3) Micsonai, A., Wien, F., Kernya, L., Lee, Y.H., Goto, Y., Réfrégiers, M. & Kardos, J. (2015). Proc. Natl. Acad. Sci. U.S.A., 112, E3095–E3103.
4) Micsonai, A., Wien, F., Bulyáki, É., Kun, J., Moussong, É., Lee, Y.H., Goto, Y., Réfrégiers, M. & Kardos, J. (2018). Nucleic Acids Res., 46, W315-W322.
5) Micsonai, A., Bulyáki, É. & Kardos, J. (2021). Methods in Molecular Biology (Clifton, N.J.), 2199, 175–189.
6) Micsonai, A., Moussong, É., Lee, Y.H., Murvai, N., Tantos, Á., Tőke, O., Réfrégiers, M., Wien, F. & Kardos, J. (2022). Front. Mol. Biosci., 9.
7) Micsonai, A., Moussong, É., Wien, F., Boros, E., Vadászi, H., Murvai, N., Lee, Y.H., Molnár, T., Réfrégiers, M., Goto, Y., Tantos, Á. & Kardos, J. (2022). Nucleic Acids Res., 50, W90-W98.


