Introduction
Antibody therapeutics have been dramatically expanding their market over the past decades and have become major biotherapeutic proteins. Circular dichroism (CD) and fluorescence spectroscopies are both easy yet sensitive techniques for studying conformational changes in solution-state proteins. CD spectroscopy measures the difference in absorption of left- and right-handed circularly polarized light. In the far-UV region, CD signals are produced by optical absorption by the peptide backbone, and are therefore used to observe changes in protein secondary structure. Notably, CD spectroscopy is used to compare the higher-order structure (HOS) and homogeneity before and after a change in the manufacturing process as specified in ICH Q5E1), and to compare the HOS of innovators and biosimilars as described in FDA2), EMA3) and other guidelines4,5). Intrinsic fluorescence spectroscopy is a complementary technique for studying protein structure. When proteins are exposed to UV light, fluorescence is emitted by their aromatic amino acid residues. The changes in emission intensity and wavelength are affected by the local environment of these residues. Conventionally, CD and fluorescence spectra are obtained using two different instruments. However, when using multiple instruments, the following challenges are raised: a) time and effort for physical transfer of a sample between instruments, and b) possible difference in sample conditions. These are particularly crucial for these two techniques, since they are often employed as screening methods for a large number of candidates. To address these challenges, we developed an automatic measurement system for CD and fluorescence spectra. The system is composed of the J-1500 CD spectrometer combined with the HTCD Plus automatic CD measurement unit, and a fluorescence monochromator. Using this system, we conducted a comprehensive stability evaluation for trastuzumab (Herceptin®) and rituximab (RIABNI™) by changing the urea concentration and pH. We believe that this new system is especially useful for early-stage screening of therapeutic antibody candidates.
Experimental
Materials
Herceptin® 150 mg (trastuzumab, Roche)
RIABNI™ 10 mg/ mL (rituximab, AMGEN)
Instrument
HTCD Plus – high-throughput CD measurement system
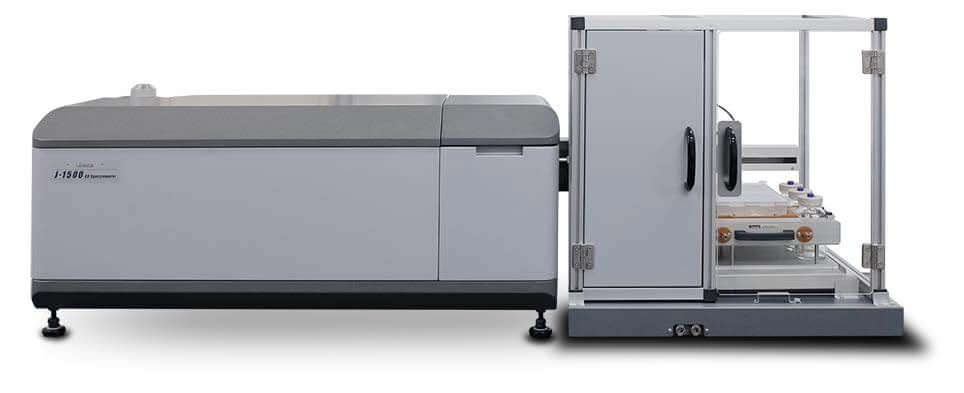
Fig. 1 Image of HTCD Plus system
System features
◼ Automated sample loading, wavelength scanning and flow washing
◼ CD/Abs/Fluorescence measurement
◼ Up to 192 samples can be loaded
◼ Small sample volume (to 100 µL)
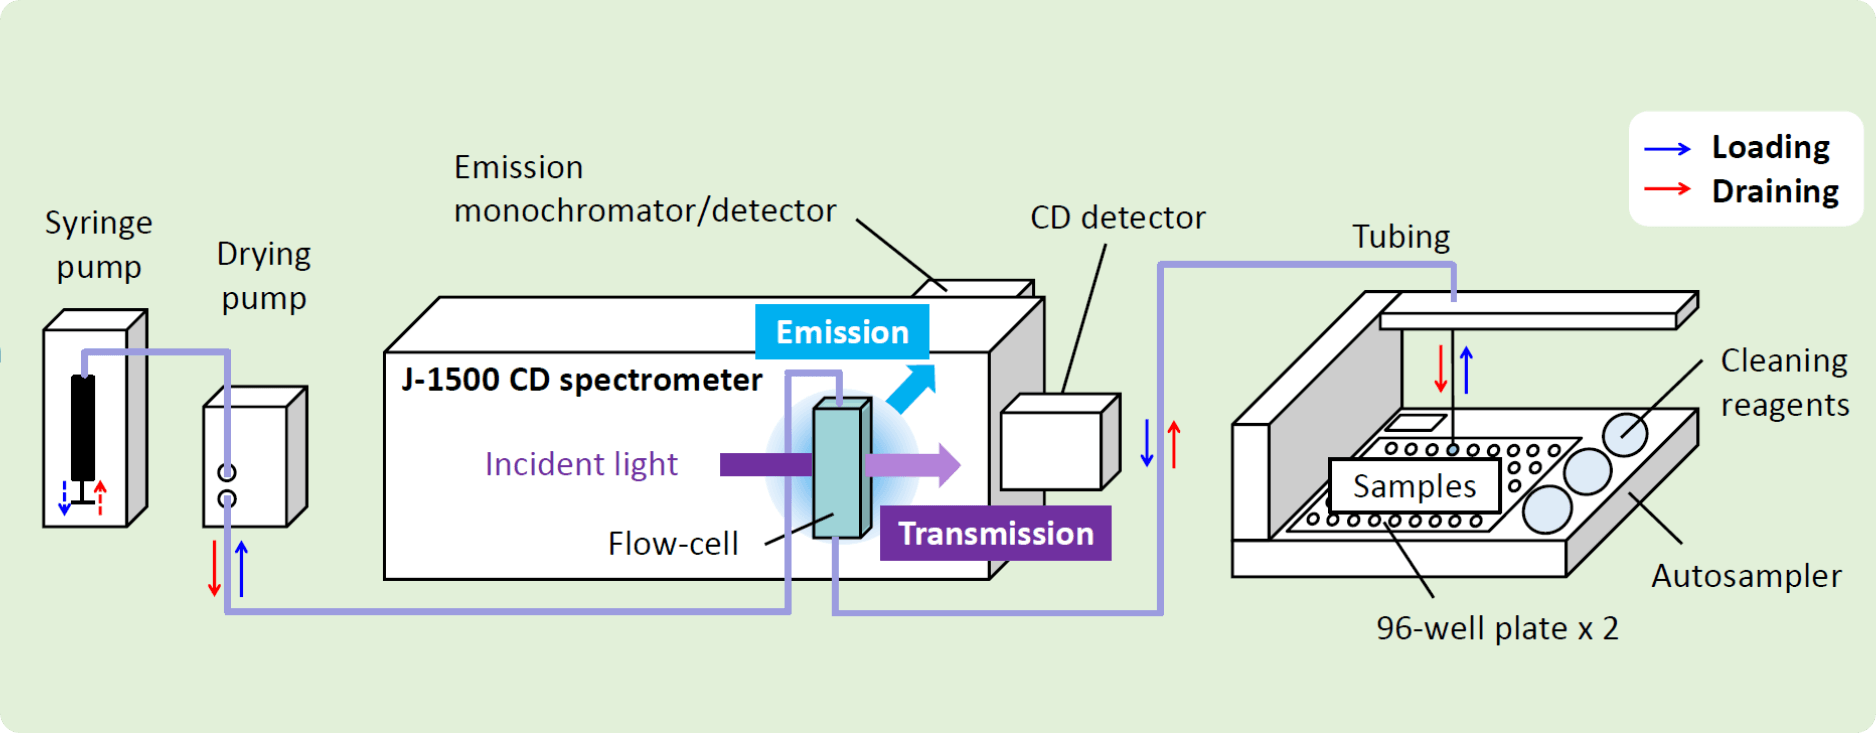
Fig. 2 Schematic diagram of HTCD Plus system
Parameters
• Each sample was loaded four times, with 120 μL of sample used for each measurement. All the spectra were collected at 25 ⁰C.
• Parameters for CD spectrum collection: pathlength = 1 mm; D.I.T. = 2 sec; bandwidth = 1 nm; scan speed = 50 nm/min; averaging over four accumulated scans per sample.
• Parameters for fluorescence spectrum collection: pathlength = 10 mm; D.I.T. = 1 sec; excitation wavelength = 280 nm; data pitch = 1 nm.
• Parameters for flow washing: 1st wash = 1 % Hellmanex® III 250 μL x 1; 2nd wash = ultrapure water 300 μL x 4; 3rd wash = ethanol 300 μL x 2; drying = 60 sec.
Results
Urea concentration
Both Herceptin® and RIABNI™ showed a decrease in CD213nm and an increase in fluorescence intensity as the urea concentration increased. Also, the fluorescence λmax wavelength for the two therapeutic antibodies shifted to longer wavelength as the urea concentration increased.
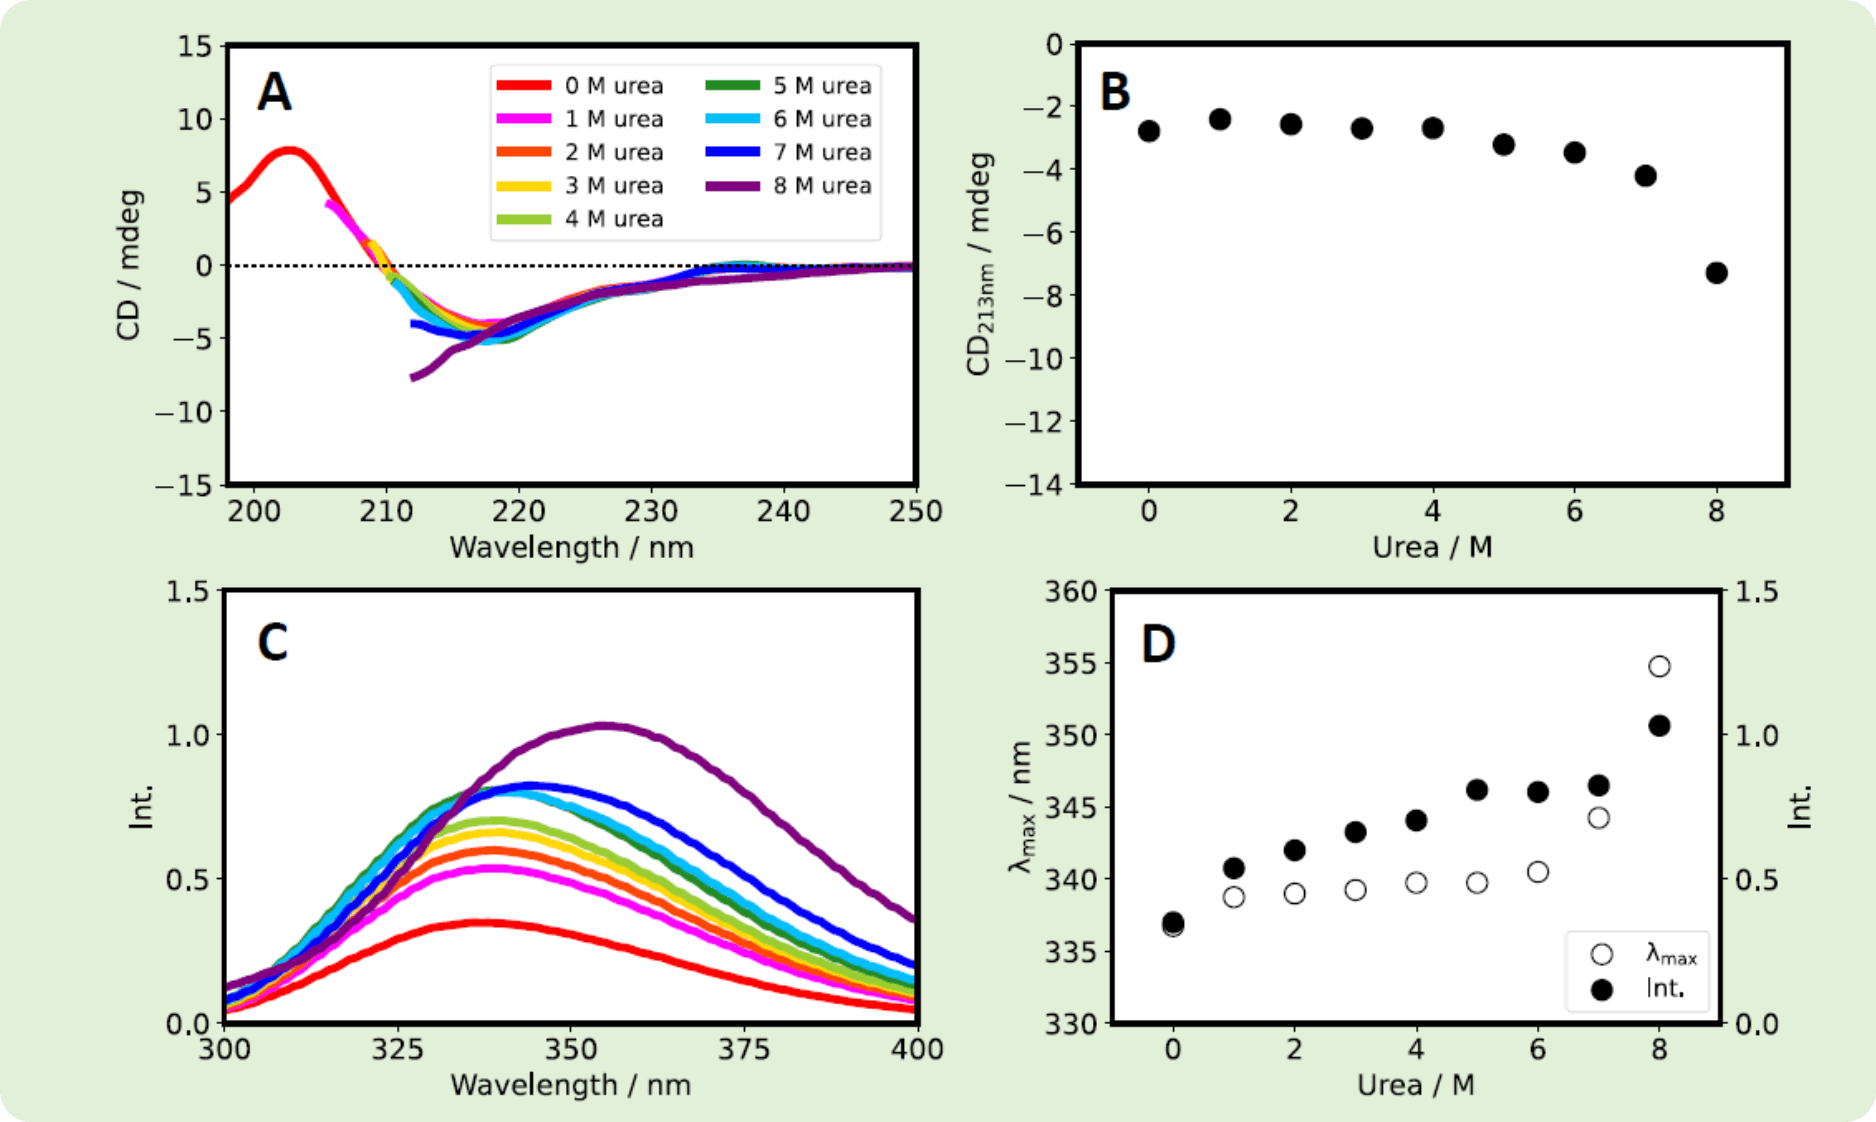
Fig. 3 Herceptin® was dissolved in 1/15 M phosphate buffer (pH 7.0), and was diluted with varying amounts of urea (in the same buffer) to give samples with final Herceptin® and urea concentrations of 0.4 mg/mL and 0-8 M, respectively. (A) CD spectra. (B) CD213nm vs. urea concentration. (C) Fluorescence spectra. (D) λmax (white) and fluorescence intensity (black) vs. urea concentration.
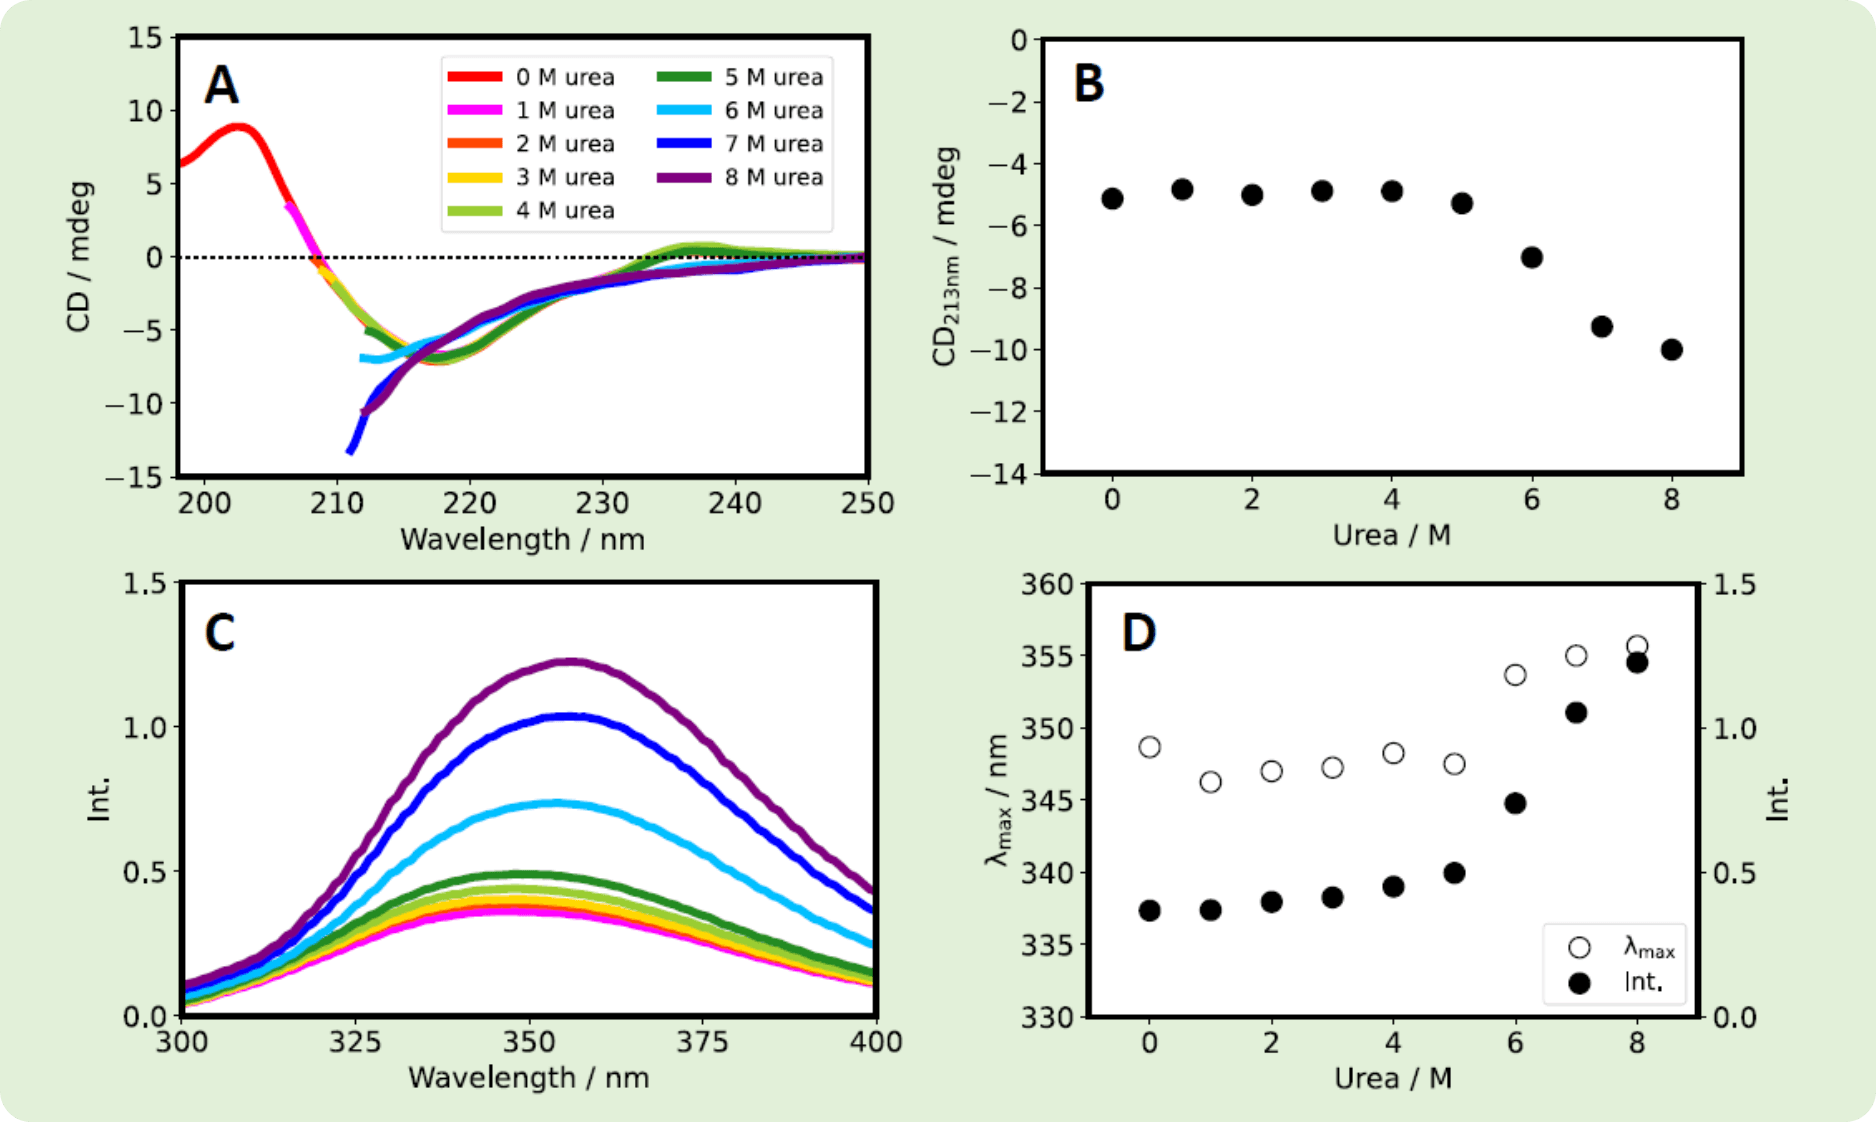
Fig. 4 RIABNI™ (10 mg/mL) was diluted with varying amounts of urea (in 1/15 M phosphate buffer with pH 7.0) to give samples with final RIABNI™ and urea concentrations of 0.2 mg/mL and 0-8 M, respectively. (A) CD spectra. (B) CD213nm vs. urea concentration. (C) Fluorescence spectra. (D) λmax (white) and fluorescence intensity (black) vs. urea concentration.
pH
Both Herceptin® and RIABNI™ showed an increase in CD203nm as the pH increased. However, the fluorescence intensity and λmax showed different behavior for the two antibodies.
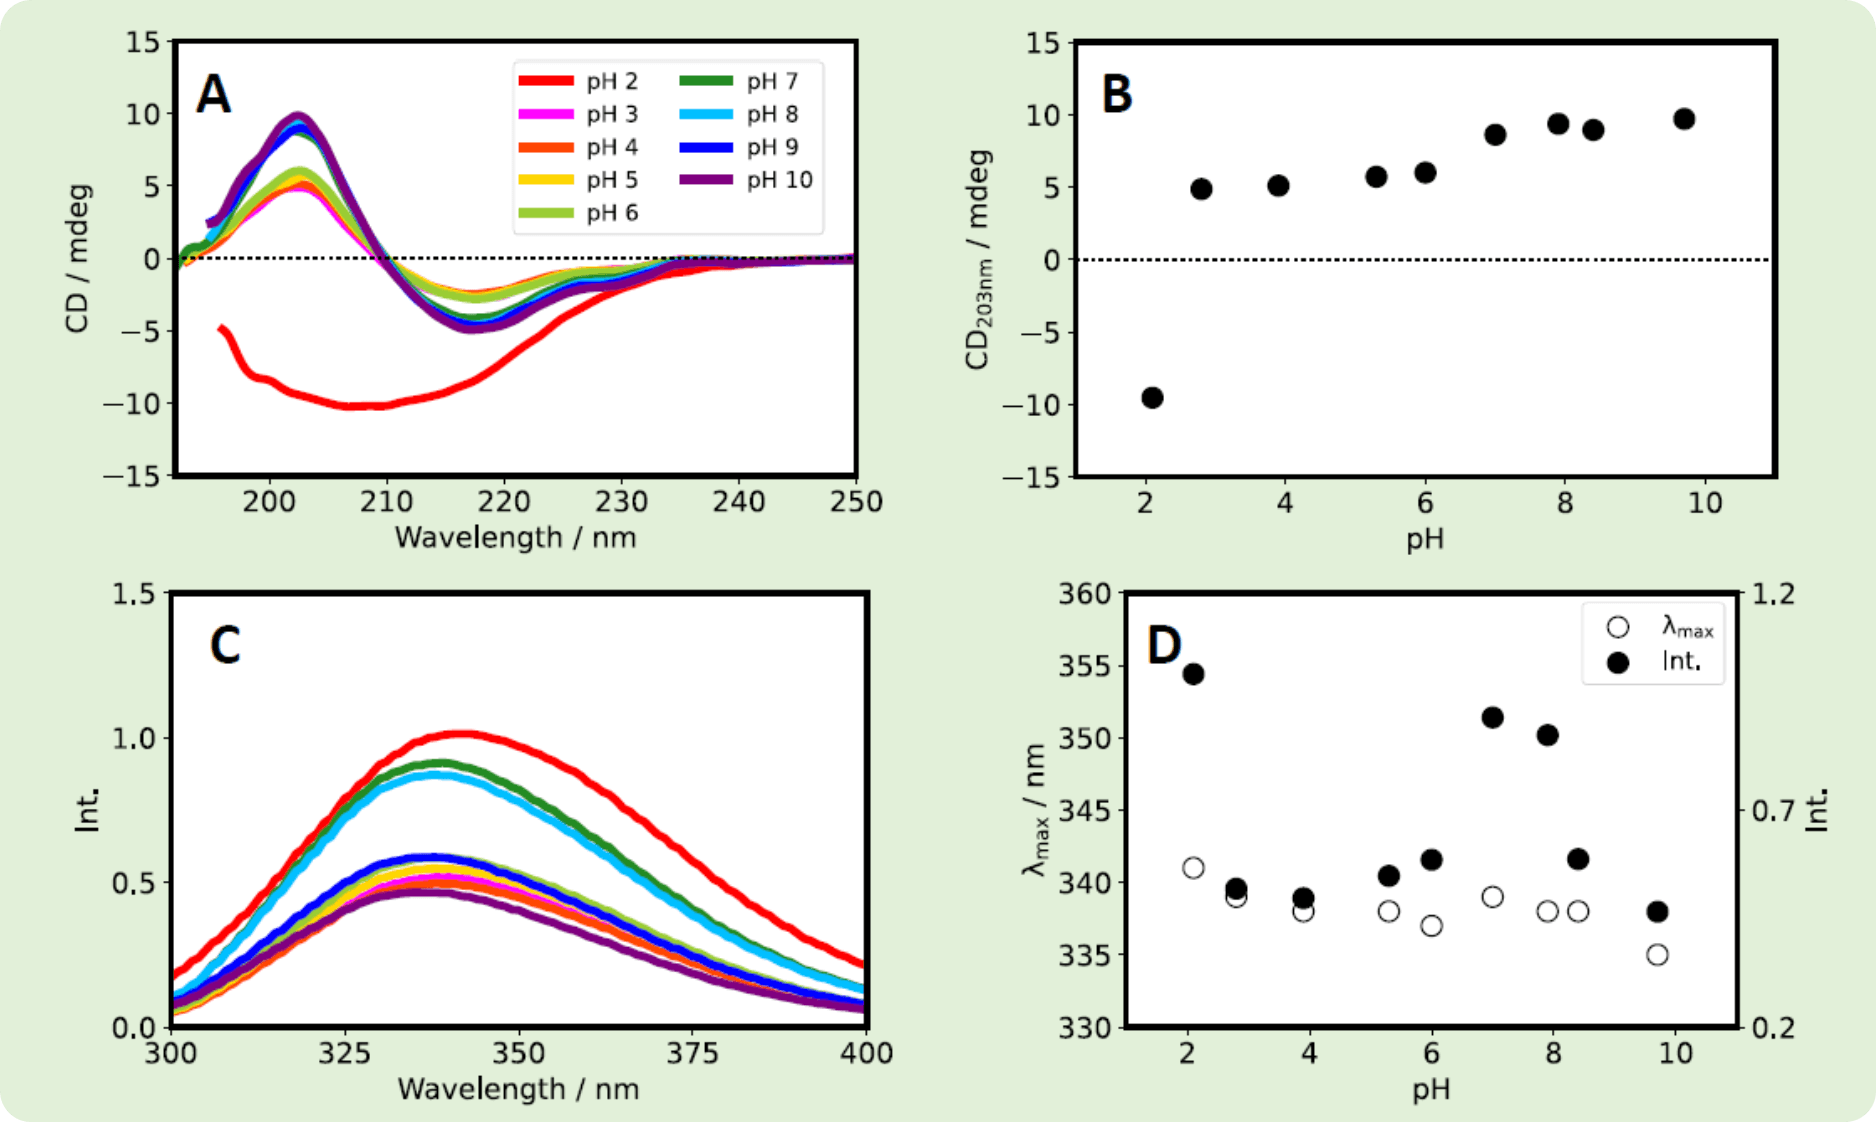
Fig. 5 Herceptin® was dissolved in ultrapure water. After overnight dialysis at room temperature, Herceptin® solution was diluted with a phosphate buffer with a pH of 2-10 to give samples with a final concentration of 0.2 mg/mL. (A) CD spectra. (B) CD203nm vs. pH. (C) Fluorescence spectra. (D) λmax (white) and fluorescence intensity (black) vs. pH.
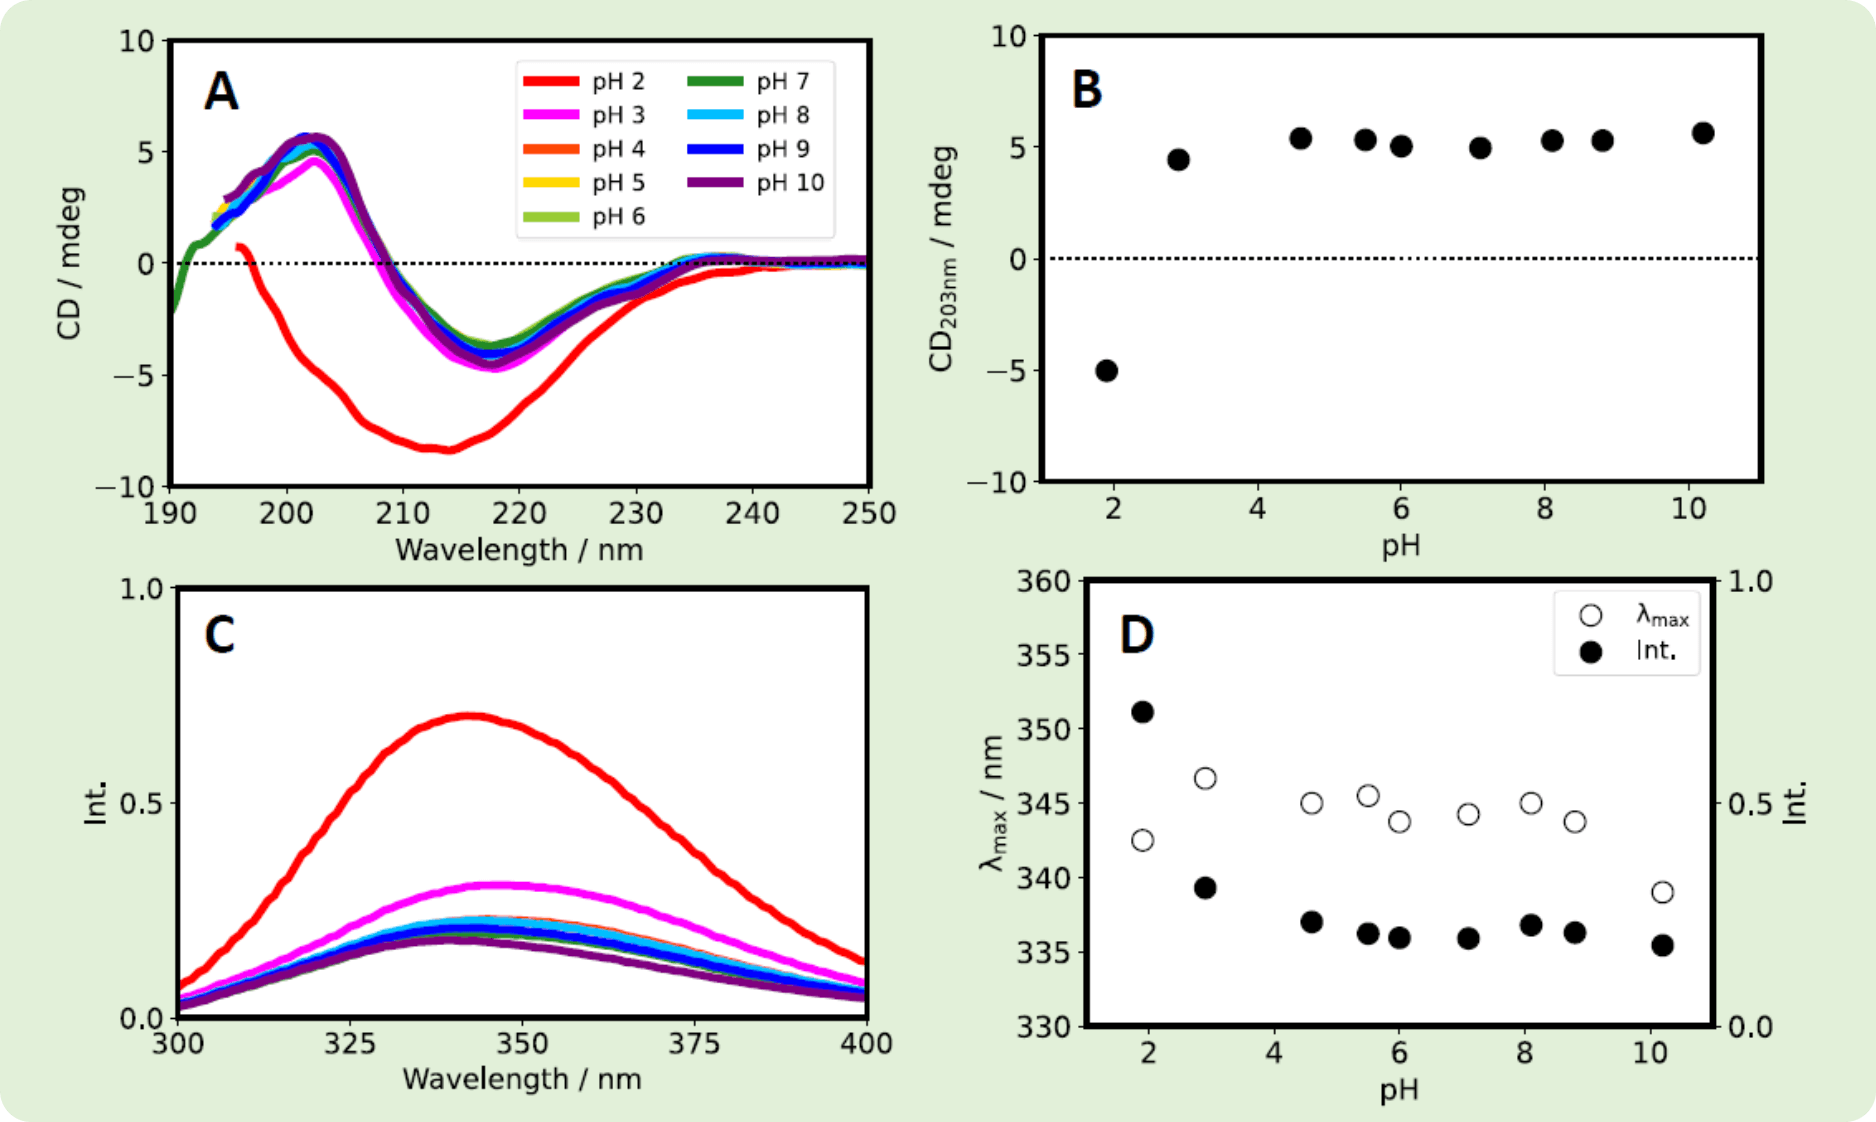
Fig. 6 RIABNI™ (10 mg/mL) was diluted 10-fold with ultrapure water. After overnight dialysis at room temperature, the RIABNI™ solution was diluted with a phosphate buffer with a pH of 2-10 to give samples with a final concentration of 0.2 mg/mL. (A) CD spectra. (B) CD203nm vs. pH. (C) Fluorescence spectra. (D) λmax (white) and fluorescence intensity (black) vs. pH.
Conclusion
• Herceptin® and RIABNI™ showed a similar dependence on urea concentration, but a different dependence on pH.
• The results indicated the high potential of the HTCD Plus for early-stage screening of therapeutic antibody candidates.
References
Poster Session at 67th Biophysical Society Annual Meeting (BPS2023, February 18 – 22, 2023, in San Diego, CA, U.S.A.)
Ai Yamane1, Taiji Oyama1, Akio Kaneta1, Satoko Suzuki1, Forrest Kohl2, and Kenichi Akao1
1JASCO Corporation, Hachioji, Tokyo, Japan, 2JASCO Inc., Easton, MD, USA
1) International Conference on Harmonisation of Technical Requirements for Registration of Pharmaceuticals for Human Use. (2004). ICH Harmonised Tripartite Guideline – Comparability of Biotechnological/Biological Products Subject to Changes in their Manufacturing Process Q5E.
2) U.S. Food and Drug Administration. (2019). Development of Therapeutic Protein Biosimilars: Comparative Analytical Assessment and Other Quality-Related Considerations.
3) European Medicines Agency. (2014). Guideline on similar biological medicinal products containing biotechnology-derived proteins as active substance: quality issues (revision 1).
4) Government of India. (2012). Guideline on Similar Biologics: Regulatory Requirements for Marketing Authorization in India. Department of Biotechnology and Central Drugs Standard Control Organization.
5) China Food and Drug Administration. (2015). Technical guideline for development and evaluation of biosimilars.


 spectrometer")