Introduction
Generally, a sample for CD measurement needs to be a liquid (solution) sample, while recently there has been increasing requirements of CD measurement for hardly soluble sample or the sample whose structure may change in a solution. Such sample has to be measured in the solid state as it is. Although the transmission method can be applied to the CD measurement for such solid samples, there needs sample preparation such as making a pellet and also, if the sample dilution is required, it is not easy to recover the sample. For solving those difficulties in such transmission method, diffuse reflection (DR) CD method has been recommended 1), 2).
DRCD method
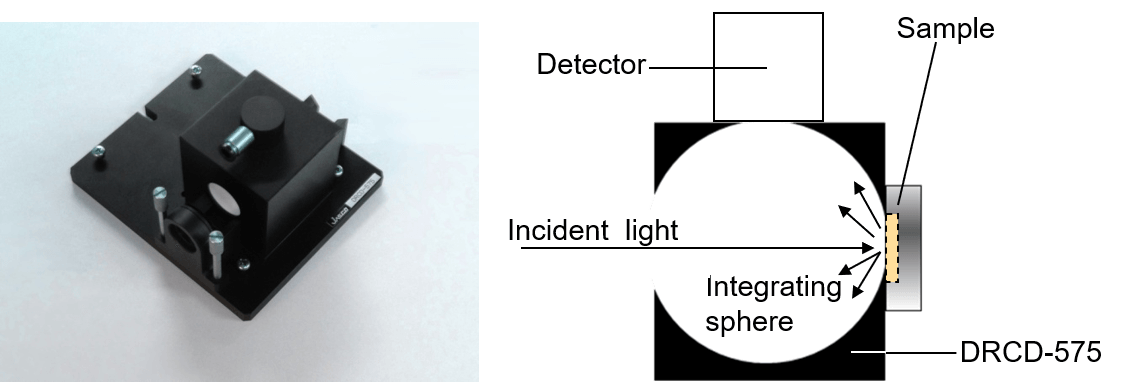
Figure 1. DRCD accessory (left) and optical layout(right)
DRCD is a method, in which the sample powder is located at the measurement point for diffuse reflection in integrating sphere and the CD is measured by utilizing diffuse reflection light (See Figure 1.) and therefore, the DRCD can be effectively applied to the powder sample. However, in CD measurement of such solid sample, the influence of LD (linear dichroism) derived from the optical anisotropy of solid sample may have to be taken into consideration in order to minimize the CD artifact. JASCO CD spectrometer allows the users to estimate the CD artifact easily by an incorporated quad digital lock-in amplifier allowing multi-probe function which enables the simultaneous measurement of CD and LD.
As an example of the DRCD measurement, L- and D-alanine powder were used as sample.
J-1500 CD spectrometer
Experimental
In order to minimize the influence from optical anisotropy, the alanine powder was well ground by using of mortar and then the simultaneous CD and LD measurement was performed by using of multi-probe function.
Measurement parameters
Wavelength range: 300-200 nm
Photometric mode: DRCD, DRLD
CD/LD sensitivity: 10000 mdeg/1.0 delta OD
Data interval: 0.1 nm
Scan speed: 100 nm/min
Spectral bandwidth (SBW): 2 nm
Response: 1 sec
Number of accumulation: 5
Results
The DRCD and DRLD spectra of L- and D-alanine powder are shown in Figure 2. In the CD mode, L- and D-alanine spectra obtained are in the mirror image showing the same intensity of plus and minus sign respectively. In the LD mode, the signal intensity of each L and D spectrum obtained is less than +/- 0.005 delta OD that is low enough. Such results indicate that the influence from optical anisotropy is considered to be in negligible level.
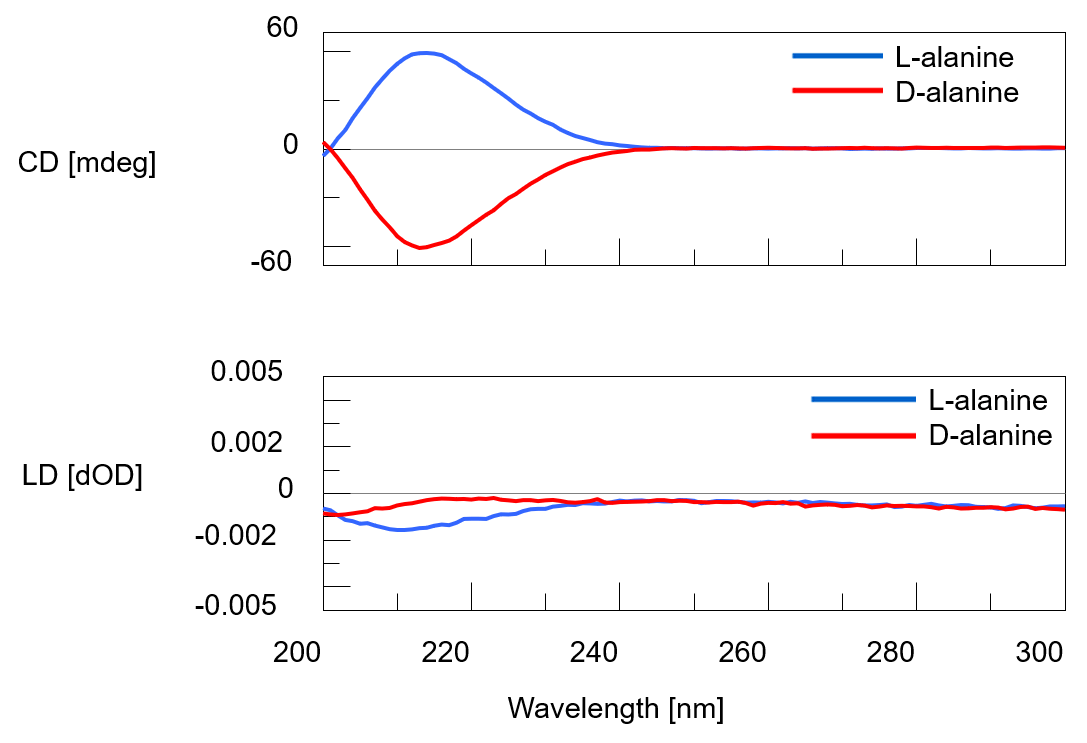
Figure 3. CD and LD spectra of L- and D-alanine (accumulated)
Its result is expected that such powerful measurement technique will be able to expand the application of solid sample CD to the metal complex or super molecule.
References
(1) Ettore Castiglioni and Paolo Albertini, CHIRARITY, 2000, 12, 291-294.
(2) Huibin Qiu, Yoshihira Inoue and Shunai Che, Angew. Chem. Int. Ed. 2009, 48, 3069-3072.


