Introduction
The alcohol concentration is determined by the manufacturing method and processes and is indicated as percent ethanol per 100 mL. Various alcohol drinks can be broadly classified into distilled and fermented liquors. Distilled liquors as whisky, brandy, and shochu, are produced by distilling of fermented liquors, so they generally have a higher alcohol concentration than fermented liquors. On the other hand, the alcohol concentration of fermented liquors such as wine, beer and sake can be varied by the degree of sugar fermentation by yeast. As such, alcohol concentration is an extremely important numeric indicator for both manufacturers and consumers.
It can be easily measured and quantitated by using a Fourier Transform Infrared Spectrometer (FTIR) and an ATR accessory. This measurement method can be applied to both distilled and fermented liquors.
Experimental
A liquid sample was dropped on ATR crystal of ATR PRO ONE inside the sample compartment of FT/IR-4600, and then measured directly. To prevent the decrease of the accuracy due to the vaporization of ethanol, accumulation of the measurement was set at 16 to 32 times, and the measurement time was shortened, so that the measurement conditions were so configured to avoid any possible errors.
Figure 1 shows the spectra of ethanol (0, 20, 40 and 100 %). Each one was measured twice.
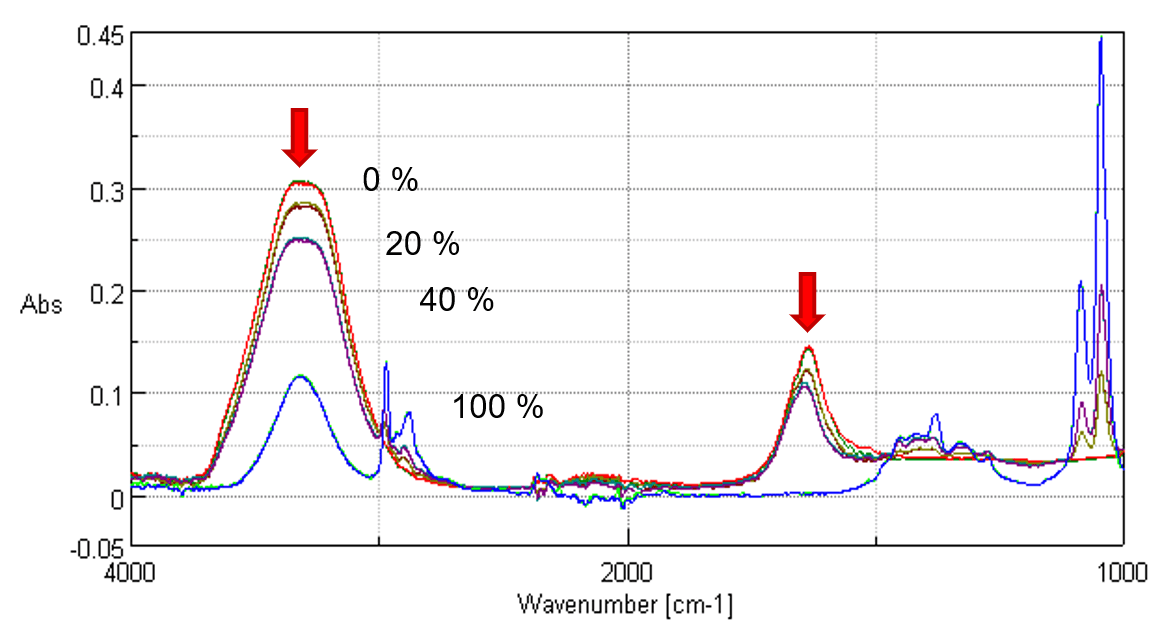
Figure 1. Spectra of Ethanol solution
Measurement parameters
Standard Sample: Ethanol solution (0 ,10, 20, 30, 40, 50, 100 %)
Accumulation : 32
Resolution : 8 cm-1
Apodization: Cosine
ATR crystal: Diamond
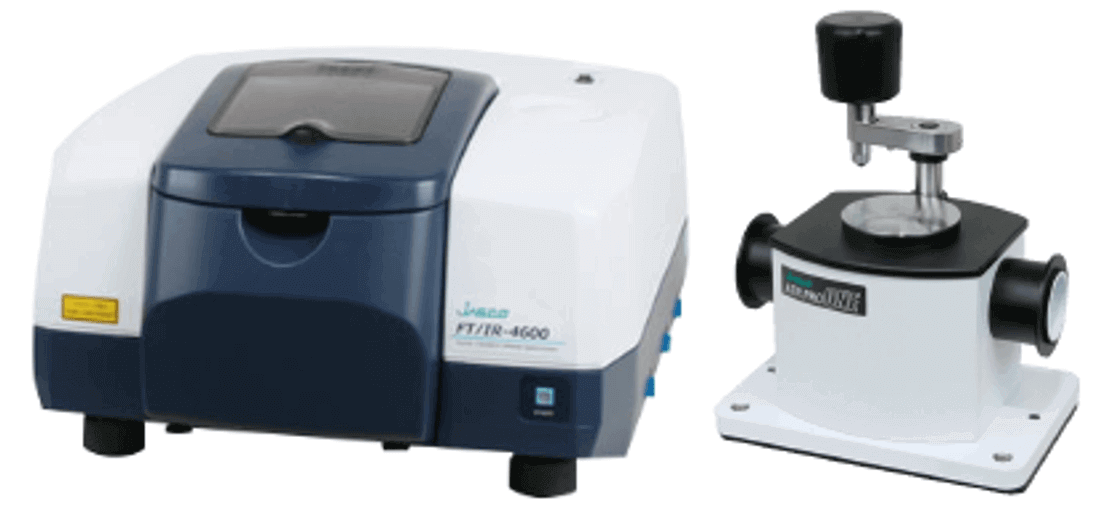
FTIR spectrometer with ATR accessory (FT/IR-4600 + ATR PRO ONE)
Results
Calibration curve
Although it would be possible to create a calibration curve from the peak heights of 3400 cm-1 (OH stretching) and 1650 cm-1 (HOH bending), in this application data, a calibration curve was created using a multivariate analysis technique (PCR) in the specified wavenumber range. The calculation range of 3740 to 3014 cm-1 and 1800 to 933 cm-1 were used, while the first derivative data were utilized as spectral data. Figure 2 shows the calibration model created. This calibration model indicates an extremely good value of correlation coefficient R=0.999.
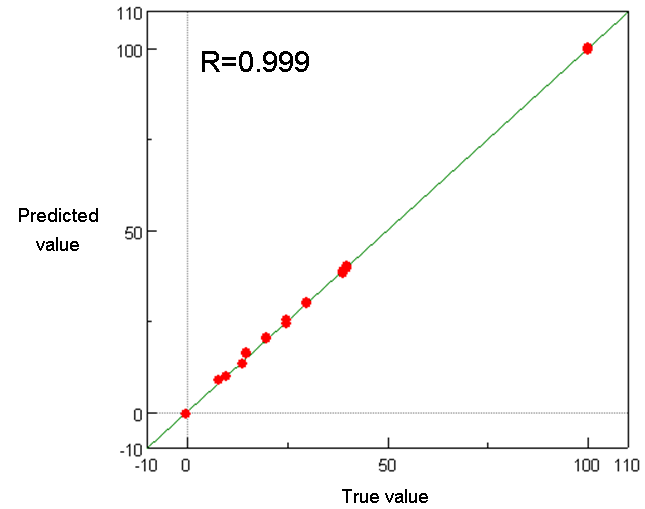
Figure 2 PCR Calibration curve
Table 1 shows the results of quantitation of 17 types of off-the-shelf liquors using the calibration model. For reference, the values listed on their labels are also listed.
Table 1 Results of quantitative measurement
| Liquors | Alcohol concentration on labels | PCR calibration model |
|---|---|---|
| Beer A | 5.0 | 5.1 |
| Beer B | 5.0 | 5.0 |
| Low-malt beer A | 5.5 | 5.6 |
| Low-malt beer B | 5.5 | 5.3 |
| Fruit liquor | 6.0 | 6.0 |
| Whisky and soda | 7.0 | 7.3 |
| Cider | 8.0 | 8.5 |
| Red wine A | 14.0 | 13.4 |
| Red wine B | 14.0 | 12.0 |
| Sake A | 15.0 | 15.8 |
| Sake B | 15.0 | 15.1 |
| Spirits (Sweet potato) | 10.0 | 10.3 |
| Spirits | 25.0 | 25.4 |
| Spirits (Sugarcane) | 25.0 | 22.4 |
| Whisky | 39.0 | 38.5 |
| Brandy | 39.0 | 38.8 |
Figure 3 shows the example of ATR spectra for a number of those liquors.
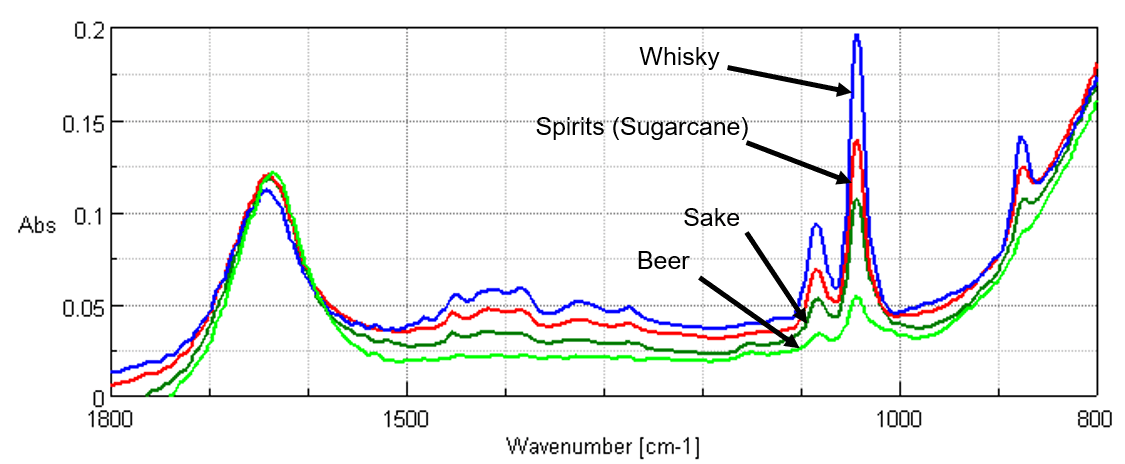
Figure 3. ATR Spectra of Liquors
Related Posts:
 Quantitative Determination of Low-concentration…
 Optical Rotation Measurement for High-concentration…
 Analysis of pollen collected by Durham sampler…
 Base Material and Dye Analysis - Combined Raman and…
 Combined Analysis of Thermochromic Materials -FT-IR…
 Analysis of CBN-Binding DNA Aptamer using CD Spectroscopy") Higher-Order Structure (HOS) Analysis of CBN-Binding…
Higher-Order Structure (HOS) Analysis of CBN-Binding…