Introduction
DNA aptamers, which are single-stranded DNA oligonucleotides, are perceived as promising alternative chemical receptors to antibodies. They bind to specific ligands as a result of folding of tertiary structures. DNA aptamers are generally screened from DNA libraries through SELEX (systematic evolution of ligands by exponential enrichment). Using this method, Yu et al. developed a DNA aptamer for (-)-trans-Δ9-tetrahydrocannabinol (THC) and cannabinol (CBN).1) THC and CBN are two of the more than 100 types of natural chemical components called cannabinoids found in the cannabis plant. CBN is a mildly psychoactive component and is slowly gaining popularity for its potential benefits for sleep and pain management.
Circular dichroism (CD) is an easy yet sensitive technique for studying conformational changes in solution-state oligonucleotides. CD spectroscopy measures the difference in absorption of left- and right-handed circularly polarized light. In the far-UV region, CD signals are produced by optical absorption by the nucleotide backbone, and they are, therefore, used to observe changes in oligonucleotide higher-order structure (HOS). Notably, CD spectroscopy is used to compare the HOS and homogeneity before and after a change in the manufacturing process, as specified in ICH Q5E1.
In this study, structural changes in the CBN-binding DNA aptamer were monitored based on the CD spectrum. The structural changes were evaluated as a function of the ligand CBN, temperature, and other types of cannabinoid, cannabidiol (CBD) and cannabigerol (CBG). For CD spectrum measurement, the J-1500 CD spectrometer combined with the HTCD Plus automatic CD measurement unit was used. This system allows automatic CD spectrum measurement for up to 192 samples in a single run, making it highly suitable for early-stage screening of DNA aptamer candidates.
Experimental
Apparatus
Figure 1 shows the appearance and schematic diagram of the J-1500 CD spectrometer combined with the HTCD Plus automatic CD measurement unit.
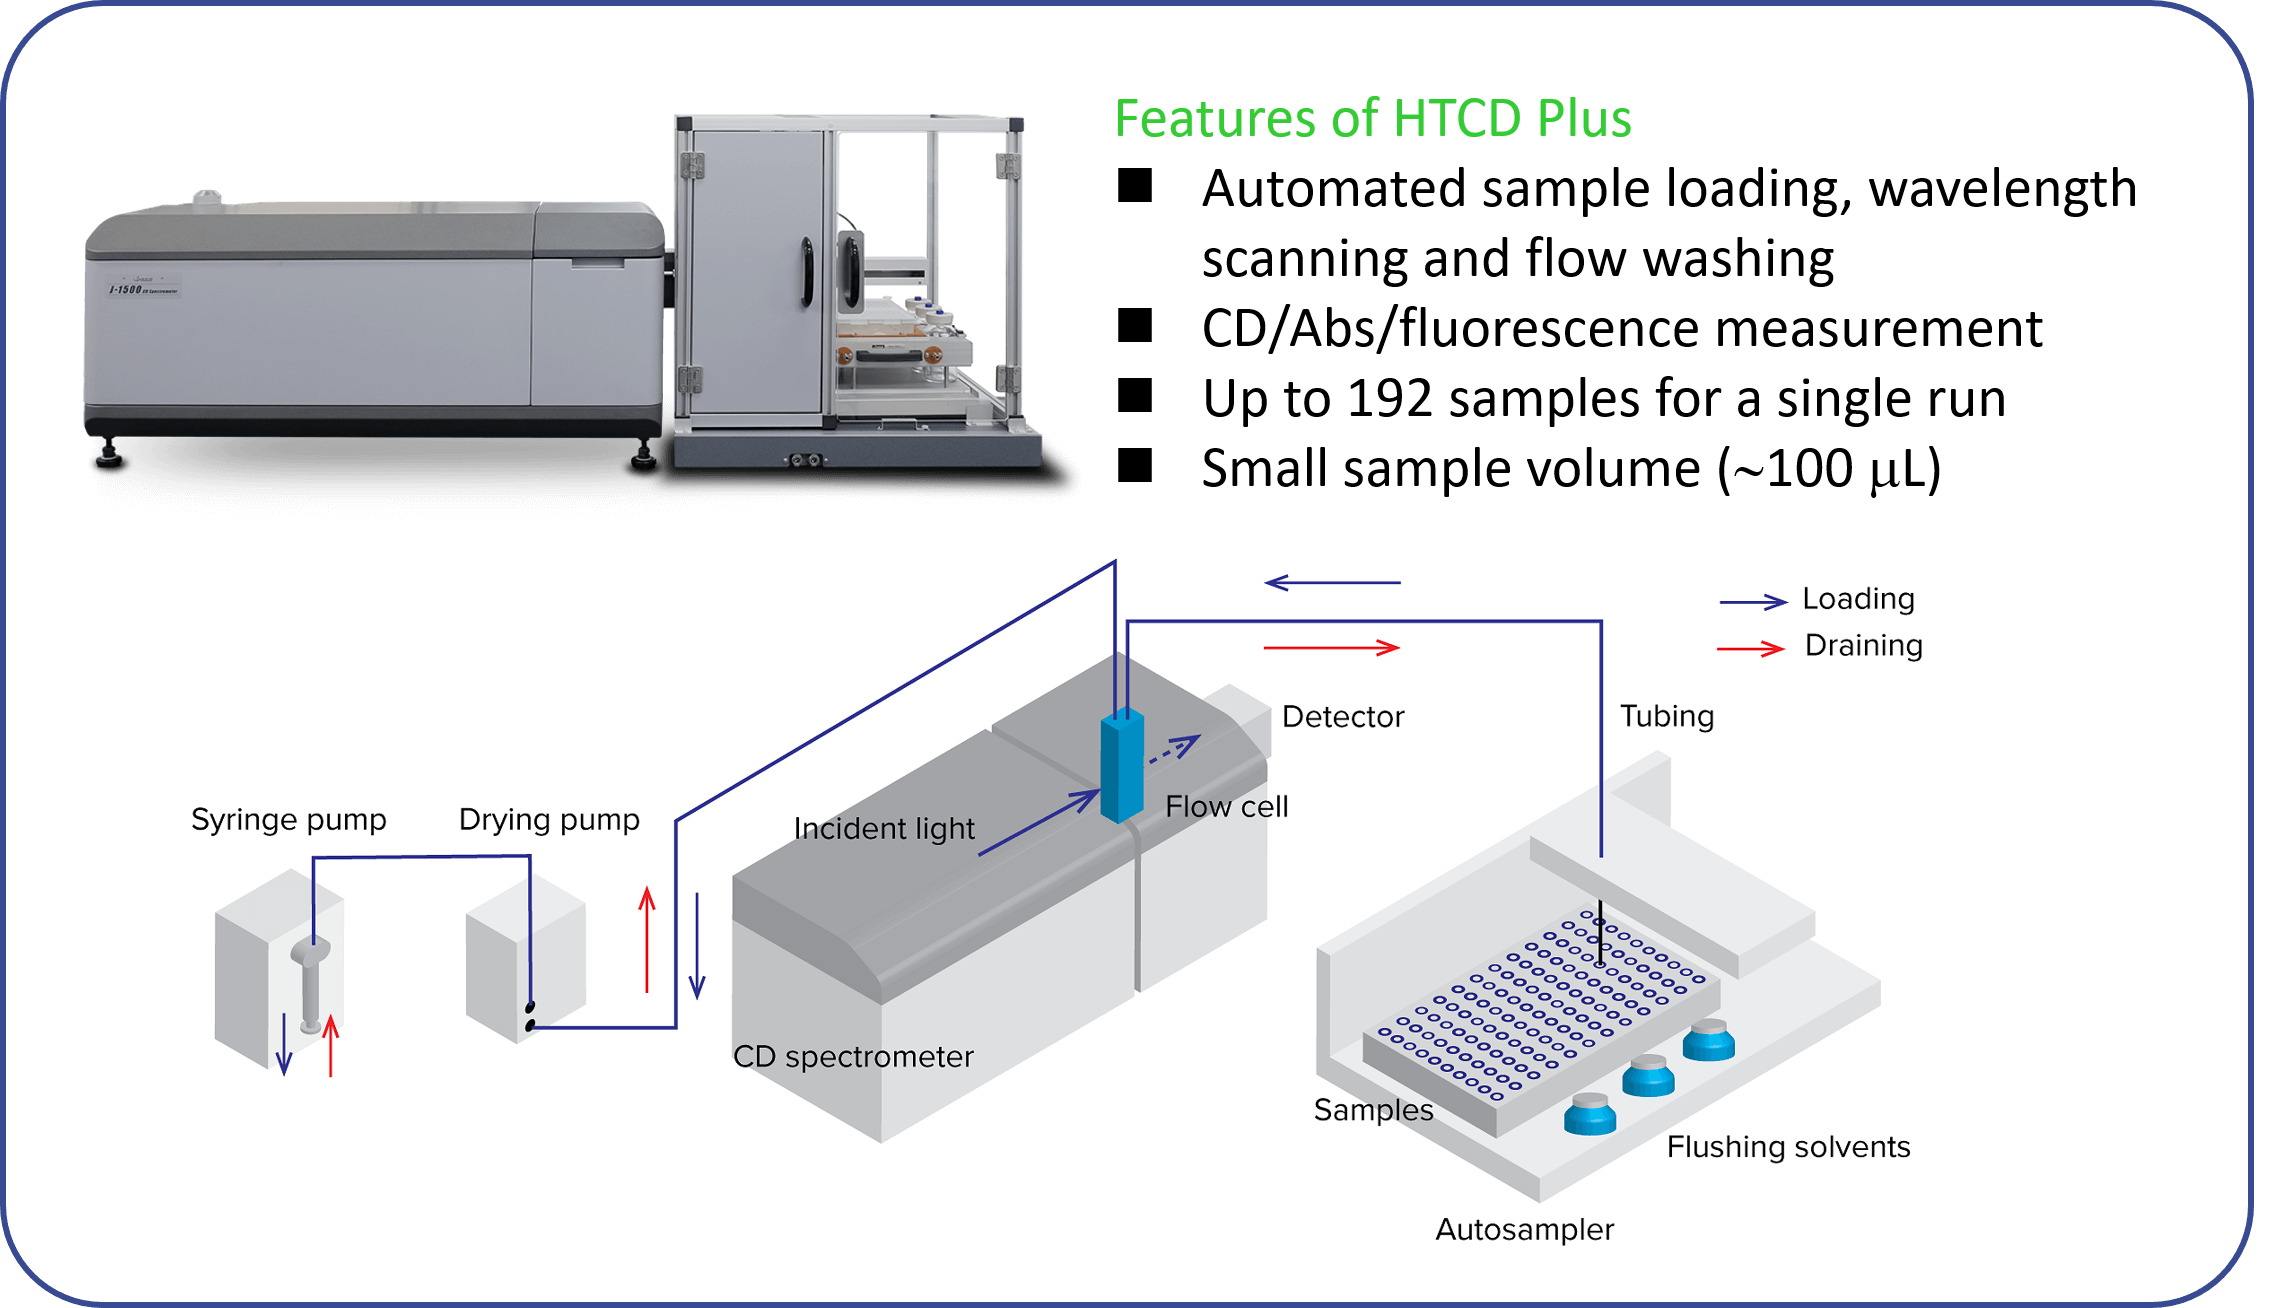
Fig. 1 Automated CD measurement system
CBN-binding DNA aptamer
Figure 2 shows the structure of the CBN-binding DNA aptamer used in this study. The aptamer is a 47-bp DNA strand isolated by Yu et al. using SELEX.1) The aptamer has a very high affinity to THC (Kd: 5.4 µm) and also binds to CBN (Kd: now under progress). It is known to have a structure comprising a mixture of double-stranded DNA and G-quadruplex.1)
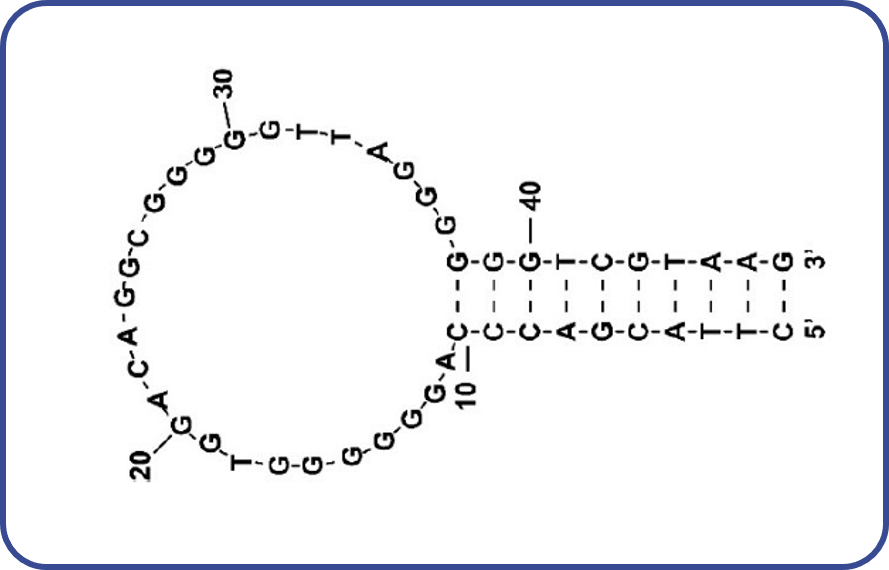
Fig. 2 Structure of CBN-binding DNA aptamer1)
CBN and its derivatives
The structural changes in the DNA aptamer were monitored in reaction to three different types of cannabinoid: CBN, CBD, and CBG (Fig. 3), all of which have an enantiomeric pair. CBN was purchased from Cayman Chemicals, and the others were purchased from Sigma-Aldrich.

Fig. 3 Structure of three cannabinoids
CD measurements
Buffer: 10 mM Tris, 10 mM MgCl2, 20 mM NaCl
Measurement temperature (CBN binding and cross-reactivity): 25 ⁰C
Measurement temperature (thermal denaturation): 30 ⁰C – 90 ⁰C
Sample volume: 120 µL
Flow-cell size: W1 mm x D1 mm (Hellma Corp.)
Loaded no. of each sample: 3
Pathlength: 1 mm
D.I.T.: 2 sec
Bandwidth: 1 nm
Scan speed: 50 nm/min
No. of scans: 4
Flow washing conditions:
1st wash = 1 % Hellmanex® III 250 µL x 1;
2nd wash = ultrapure water 300 µL x 4;
3rd wash = ethanol 300 µL x 2; air drying = 60 sec.
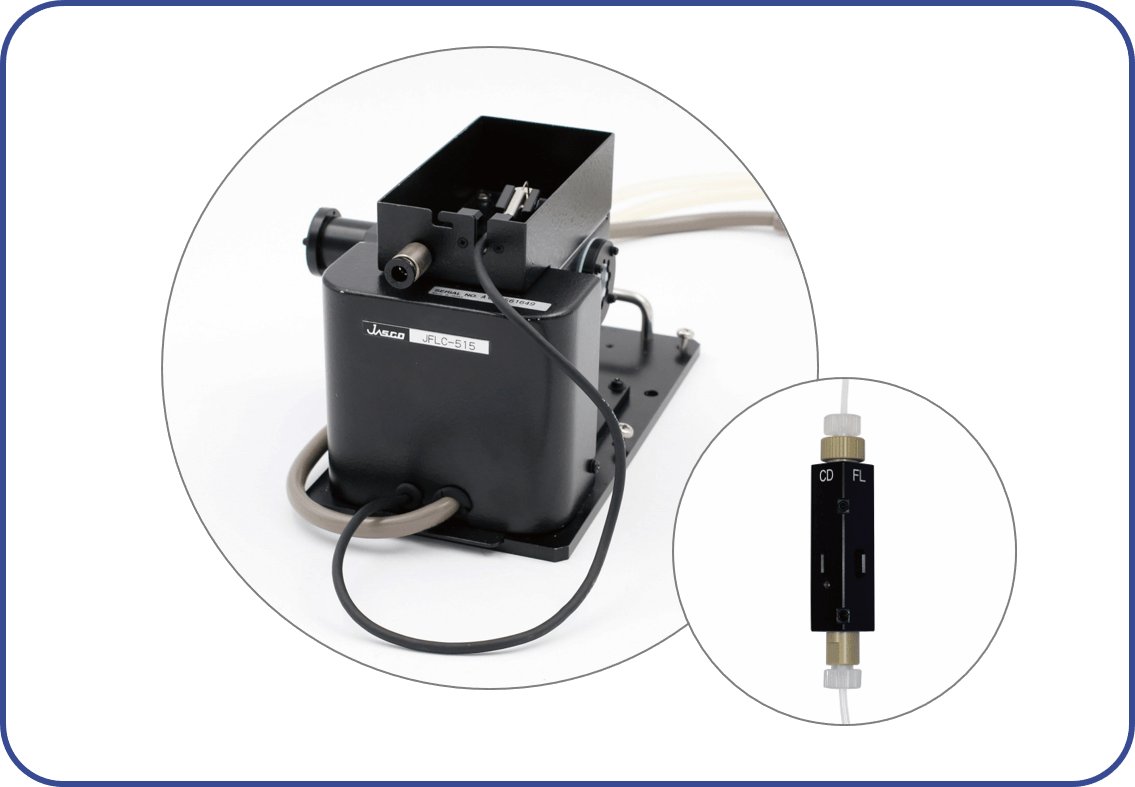
Fig. 4 Flow-cell and flow-cell holder
Results
CD spectra of DNA aptamer with/without CBN
Figure 5 shows CD spectra of the DNA aptamer in the presence or absence of CBN. In the presence of CBN, the aptamer forms the “parallel” structure illustrated in Fig. 6. On the other hand, in the absence of CBD, the aptamer exhibits a different spectral shape. Based on the two peaks at around 260 nm and 290 nm, the aptamer seems to possess a mixed structure between “parallel” and “hybrid” structures.
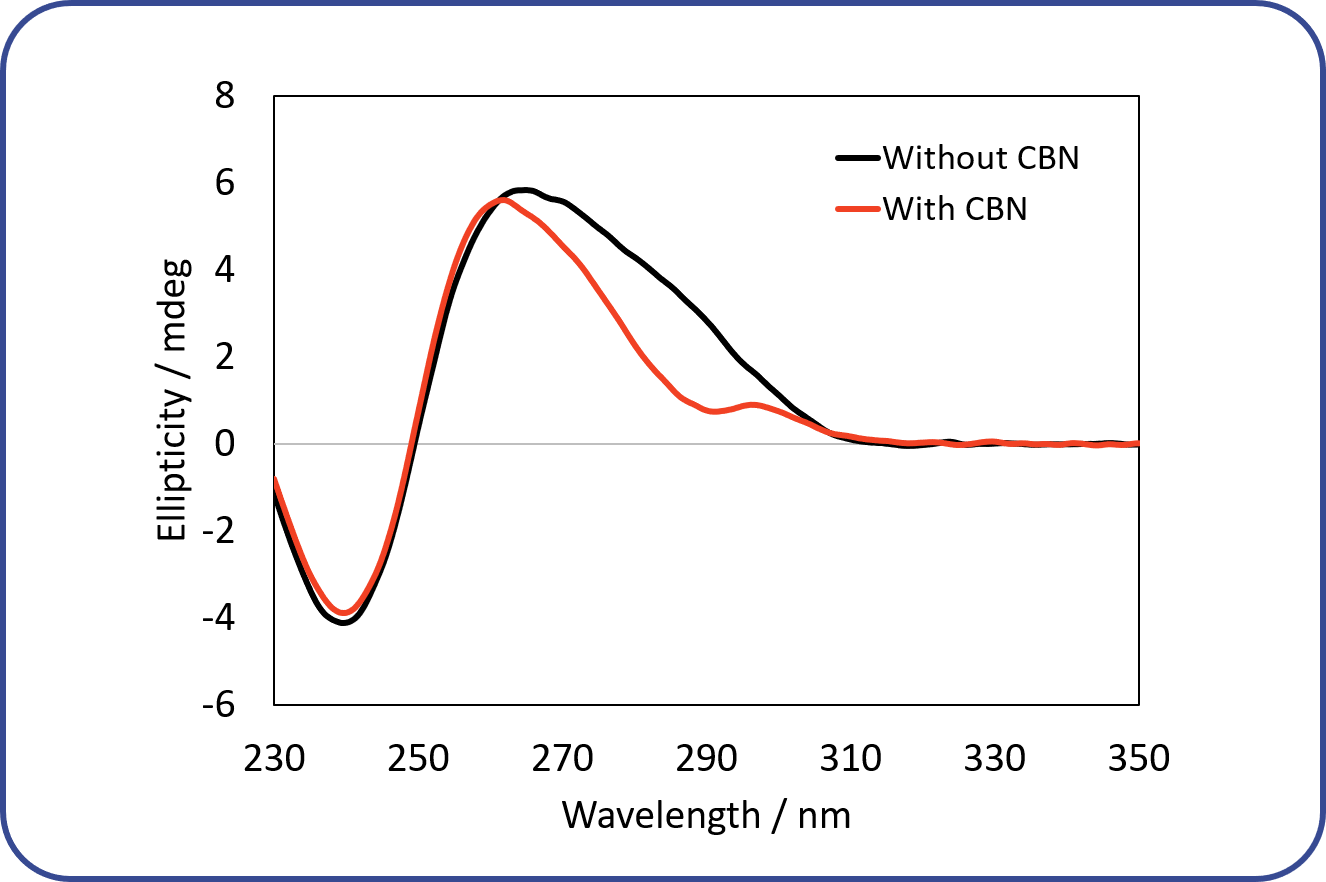
Fig. 5 CD spectra of DNA aptamer
The red line shows the CD spectrum of the aptamer in the presence of CBN, and the black like shows that in the absence of CBN. The concentrations of the aptamer and CBN were 0.2 mg/mL and 17.1 μM, respectively. The spectra were obtained at 25 ⁰C. Each spectrum has been subtracted by its buffer spectrum.
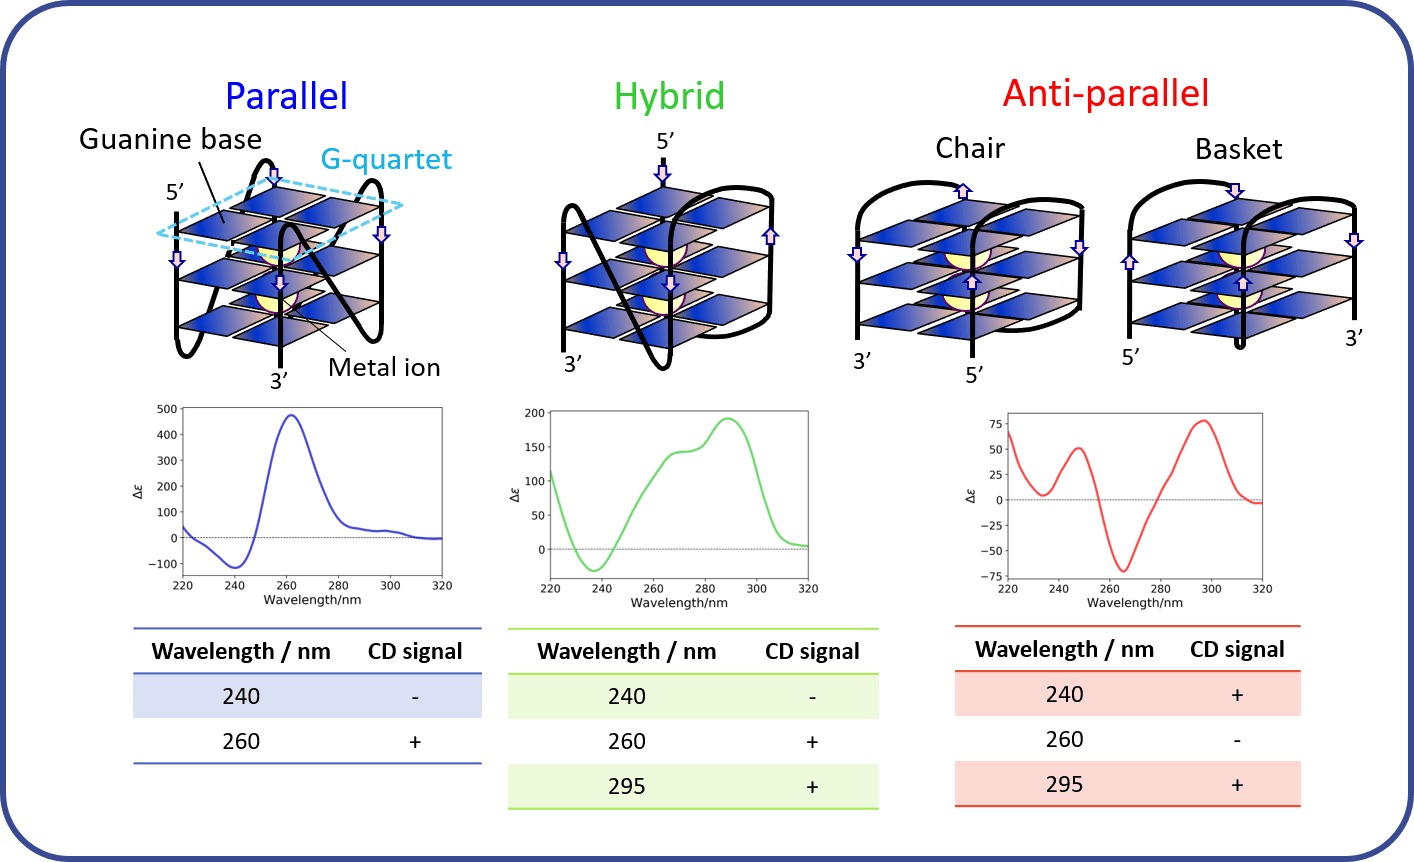
Fig. 6 CD spectra of G-quadruplex aptamer2)
Four guanine bases form a planar structure called a G-quartet, and two or more G-quartets are stacked to form a G-quadruplex (G4) structure. G4 is known to have three types of tertiary structure: parallel, hybrid, and anti-parallel.
Thermal denaturation of DNA aptamer with/without CBN
The thermal stability of the DNA aptamer in the absence or presence of CBN was evaluated. Figure 7(a) shows CD spectra of the aptamer in the presence of CBN. The spectra were obtained from 30 °C to 90 °C. Figure 7(b) shows the denaturation curves for the aptamer with and without CBN. The CD signal at 262 nm is plotted as a function of temperature on the y-axis, and shows the changes in G4 structure. The aptamer bound to CBN showed a lower Tm, indicating lower thermal stability (approx. 10 °C), than the native aptamer.
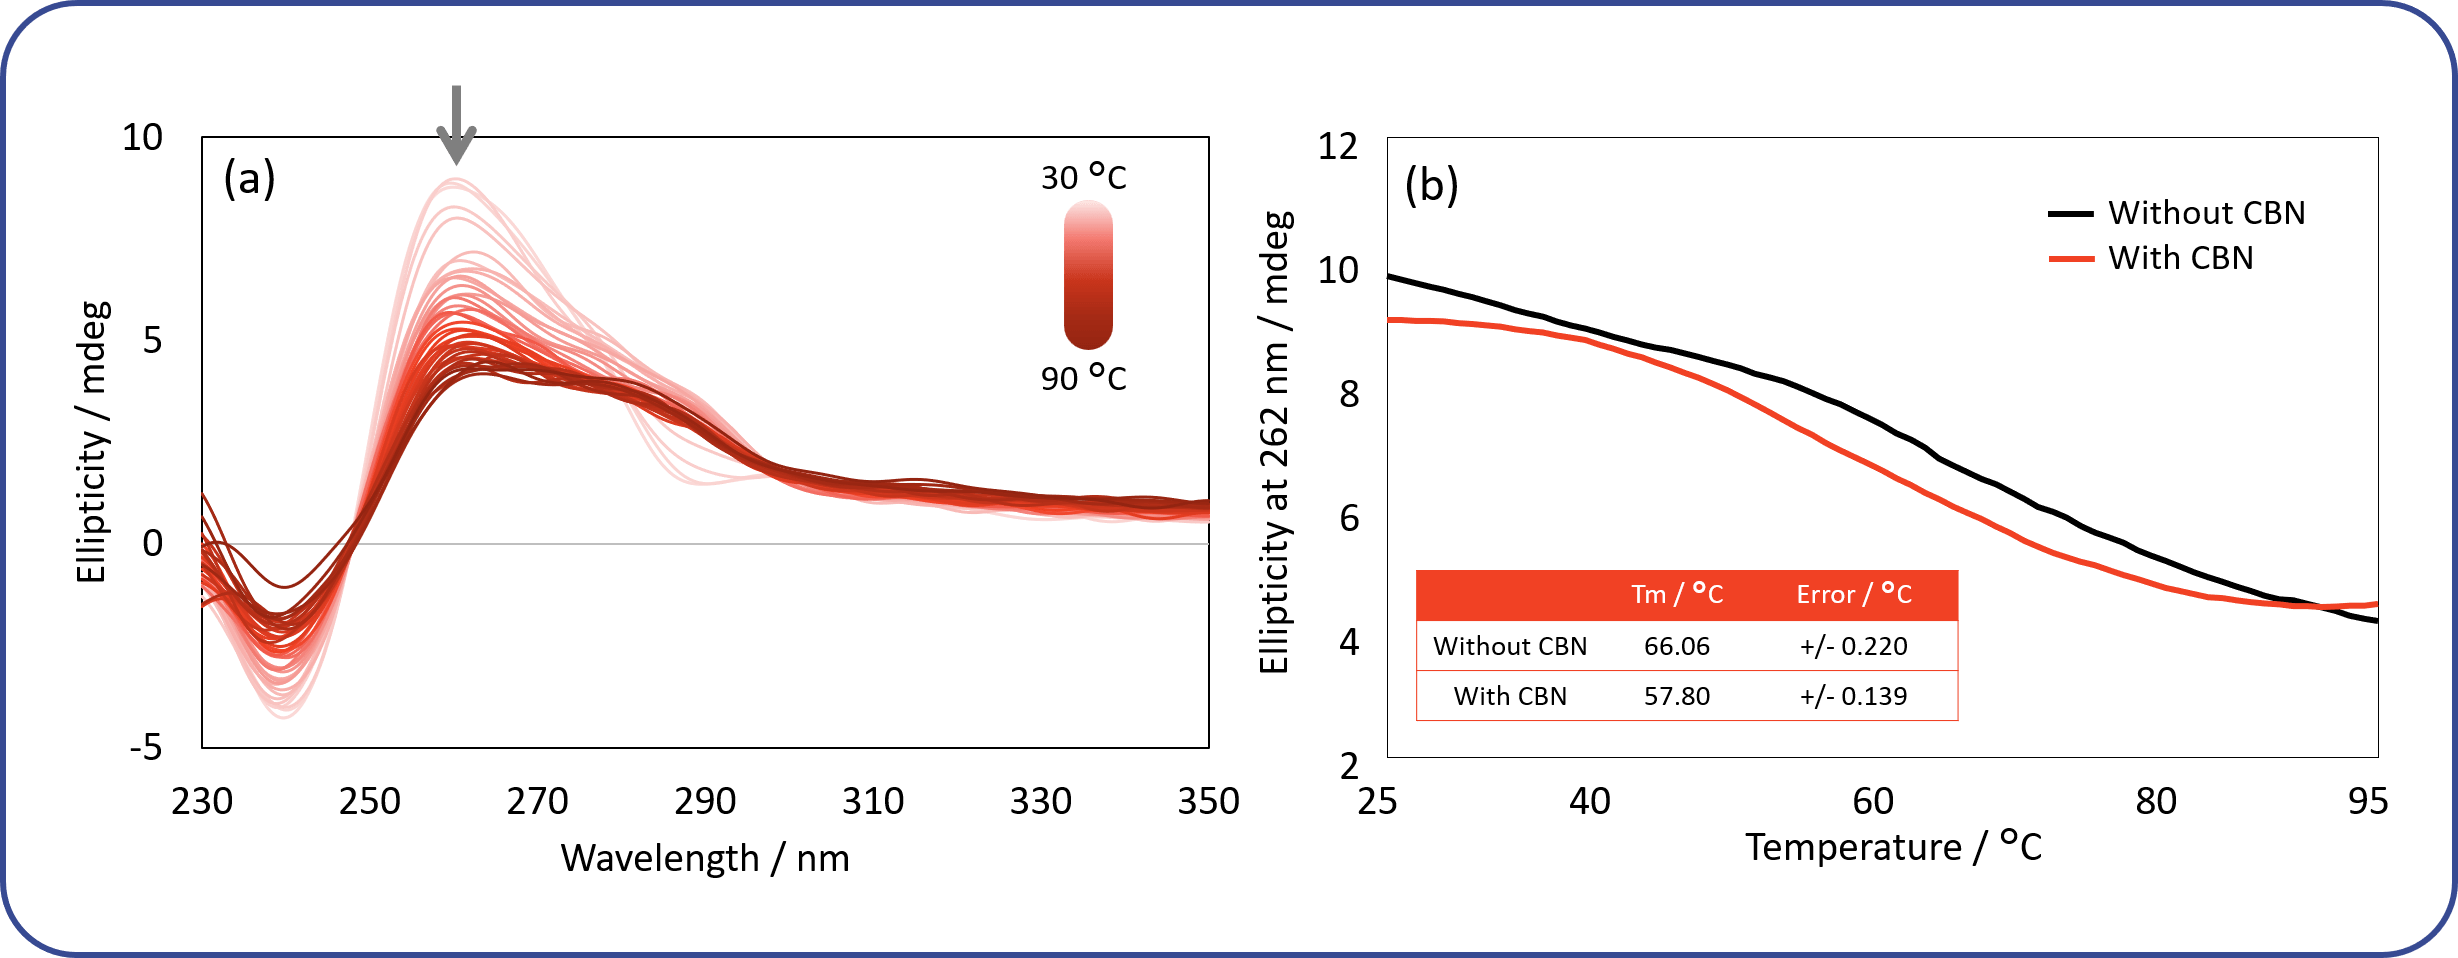
Fig. 7 Change in CD signal of DNA aptamer in response to temperature
(a) CD spectra of DNA aptamer in presence of CBN. The concentrations of the aptamer and CBN were 0.2 mg/mL and 17.1 μM, respectively. The spectra were monitored from 30 °C to 90 °C. (b) Thermal denaturation curves for DNA aptamer. The curves were obtained by plotting the CD signal at 262 nm against temperature. Black and red lines represent curves in the absence and presence of CBN, respectively.
Cross-reactivity of DNA aptamer
The cross-reactivity of the DNA aptamer towards CBN and its derivatives was evaluated by monitoring the CD spectral change. Figure 8(a) shows CD spectra of the DNA aptamer for different CBN concentrations ranging from 0 to 17.1 µM. Figure 8(b) shows the relationship between the ellipticity at 291 nm and the concentration of the ligands. It is seen that CBN induces structural changes in a concentration-dependent manner, whereas CBG and CBD induce no structural changes in the aptamer regardless of their concentrations. The results show that the DNA aptamer specifically binds to CBN but not to CBG or CBD. These findings are consistent with those reported by Yu et al.1)
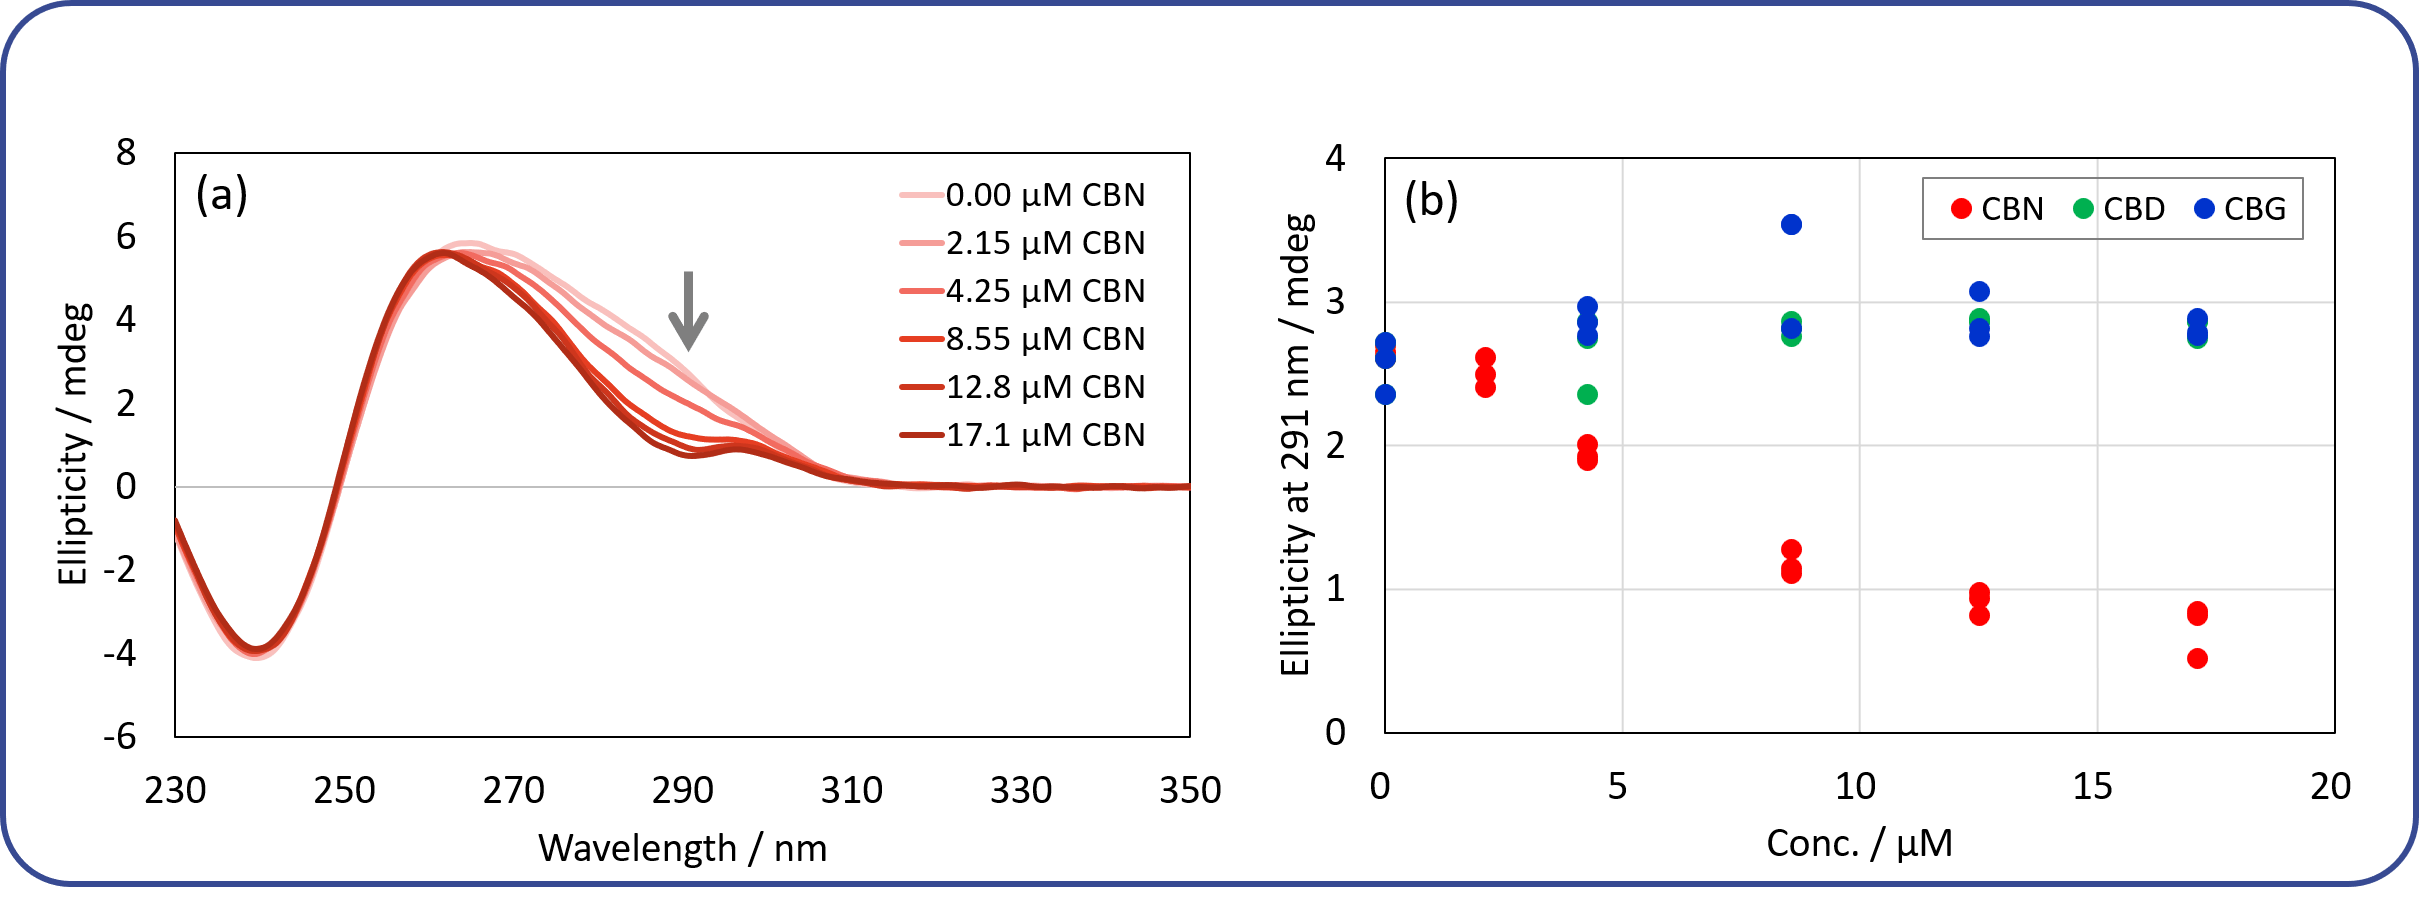
Fig. 8 Cross-reactivity of DNA aptamer towards CBN and its derivatives
(a) CD spectra of DNA aptamer for different CBN concentrations. The concentration of the aptamer is 0.2 mg/mL. The spectra were obtained at 25 ⁰C. Each spectrum has been subtracted by its buffer spectrum. (b) Plot of ellipticity at 291 nm vs. concentration of different ligands.
Conclusion
- CD spectroscopy is an easy yet sensitive technique for obtaining information on the structural changes of DNA aptamers and ligands.
- In this study, the thermal stability and the cross-reactivity of the CBN-binding DNA aptamer were easily evaluated using a CD spectrophotometer.
- The HTCD Plus automatic CD measurement system offers fully automated and thus highly efficient assessment of DNA aptamers, as demonstrated in this study.
References
Poster Session at 2023 OLIGO MEETING (19th Annual Meeting of the Oligonucleotide Therapeutics Society, October 22-25, 2023, Barcelona, Spain)
Satoko Suzuki1,2, Ai Yamane1, Taiji Oyama1, Ken-ichi Akao1, Takehiko Wada2
1. JASCO Corporation, 2967-5 Ishikawa-machi, Hachioji, Tokyo 192-8537
2. Tohoku University, 2-1-1 Katahira, Aoba-ku, Sendai, Miyagi 980-8577
1) Isolation of Natural DNA Aptamers for Challenging Small-Molecule Targets, Cannabinoids: Haixiang Yu, Yingping Luo, Obtin Alkhamis, Juan Canoura, Boyang Yu, and Yi Xiao; Anal. Chem. 2021, 93, 3172−3180
2) Structure Evaluation of G-quadruplex Aptamers Using High-Throughput CD Measurement System and Principal Component Analysis: Satoko Suzuki; JASCO application data; https://jascoinc.com/applications/evaluation-of-g-quadruplexes-using-htcd/


