Introduction
Question.
How can you analyze properly the 3D spectral data obtained with interval scan mode for example?
Answer.
Two dimensional correlation program is available for the analysis of 3D spectral data obtained with interval scan measurement or temperature-interval scan measurement. The correlation between several different absorption peaks in time-course can be observed through the contour mapping and other display mode.
The time-course measurement or the measurement under temperature change is available in the IR spectrometry so that the structure change of sample under the conditions can be observed. In the ordinary analysis mode, it is necessary to check the change of peak intensity or the shift in every peak. Therefore, it is not easy to perform the proper analysis if some peaks are overlapped. On the other hand, the two dimensional correlation program provides the details of even the overlapped peaks or hidden peaks. In the program, the fourier transform of peak behavior at any wavenumber in time-course can be performed resulted in the calculation of real and imaginary parts. The real part is called as synchronous correlation*1 and the imaginary part is called as asynchronous correlation*2. Each of correlation spectra are displayed in two dimensional mode so that you can easily see the details of even the overlapped peaks or hidden peaks.
*1Synchronous correlation:
It indicates how much the behavior of peak intensity change is similar to each other. If the intensity change of peak increases or decreases in same direction, the positive number is displayed. If it is in different direction, the negative number is displayed.
*2Asynchronous correlation:
It indicates how much the behavior of peak intensity change is different from each other. If the speed of peak intensity change in X axis is slower than the speed of intensity in Y axis, the positive number is displayed. If the speed in X axis is faster than that of Y-axis, the negative number is displayed.
FT/IR-4000/6000 FTIR spectrometer
Test run of two dimensional correlation program
For your better understanding of this program, the synthesized spectra were simulated under the peak intensity change with the following conditions (Figure 1 and Table 1) .
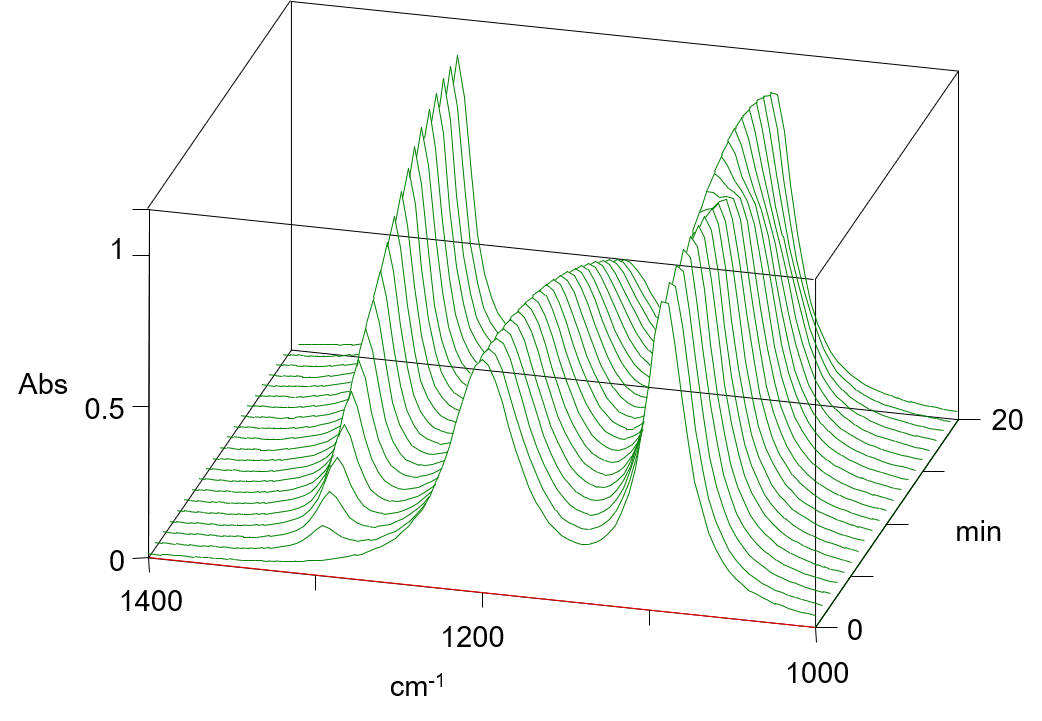
Figure 1. 3D spectra of synthesized waveform
Table 1. Conditions of simulation
| Peak position | 1300cm-1 | 1200cm-1 | 1100cm-1 around |
| Peak behavior | Increase | Decrease gradually | 1090cm-1: decrease、1110cm-1: increase |
The correlation spectra of synthesized waveform are shown in Figure 2 and 3, while the estimated peak behaviors are displayed in Table 2 and 3 respectively. As you can see, two dimensional correlation program provides you the detailed peak information even under complicated peak pattern.
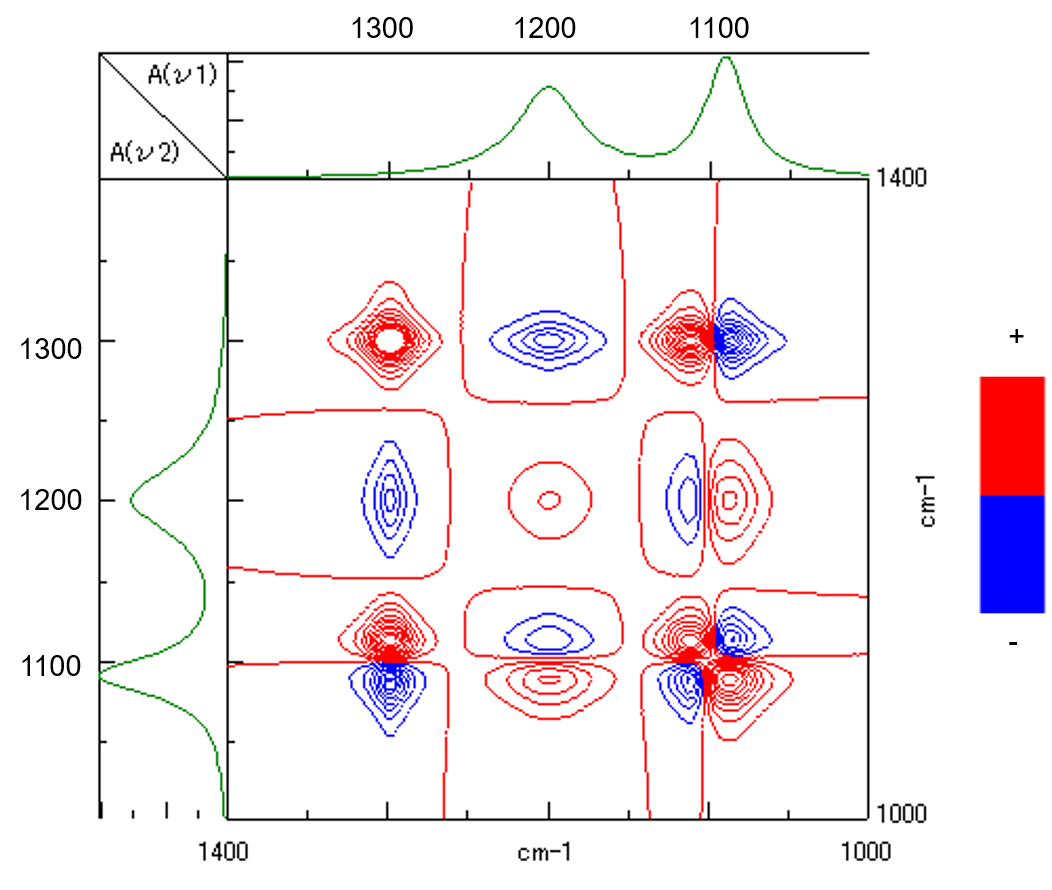
Figure 2. Synchronous correlation spectra
Table 2. Estimated peak behavior
| Correlation peak position | Correlation | Peak behavior |
| 1200 / 1300 cm-1 | negative | Increase or decrease in opposite direction |
| 1090 / 1110 cm-1 | negative | Increase or decrease in opposite direction |
| 1110 / 1300 cm-1 | positive | Increase in the same direction |
| 1090 / 1200 cm-1 | positive | Decrease in same direction |
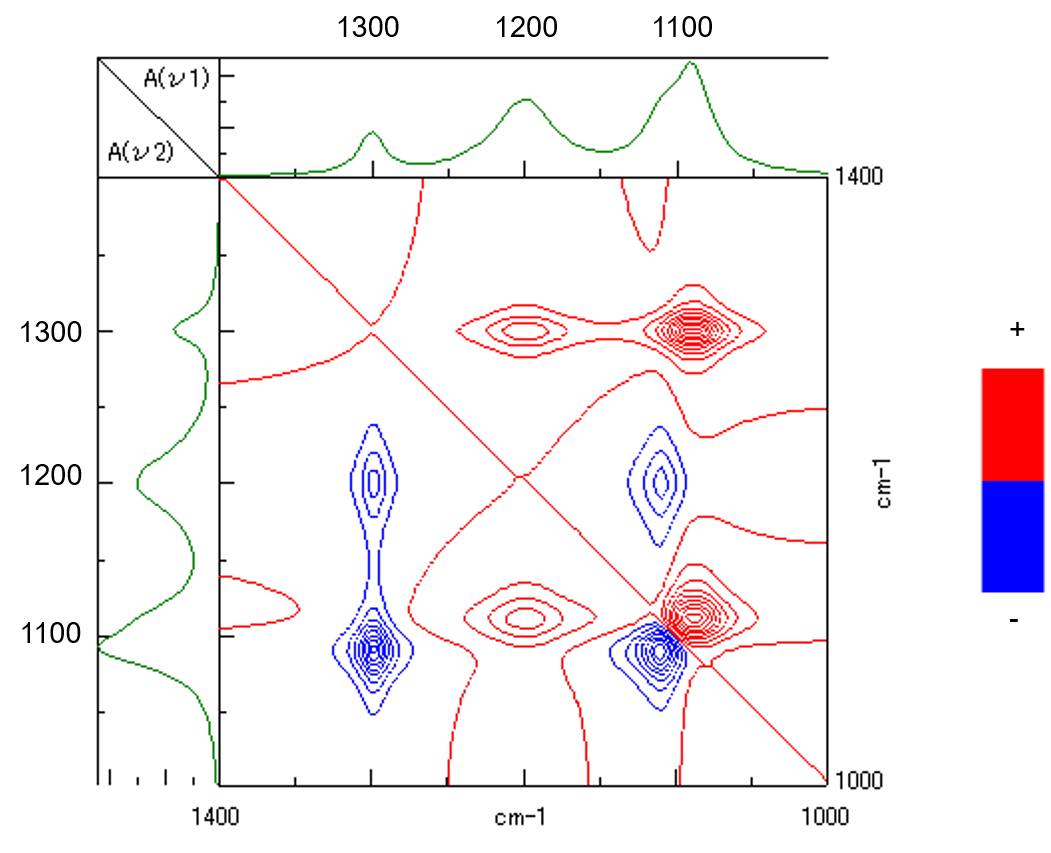
Figure 3. Asynchronous correlation spectra
Table 3. Estimated peak behavior
| Correlation peak position | Correlation | Peak behavior |
| 1200(X-axis) / 1300(Y-axis) cm-1 | Positive | The speed of intensity change at 1300 cm-1 is slower than the speed at 1200 cm-1. |
| 1090(X-axis) / 1110(Y-axis) cm-1 | Positive | The peak intensity at 1110cm-1 increased then, the intensity at 1090cm-1 decreased gradually. |


