Introduction
Spectra obtained by time or temperature interval scan measurements are three-dimensional (3D) spectra with three axes: wavenumber and intensity, in addition to either time or temperature. When investigating structural changes with time or temperature based on 3D spectra, it is usually necessary to identify changes in photometric intensity or shifts in peak position for multiple spectra individually. However, using visual assessment only, it is not easy to identify overlapping peaks or slight peak shifts. In such cases, two-dimensional (2D) correlation spectroscopy is a useful analysis technique.
The 2D correlation program manufactured by JASCO allows easy analysis using 2D correlation spectroscopy. This program calculates the real and imaginary parts of the correlation function by taking the Fourier transform of the changes in spectral bands with time or temperature at different wavenumbers. The real part is referred to as the “synchronous correlation” and the imaginary part as the “asynchronous correlation”, and these are plotted as a contour map or a color-coded map. By calculating synchronous and asynchronous correlation spectra, it is easy to separate overlapping spectral bands, identify hidden bands, and analyze the relationship between bands and the changes between them.
This report presents an example application of the JASCO 2D correlation program.
What is synchronous correlation?
When the spectral peak intensities at two wavenumbers increase or decrease, the cross-peaks in the correlation map indicate whether the changes are in the same or different directions:
Positive correlation peak: Changes in the spectral peak intensities occur in the same direction (both increase or both decrease)
Negative correlation peak: Changes in the spectral peak intensities occur in opposite directions (one increases while the other decreases)
What is asynchronous correlation?
This allows the time or temperature sequence of changes in the intensity of two spectral peaks to be determined. If the synchronous correlation at the same wavenumber coordinates is positive, then in the asynchronous spectrum the following holds. (Note that if the synchronous correlation at the same wavenumber coordinates is negative, the positive-negative relationship for asynchronous correlation is opposite to that given below.)
Positive correlation peak: The change in the intensity of the spectral peak at the position indicated on the x-axis of the correlation map occurs before the change in the intensity of the peak indicated on the y-axis.
Negative correlation peak: The change in the intensity of the spectral peak at the position indicated on the x-axis of the correlation map occurs after the change in the intensity of the peak indicated on the y-axis.
* The horizontal axis in a 2D correlation spectrum is defined as the x-axis and the vertical axis as the y-axis.
Experimental
A simulated 3D spectrum (Figure 1) with the temporal changes in peak intensities shown in Table 1 was created and then analyzed using the JASCO 2D correlation program.
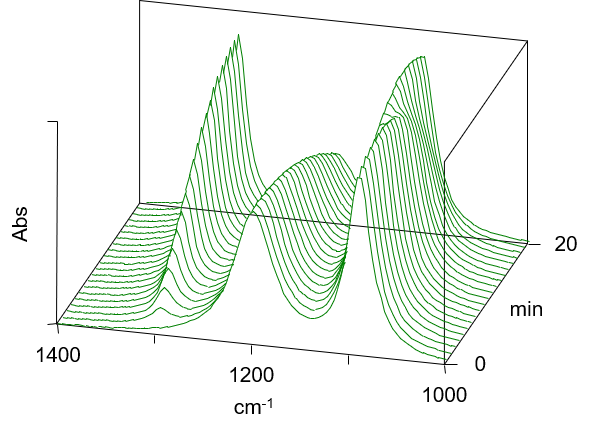
Fig. 1 3D spectrum
Table 1 Changes in peak intensity for simulated 3D spectrum
| Peak | Peak intensity |
| 1300 cm-1 | Increasing |
| 1200 cm-1 | Decrease slowly |
| 1110 cm-1 | Increasing |
| 1090 cm-1 | Decreasing |
Keywords
Two-dimensional correlation spectroscopy, Time interval scan measurement, Temperature variation measurement
Results
Figures 2 and 3 show synchronous and asynchronous correlation spectra calculated using the 2D correlation program. Table 2 lists the details of changes that occurred with time for the different spectral bands. Although such changes are difficult to identify visually from the spectrum shown in Figure 1, they can be easily determined using 2D correlation spectroscopy. Furthermore, the analysis results showed that the band at around 1100 cm-1, which appears to be a single band in Figure 1, is actually composed of two bands with peak tops at 1110 cm-1 and 1090 cm-1.
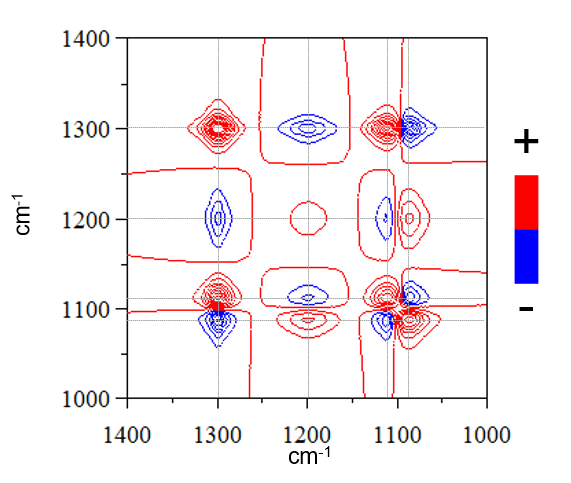
Fig. 2 Synchronous correlation spectrum
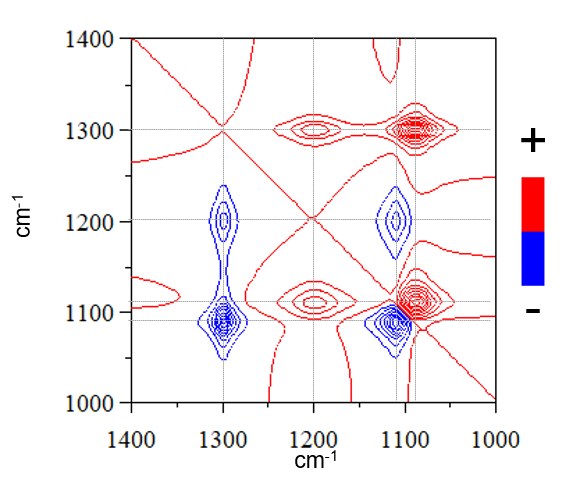
Fig. 3 Asynchronous correlation spectrum
| Peak top of band [cm-1] | Synchronous correlation | Asynchronous correlation | Differences in change between bands |
| 1300, 1200 | – | – | Changes at 1300 cm-1 and 1200 cm-1 were in opposite directions. Change at 1300 cm-1 occurred before that at 1200 cm-1. |
| 1300, 1110 | + | – | Changes at 1300 cm-1 and 1110 cm-1 were in same direction. Change at 1300 cm-1 occurred after that at 1110 cm-1. |
| 1300, 1090 | – | – | Changes at 1300 cm-1 and 1090 cm-1 were in opposite directions. Change at 1300 cm-1 occurred before that at 1090 cm-1. |
| 1200, 1110 | – | + | Changes at 1200 cm-1 and 1110 cm-1 were in opposite directions. Change at 1200 cm-1 occurred after that at 1110 cm-1. |
| 1200, 1090 | + | 0 | Changes at 1200 cm-1 and 1090 cm-1 were in same direction. Changes at 1200 cm-1 and 1090 cm-1 occurred simultaneously. |
| 1110, 1090 | – | – | Changes at 1110 cm-1 and 1090 cm-1 were in opposite directions. Change at 1110 cm-1 occurred before that at 1090 cm-1. |
Conclusion
The results presented here show that 2D correlation spectroscopy is an effective means of analyzing 3D spectra obtained from time interval or temperature variation measurements. The JASCO 2D correlation program allows changes occurring for different bands to be easily analyzed.
References
- I. Noda: J. Am. Chem. Soc., 111, 8116 (1989). DOI: 10.1021/ja00203a008
- I. Noda: Kobunshi (High Polymers), 39, 214 (1990).
- S. Morita, H. Shinzawa, Y. Ozaki: Bunkokenkyu (Journal of the spectroscopical research of Japan), 60, 243 (2011).
- R. Watanabe, H. Shinzawa: Bunseki (Analysis), 1, 10 (2020).
Acknowledgements
I would like to thank Dr. H. Shinzawa of National Institute of Advanced Industrial Science and Technology (AIST) for useful discussions.

