Introduction
In Raman measurements, the desired Raman signal may not be obtained due to fluorescence emitted from a sample. To avoid such fluorescence effects, changing the excitation wavelength is usually considered. However, actually acquiring the fluorescence spectrum allows the optimal excitation wavelength for Raman measurements to be easily determined, leading to improved analysis efficiency.
The dark-field fluorescence observation mode attachment, originally developed for JASCO’s micro-Raman spectrometer, observes fluorescence emitted from a sample under LED illumination. By measuring the fluorescence spectrum, the optimal excitation wavelength for Raman measurements can be easily determined.
Experimental
An attempt was first made to measure the Raman spectrum of an ink stamp on paper at an excitation wavelength of 532 nm. However, the Raman signal could not be detected due to the intense fluorescence emitted by the sample. Therefore, the fluorescence spectrum of the sample was measured using a dark-field fluorescence measurement attachment developed by JASCO, containing an LED light source. From the fluorescence spectrum, the optimal excitation wavelength that minimized fluorescence emission from the sample was determined. This excitation wavelength was then used to perform Raman measurements.
Sample
Ink stamp (fluorescence emitted at 405 nm excitation)
System
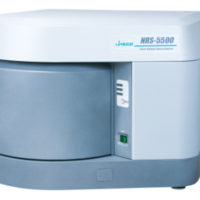
Instrument: NRS-4500 Raman spectrometer
Accessory: RMIX4 MIX observation unit, DFF-405 Dark-field fluorescence slide-in attachment
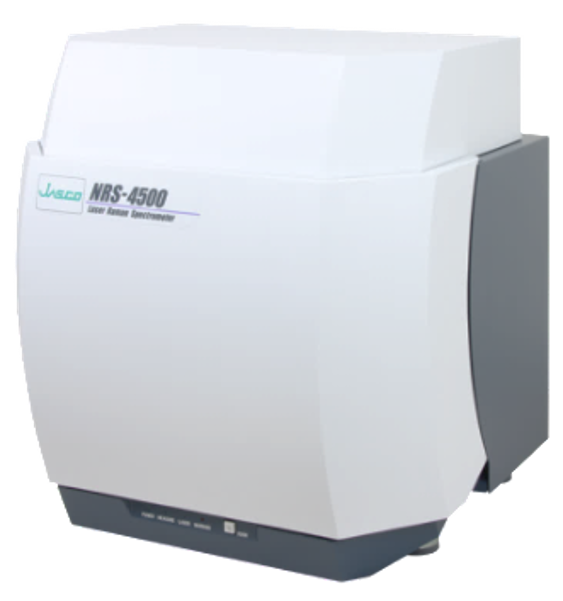
Fig. 1 NRS-4500 Raman spectrometer
Parameters [fluorescence spectra]
Laser wavelength: 405 nm (using dark-field fluorescence attachment)
Grating: 900 gr/mm
Rejection filter: 457-nm Band rejection filter
Objective lens: Dark-field long-working distance (visible, 20x)
Exposure time: 4 sec
Accumulations: 2
Parameters [Raman spectra]
Laser wavelength: 532 nm, 785 nm, 457 nm
Objective lens: Dark-field long W.D. (visible, 100x)
* Other parameters were optimized for each measurement.

Fig. 2 Images of ink stamp on paper
Keywords
Fluorescence, excitation wavelength, Raman spectroscopy, dark-field fluorescence observation, ink stamp, ink, pigment
Results
Figure 3 shows the fluorescence spectrum of an ink stamp on paper together with the Raman shifts for three different excitation wavelengths. It can be seen that if the Raman spectrum was obtained at an excitation wavelength of 532 nm, it would be strongly affected by fluorescence. However, for an excitation wavelength of 785 nm, the effect of fluorescence is expected to be small.
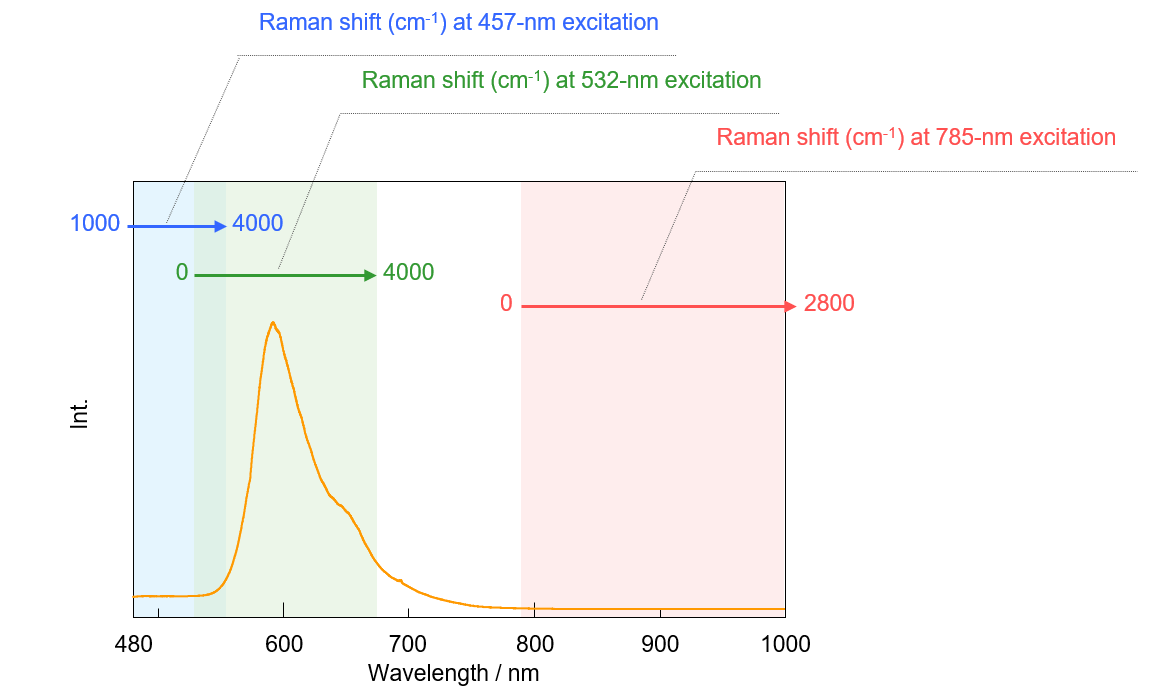
Fig. 3 Fluorescence spectrum
Figure 4 shows Raman spectra obtained at excitation wavelengths of 532 nm, 785 nm, and 457 nm. As can be seen, for an excitation wavelength of 785 nm, Raman peaks are clearly detected, whereas this is not the case for other excitation wavelengths. The observed Raman spectrum is considered to be associated with the organic pigment used in the ink stamp.
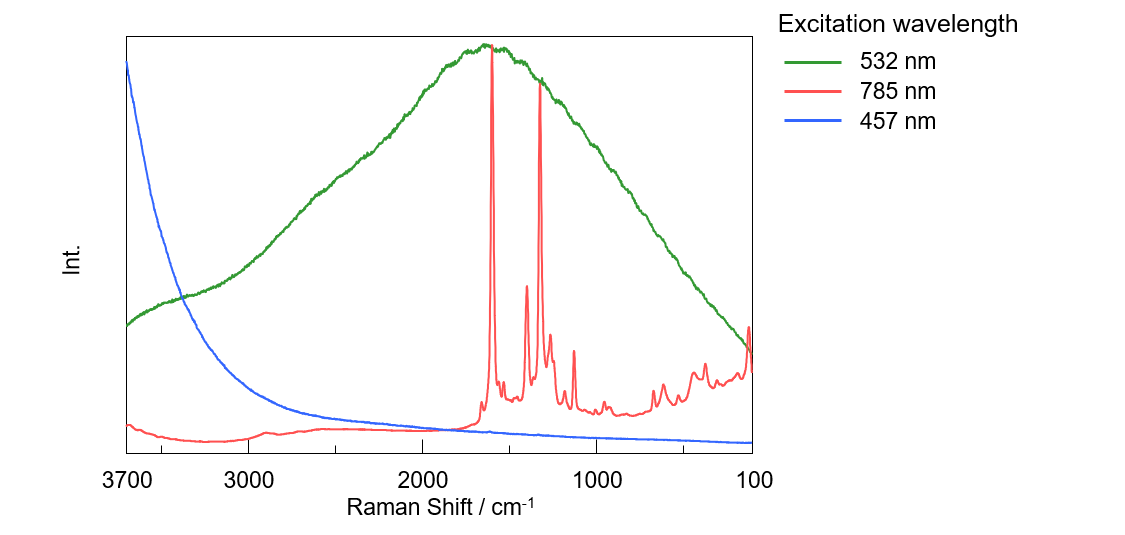
Fig. 4 Raman spectra
Conclusion
Measurement of fluorescence spectra using a micro-Raman spectrometer equipped with a dark-field fluorescence attachment allowed the optimum excitation wavelength for Raman measurements to be determined. This not only allows the measurement parameters to be optimized, but also provides a guideline when choosing the most appropriate wavelength when adding a new laser, and reduces the measurement time when sharing analytical equipment between institutions.


