Introduction
Fluorescence anisotropy is known to reflect the degree of rotational mobility of a fluorescent molecule from its excitation to emission. When the molecule does not rotate between its excitation and emission, the fluorescence emitted remains the same in its polarization as that of excitation light. However, when the molecule rotates between the excitation and emission, the fluorescence emitted shows altered polarization depending on the rotation of molecule. It means that the more the molecule rotates, the less polarized the fluorescence emitted. By exploiting this phenomenon, we can estimate how easy the rotational motility of fluorescent molecule is from its fluorescence anisotropy. The rotational mobility reflects following information:
(1) Molecular size – smaller molecules show higher mobility.
(2) Environment around molecules – lower viscosity confers molecules with higher mobility.
(3) Restriction of molecules – molecules with less restriction due to surrounding molecules show higher mobility.
The information above is exploited in biology to monitor the binding or conformational change of biopolymers such as proteins and nucleic acids. In particular, fluorescence anisotropy reflects the rotational mobility of aromatic amino acids (tryptophan, tyrosine and phenylalanine), and therefore it serves as the metrics for the conformational changes of proteins.
Here we describe the evaluation of the structural changes of apo α-lactalbumin by measuring fluorescence anisotropy under different concentrations of guanidine hydrochloride (GuHCl).
Principle of fluorescence anisotropy
When a fluorescence molecule is excited by vertically polarized light, the fluorescence intensity (F) is:

Fluorescence anisotropy (r) is defined as the ratio of difference in normalized fluorescence intensity between vertically and horizontally polarized light after vertically polarized excitation:

Along with anisotropy, fluorescence polarization (P) is also used to express the degree of polarization of emission light:

F : Fluorescence intensity
R : Fluorescence anisotropy
P : Fluorescence polarization degree
IVV : Vertically polarized fluorescence intensity excited by vertically polarized light
IVH : Horizontally polarized fluorescence intensity excited by vertically polarized light
G : Sensitivity correction function depending on polarization of spectrometer for emission
<G factor>
The sensitivity of the monochrometer for emission differs depending on the direction of the polarization. Therefore, it is necessary to know a correction factor G to take this into account when detecting the emission light. The G factor is calculated by using the vertically polarized emission (IHV) and horizontally polarized emission (IHH) when the sample in question is excited with horizontally polarized light as follows (Figure 1a).

<IVV and IVH Measurements>
When measuring fluorescence anisotropy, the sample is excited by vertically polarized light, and the fluorescence intensity of vertically polarized emission (IVV) and horizontally polarized emission (IVH) are measured (Figure 1b).
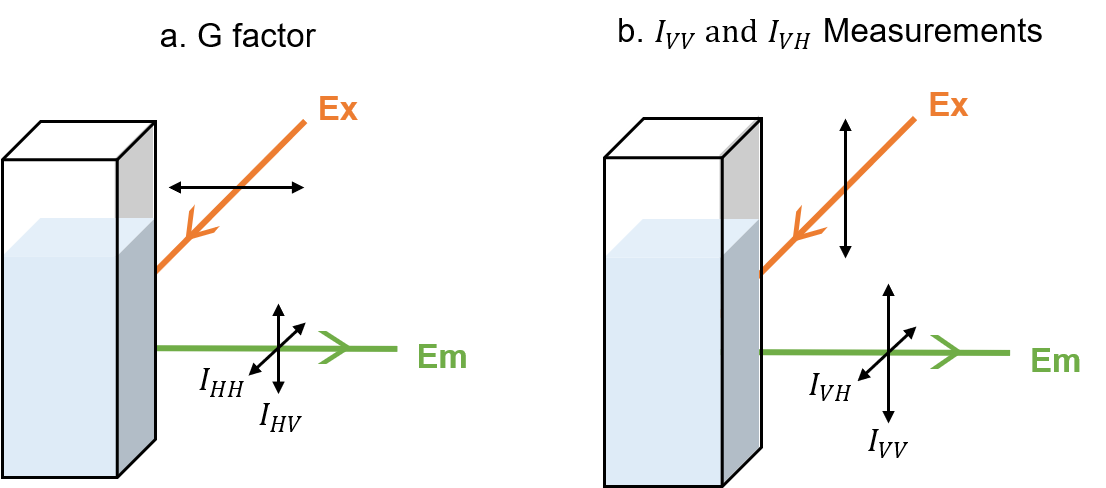
Fig. 1 Fluorescence anisotropy measurement
Experimental
Measurement system
FP-8350ST Spectrofluorometer
FDP-837 Automatic Polarizer
FWAP-175 Fluorescence Polarization Measurement Program
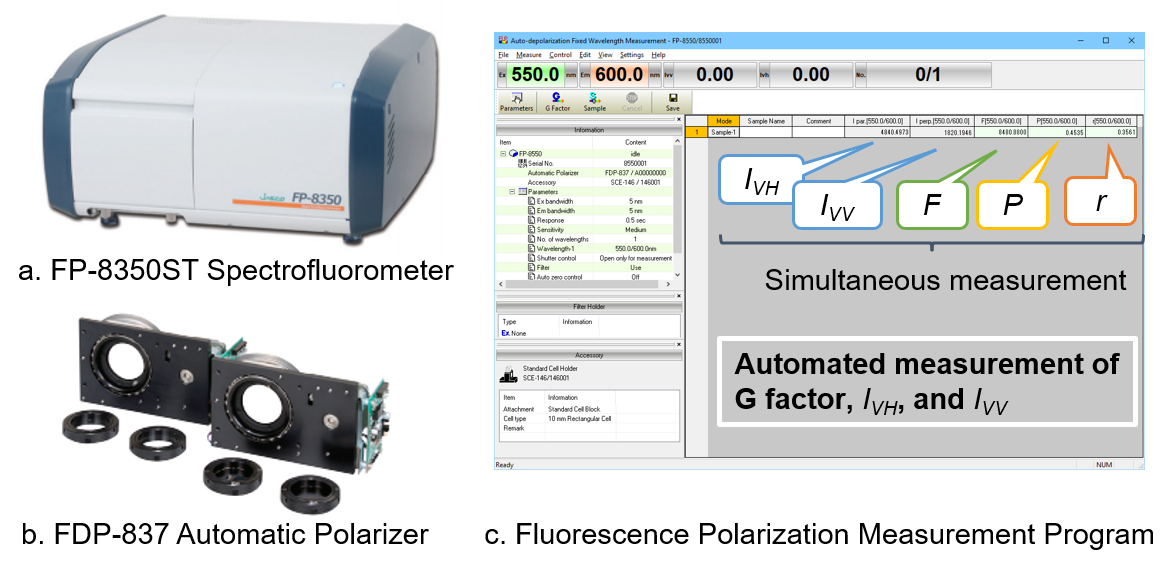
Fig. 2 Measurement system
Experimental
0.5 mg/mL of apo α-lactalbumin in 1 mM EDTA and PBS (pH 7) was prepared as the sample and dissolved in 0, 1.35, 2.70, 4.05, and 5.40 M GuHCl.
Measurement Conditions
Excitation bandwidth: 5 nm
Excitation wavelength: 300 nm
Emission bandwidth: 5 nm
Emission wavelength: 340 nm
Response: 0.5 sec
Accumulation: 1
The G factor was determined using 0.5 mg/mL of apo α-lactalbumin in 0 M of GuHCl. Then, the fluorescence anisotropy was measured with 300 nm excitation that is known to show the significant change in fluorescence anisotropy depending on the concentration of the denaturant1).
Keywords
Fluorescence depolarization, fluorescence anisotropy, protein, aromatic amino acid, denaturation, apo α-lactalbumin
Results
The fluorescence anisotropy change of the sample is shown in Figure 3. The anisotropy decreased when the concentration of GuHCl increased. The result indicates that tryptophan residues placed inside of the protein in the native state were exposed to the solvent due to the denaturation caused by GuHCl, which increased their rotational movements.
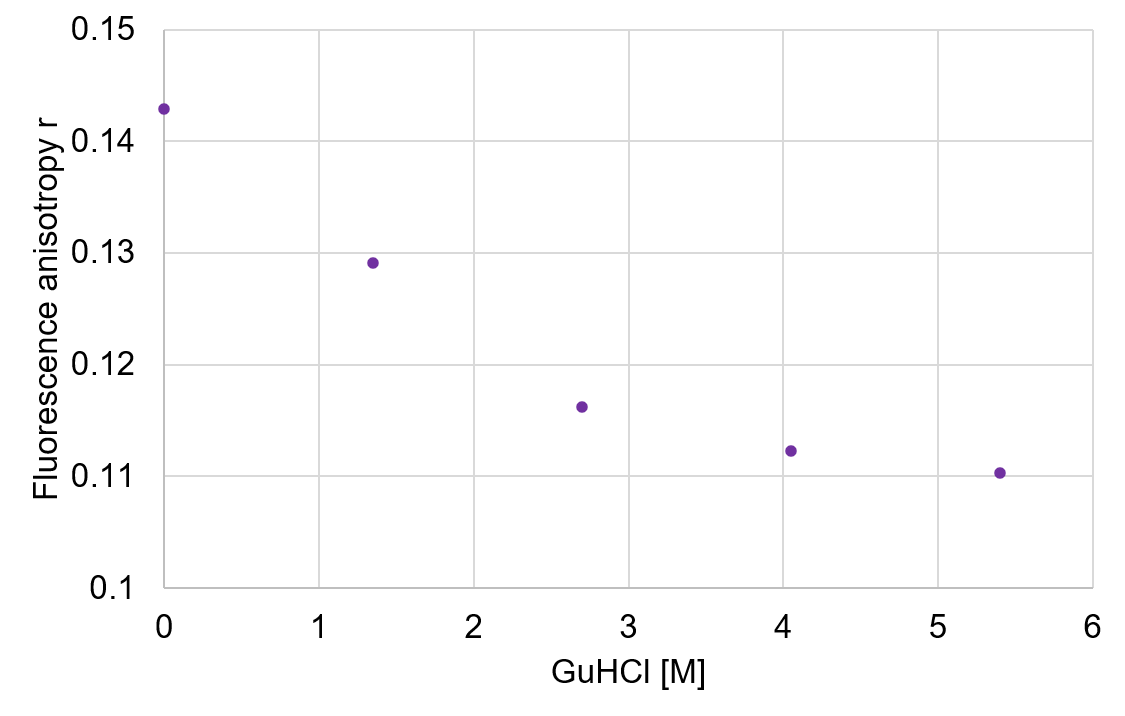
Fig. 3 Fluorescence anisotropy change of apo α-lactalbumin
Conclusion
Fluorescence anisotropy of apo α-lactalbumin was measured, and the conformational change caused by denaturant was easily monitored using the spectrofluorometer. Although the structural change of single protein species was evaluated this time, fluorescence anisotropy is widely used to monitor interactions between two different biomolecules as well. In biopharmaceutical industry, fluorescence anisotropy has been applied to the screening of a large number of drug candidates. For example, binding between antibody drug and antigen, or oligonucleotide therapeutic and its target are monitored by fluorescence anisotropy to evaluate the effect of their sequence or buffer conditions.
Those evaluations can be conducted automatically by using the system shown in Figure 2. Besides, the fluorescence polarization measurement program includes temperature- and time- dependent measurement programs, enabling to see conformational change through temperature and time.
References
1) Denis Canet, Klause Doering, Christpher M. Dobson, and Yves Dupont, Biophysical Journal, 2001, 80, 1996-2003.


