Introduction
The biosimilar market is expanding and regulatory authorities emphasize the importance of analytical characterization of biosimilars, and recommend orthogonal assessment of the HOS of biosimilars and their innovators using multiple techniques based on different principles1-5). Far-UV/CD and FT-IR spectroscopy are orthogonal methods for evaluating secondary structure, and near-UV/CD, Raman and fluorescence spectroscopy are orthogonal for tertiary structure. Comprehensive orthogonal assessment using these methods can provide a firm structural foundation to claims of biosimilarity.
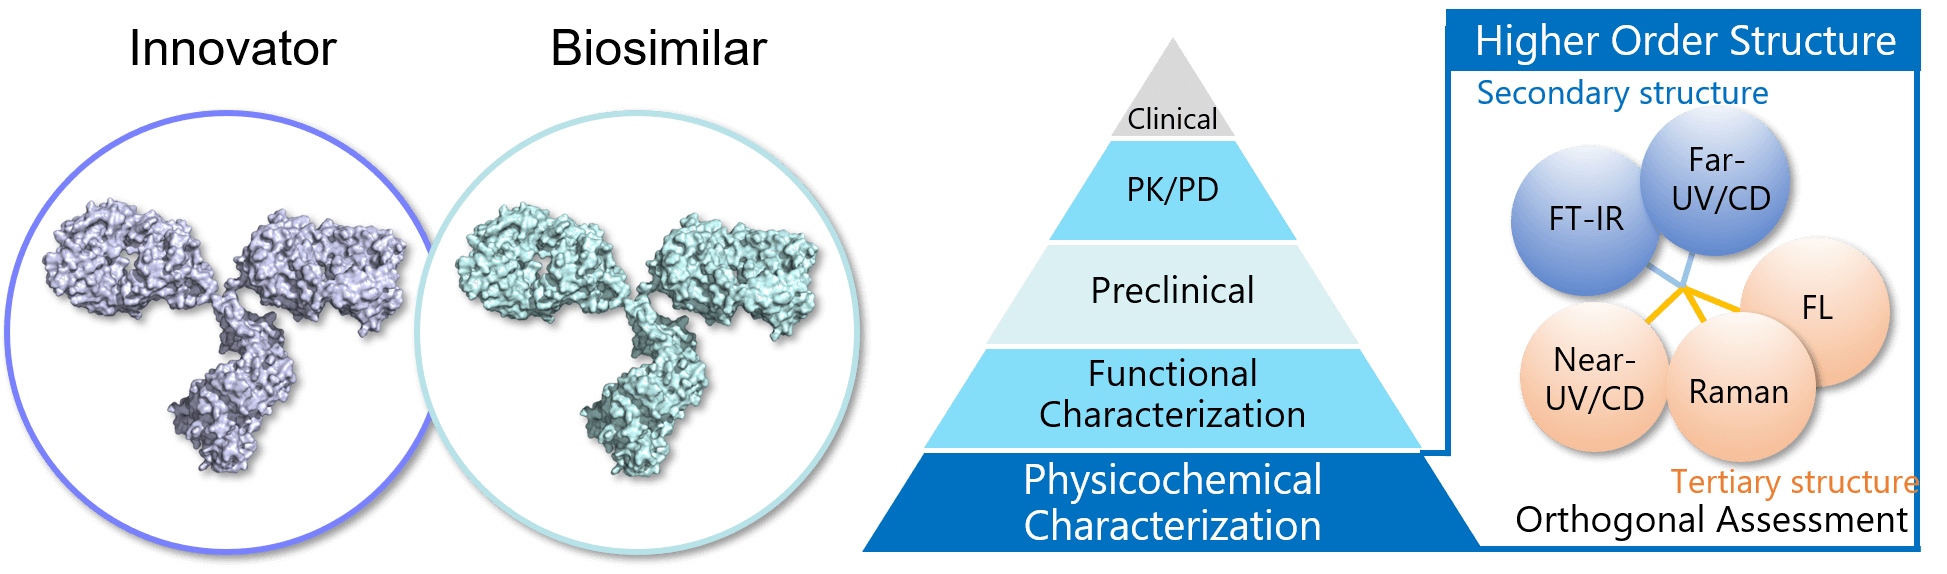
Figure 1. HOS similarity assessment for biosimilar
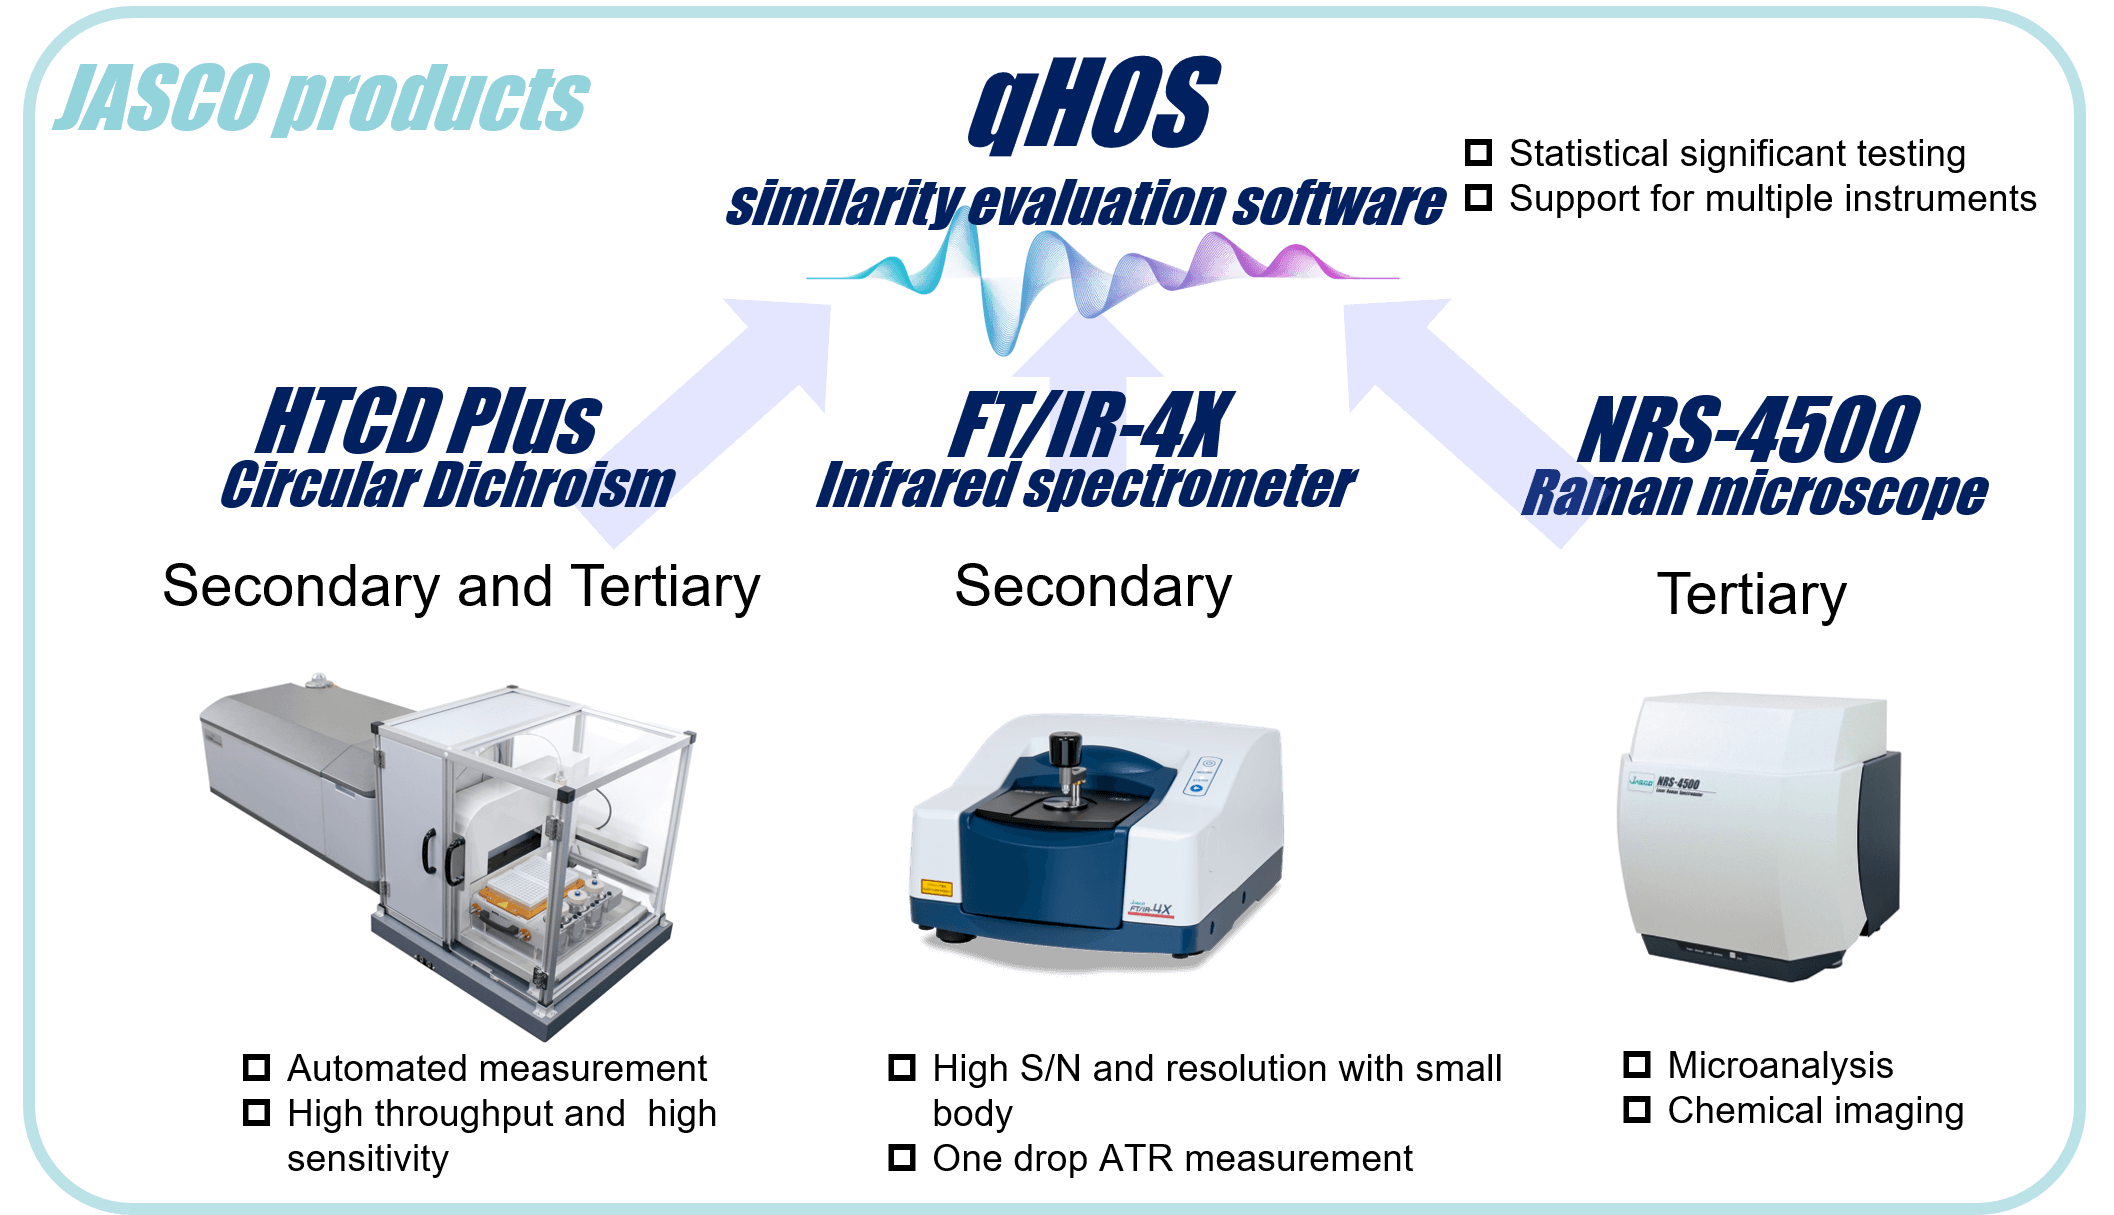
Here we report the results of a HOS assessment of a biosimilar and its innovator using cutting edge JASCO instruments. These are the HTCD Plus for far- and near-UV/CD, the FT/IR-4X for infrared, and the NRS-4500 for Raman spectroscopy. We also use the qHOS software, which allows statistical determination of spectral similarity.
Experimental
Measurement system
Materials
Rituximab: MabThera® (Innovator), RIABNI™ (Biosimilars)
Both samples were prepared to 10 mg/mL
Additive : Sodium citrate dihydrate 7.4 mg/mL, Sodium chloride 9.0 mg/mL, Sodium hydroxide 9.0 mg/mL, Polysorbate 80 0.7 mg/mL
Trastuzumab: Herceptin® (Innovator)
The powder was dissolved in H2O to a concentration of 10 mg/mL
Additives: trehalose hydrate 4.7 mg/mL, L-histidine hydrochloride hydrate 0.11 mg/mL, L-histidine 7.4 x 10⁻² mg/mL, polysorbate 2.1 x 10⁻² mg/mL
Analysis
Distance calculation : Euclidean
Weighting : Noise
Significance testing : Welch
Significance level : 0.05
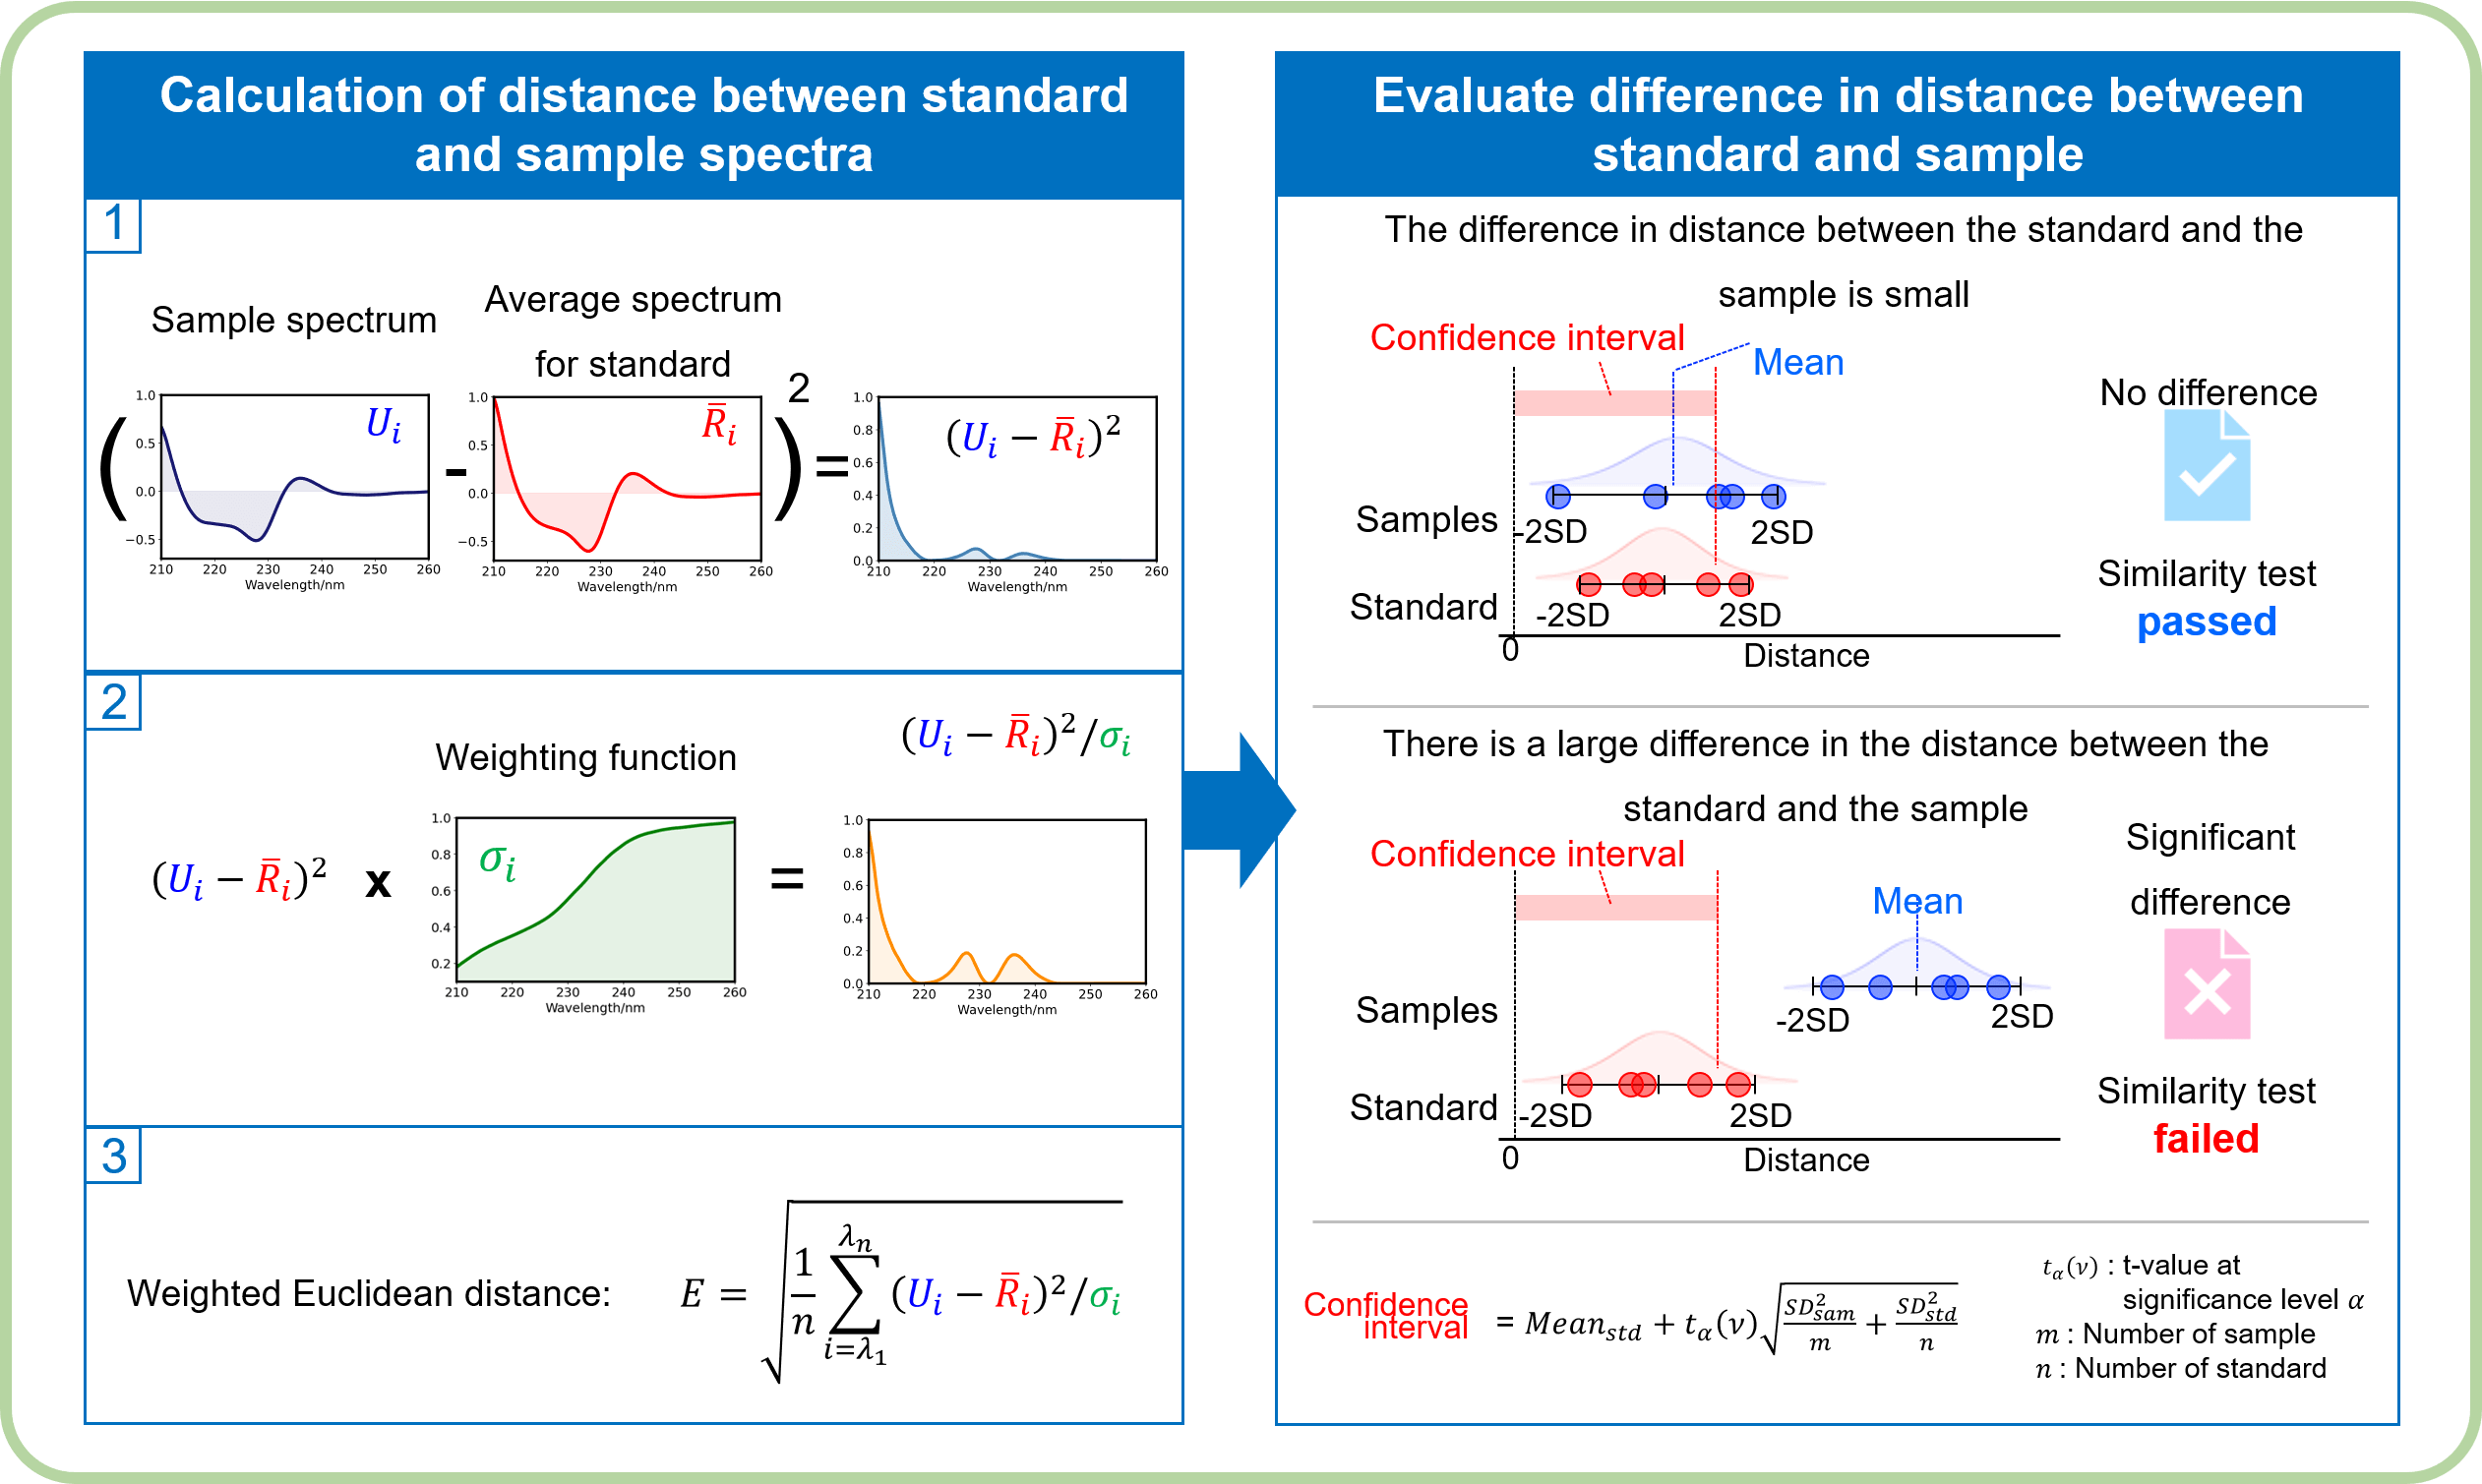
Similarity testing scheme of the qHOS
Results
Figure 2 shows the similarity assessment result of the tertiary structure of MabThera® and Herceptin® by using CD spectroscopy.
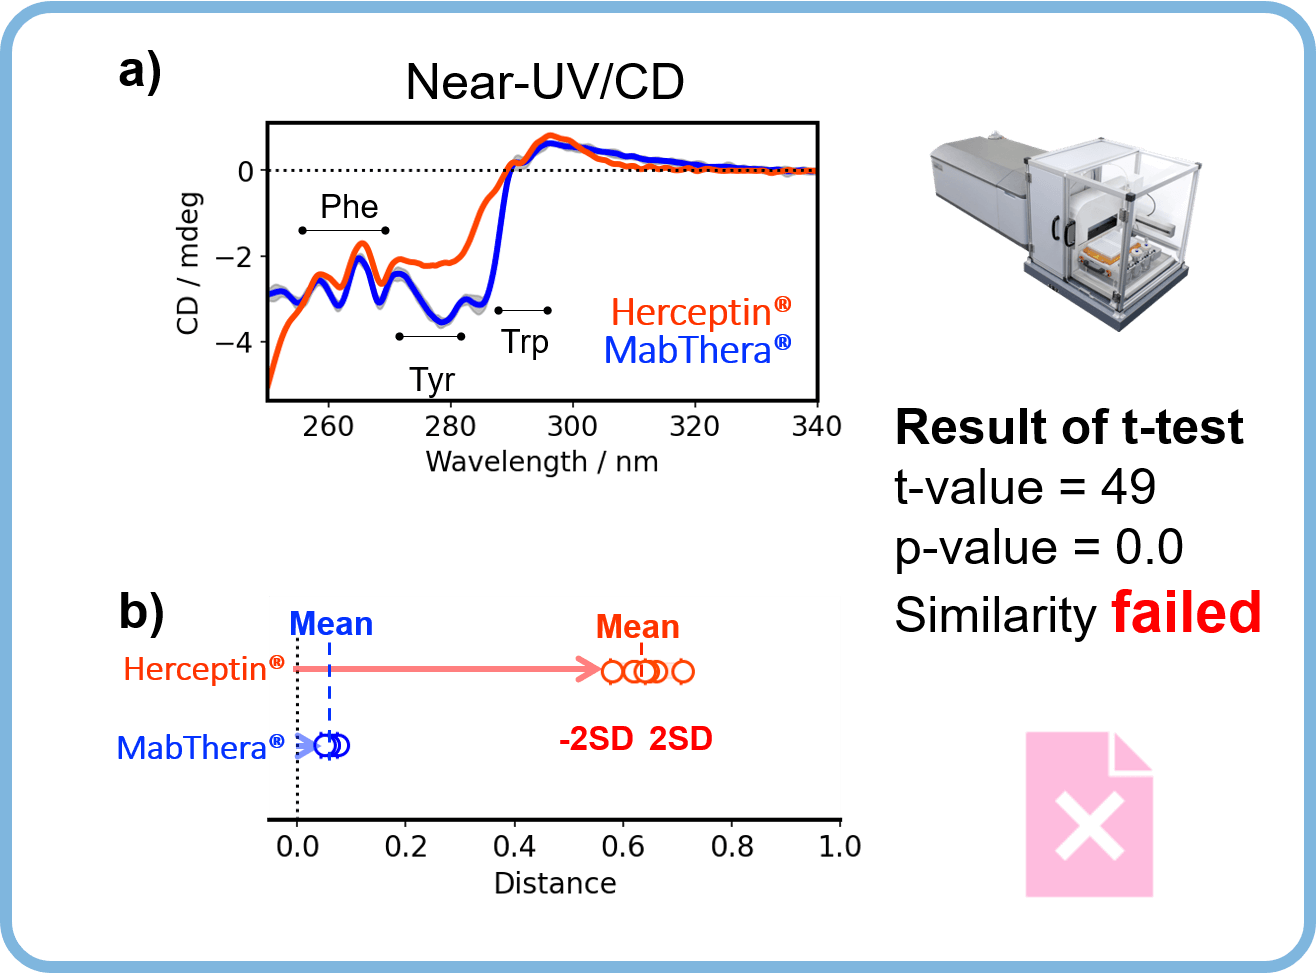
Figure 2. Similarity assessment of the tertiary structure of MabThera® and Herceptin®, antibody drugs with different targeting and formulation conditions.
The shapes of the near-UV/CD spectra of MabThera® and Herceptin® differ significantly (Figure 2a). Similarly, the distribution of distances between MabThera® and Herceptin calculated from the CD spectra show a significant difference (Figure 2b). The p-value obtained from the t-test is below the significance level of 0.05, indicating that Herceptin® has a different tertiary structure to MabThera®.
Figure 3 shows the results of orthogonal similarity assessment for the secondary structure of MabThera® and RIABNI™ by CD spectroscopy and IR spectroscopy.
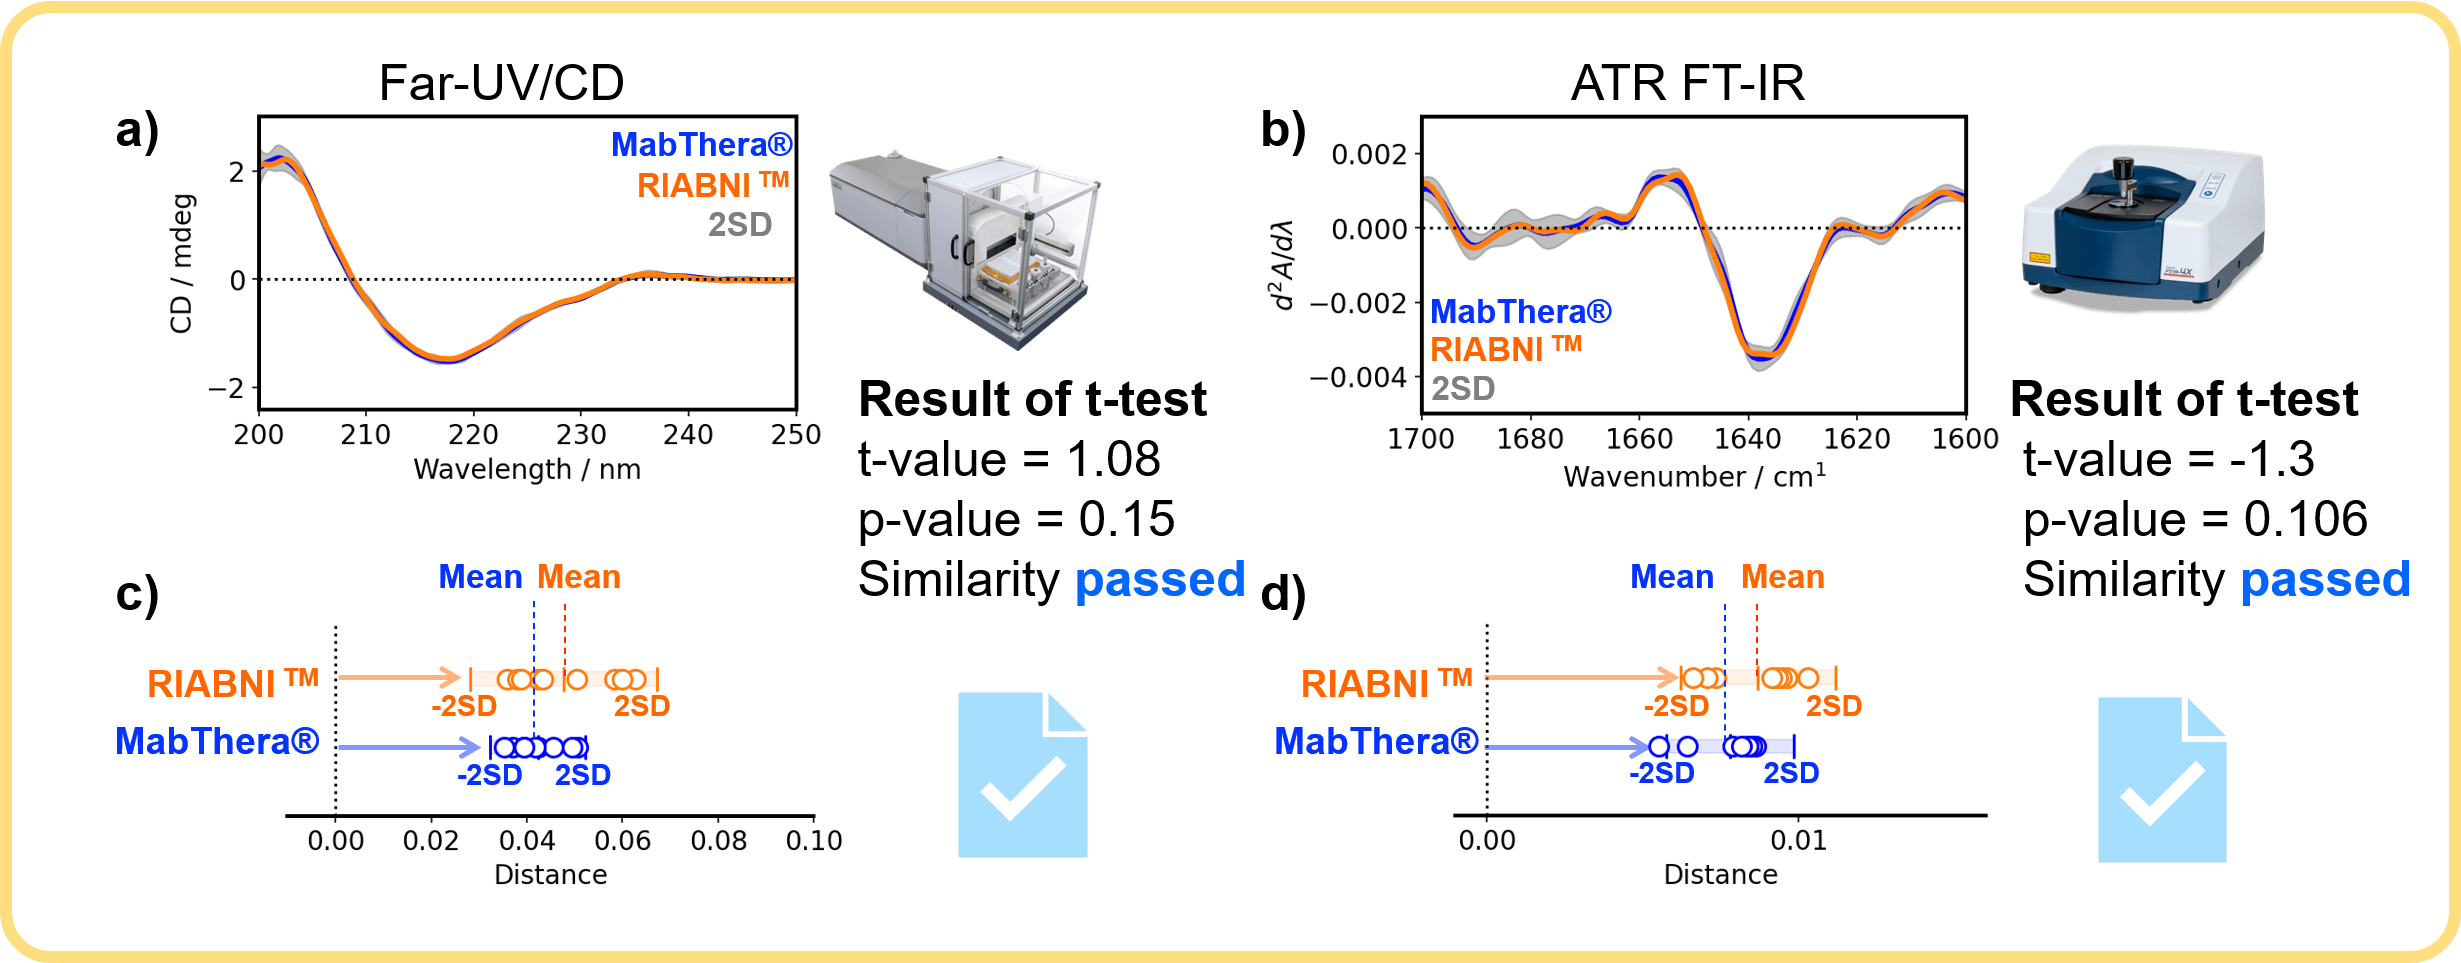
Figure 3. Orthogonal similarity assessment for the secondary structure of MabThera® and RIABNI™
The far-UV/CD and FTIR spectra of the biosimilar RIABNI™ are in excellent agreement with those of the innovator MabThera® (Figure 3a and 3b), and the distributions of the distances between MabThera® and RIABNI™ are close to each other (Figure 3c and 3d). The p-value is larger than the significance level of 0.05.
Figure 4 shows the results of orthogonal similarity assessment for the tertiary structure of MabThera® and RIABNI™ by CD spectroscopy and Raman spectroscopy.
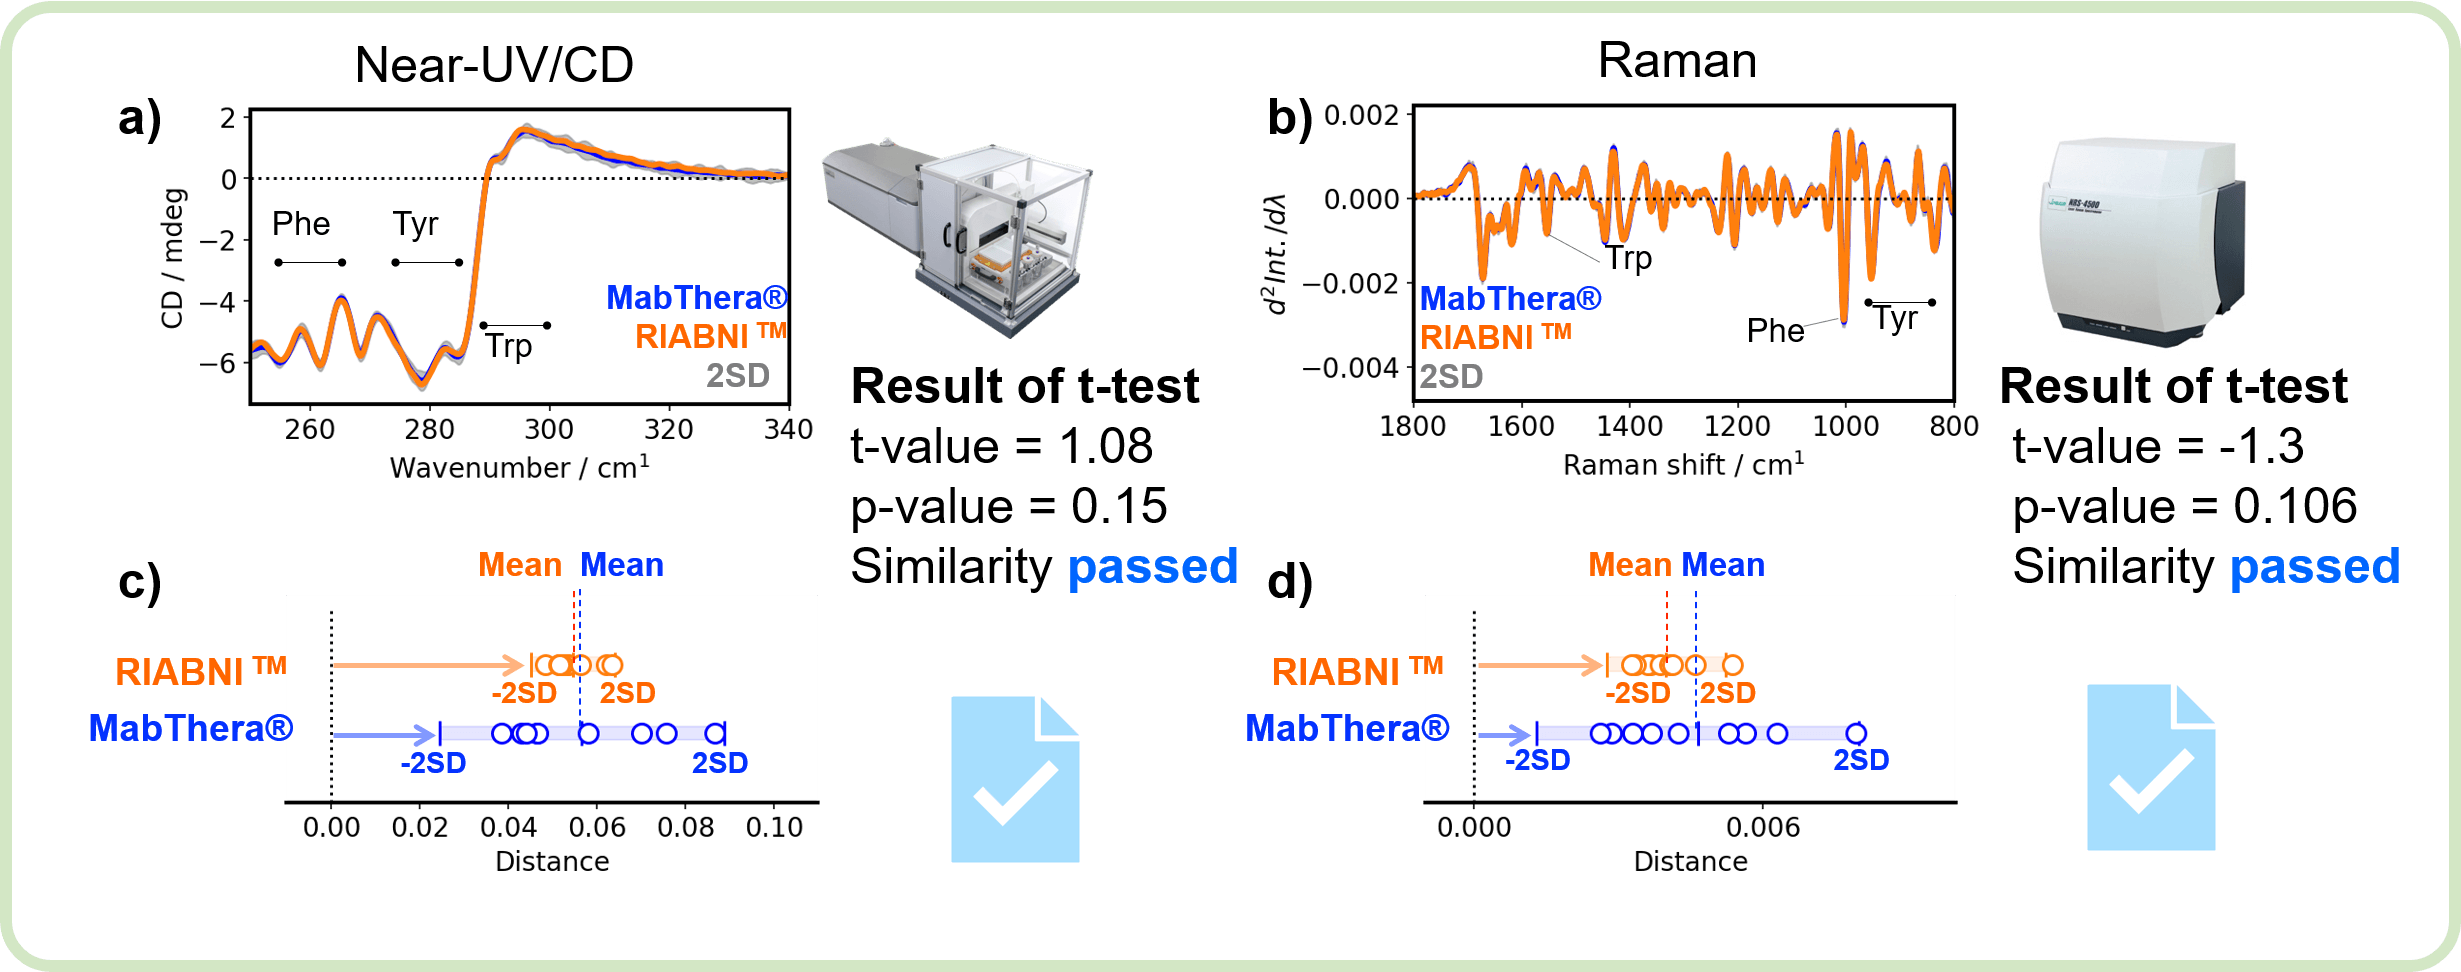
Figure 4. Orthogonal similarity assessment for the tertiary structure of MabThera® and RIABNI™
Similar to the secondary structure, the tertiary structure of MabThera® and RIABNI™ show excellent agreement in the near-UV/CD and Raman spectra (Figure 4a and 4b), and the distribution of the distances between MabThera® and RIABNI™ are close to each other (Figure 4c and 4d). The p-value is larger than the significance level of 0.05.
Conclusion
- We performed orthogonal assessments of the secondary and tertiary structures of a biosimilar and an innovator using HTCD Plus, FT/IR-4X, NRS-4500.
- The similarity of each spectrum was statistically determined using the single qHOS platform.
- The similarity of the HOS for the biosimilar and the innovator was confirmed by orthogonal methods.
- This system can be used not only to evaluate the similarity of biosimilars but also to easily and accurately determine the changes in the HOS of antibody drugs caused by post-translational modifications and external stimuli.
Appendix
Measurement conditions
Far-UV/CD:
Optical path length : 0.2 mm
Auto washing : On
Band width : 1.0 nm
Scanning speed : 20 nm/min
Near-UV/CD:
Optical path length : 0.5 mm
Auto washing : On
Band width : 1.0 nm
Scanning speed : 50 nm/min
ATR FT-IR:
Detector : TGS
ATR crystal : Diamond
Resolution : 4cm-1
Number of scans : 128
Raman:
Laser : 532 nm
Grating : 900 gr/mm
Exposure : 45 sec.
Number of scans : 32
References
Poster Session at PEGS 2022 (18th PEGS BOSTON CONFERENCE & EXPO, May 2 – 6, 2022, in BOSTON, MA, USA)
Taiji Oyama*, Satoko Suzuki, Ai Yamane, Yasuo Horiguchi, Ken-ichi Akao, Koushi Nagamori
JASCO Corporation, Hachioji, Tokyo, 192-8537, Japan
1) International Conference on Harmonisation (ICH) of Technical Requirements for Registration of Pharmaceuticals for Human Use. ICH AUTHORIZED MANUFACTURING CHANGES FOR THERAPEUTIC MABS 833 Harmonised Tripartite Guideline Comparability of Biotechnological/ Biological Products Subject to Changes in their Manufacturing Process Q5E. 2004
2) Department of Biotechnology, Government of India. Guidelines on similar biologics: Regulatory requirements for marketing authorization in India. 2012
3) Center for Drug Evaluation of China National Medical Product Administration. Technical guidelines for development and evaluation of biosimilars. 2015
4) US Food and Drug Administration. Development of Therapeutic Protein Biosimilars: Comparative Analytical Assessment and Other Quality-Related Considerations. 2019
5) European Medicines Agency. Guideline on similar biological medicinal products containing biotechnology-derived proteins as active substance: quality issues (revision 1). 2014


 spectrometer")
