Introduction
Lipid nanoparticles (LNPs)
LNPs are spherical nanoparticles consisting of lipid bilayers, ranging in size from 20 to 1000 nm.1,2) LNPs have been used as drug delivery carriers for therapeutic oligonucleotides, including COVID-19 vaccines.3)
Phase transitions and fluorescence anisotropy of liposomes
Fluorescence anisotropy is known to reflect the rotational mobility of a fluorescent molecule between excitation and emission. This method has been applied to observe the size, binding state, and conformation of biomolecules such as proteins and oligonucleotides. One such application is determining the membrane fluidity of liposomes.4) When liposomes are in a gel state, 1,6-diphenyl-1,3,5-hexatriene (DPH), a fluorescent probe, is embedded in the lipid bilayers.5) This means that the DPH mobility is restricted. As a result, the polarization of fluorescence emission from the DPH is the same as that of the excitation light, resulting in fluorescence anisotropy. On the other hand, when heat is applied, the fluidity of the lipid bilayers increases, thus increasing the DPH mobility. As a result, the fluorescence anisotropy of the DPH emission is lost.
In the study described in this application note, the temperature dependence of fluorescence anisotropy for DPH in liposome solution was investigated using a JASCO FP-8550 spectrofluorometer. Prior to fluorescence anisotropy measurements, liposomes were observed using a desktop scanning electron microscope (SEM) and an imaging particle size analyzer to determine their shapes.
Experimental
Samples
The liposome/DPH solution was prepared by adding 10 µL of Solution B to 10 mL of Solution A.
(A) 136-µM Liposome aqueous solution
– COATSOME® MC-6060 (DPPC) (NOF America Corporation)
(B) 0.5-µM DPH in DMSO solution
– 1,6-Diphenyl-1,3,5-hexatriene (042-08021, FUJIFILM Wako Pure Chemical Corporation)
– Dimethyl sulfoxide (DMSO), Spectrosol®, (349-01025, FUJIFILM Wako Pure Chemical Corporation)
Instruments
Phenom™ ProX: Desktop SEM (Thermo Fisher Scientific, Inc.)
IF-3200S: Imaging particle size analyzer (JASCO INTERNATIONAL CO., LTD.)
FP-8550: Spectrofluorometer
EHC-113: Peltier thermo (air-cooled) cell holder with stirrer
FDP-837: Automatic polarizer
FWAP-175: Fluorescence polarization measurement program
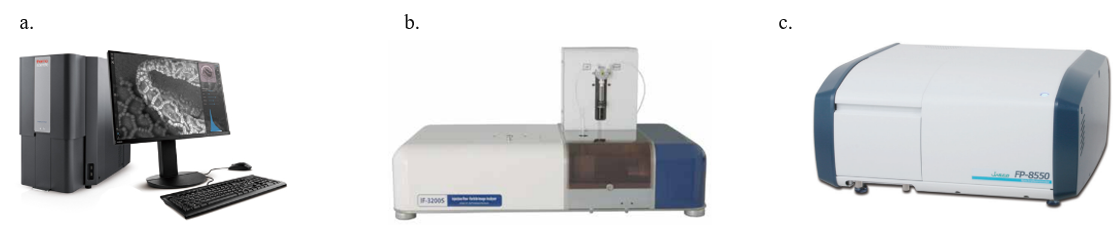
Fig. 1 a) Phenom ProX, b) IF-3200S, c) FP-8550
Conditions (fluorescence anisotropy)
Ex bandwidth: 5 nm
Em bandwidth: 5 nm
Ex wavelength: 357 nm
Em wavelength: 430 nm
Response: 2 sec
Interval: 0.2 ºC
Ramp rate: 0.5 ºC/min
Temperature range: 25-55 ºC
Optical pathlength: 10 mm
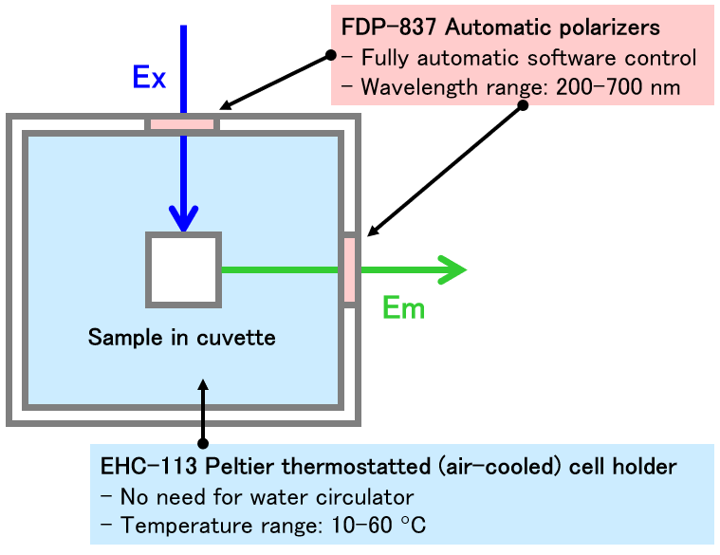
Fig. 2 Schematic diagram of sample compartment (FP-8550)
Keywords
Lipid nanoparticles (LNPs), liposome, drug delivery system (DDS), oligonucleotide therapeutics, mRNA therapeutics, oligonucleotides, fluorescence depolarization, fluorescence anisotropy
Results
Observations of liposomes
The SEM image of liposomes in Fig. 3a shows that the shape of the liposomes was spherical, and their size varied between individuals. The size distribution was determined using an imaging particle size analyzer. The measurements were performed twice, and the results were found to be consistent. The area-equivalent diameter showed two peaks at 1.8 µm and 1.6 µm (Fig. 3b). There were some individual liposomes with an elliptic shape, but most showed 50% or higher P-circularity (Fig. 3c).
Fluorescence anisotropy of DPH
The fluorescence anisotropy of a liposome/DPH solution was monitored while heating from 25 to 55 ºC (-Heating) and then cooling to 25 ºC (-Cooling) (Fig. 3d). The polarization of the incident (excitation) light and the detected fluorescence were controlled by automatic polarizers. The temperature was controlled by an air-cooled Peltier thermostatted cell holder without the need for a water circulator. The fluorescence anisotropy showed a large decrease or increase at 40 ºC during heating or cooling, respectively. This indicates that a transition between the gel and fluid phases occurred at around 40 ºC.
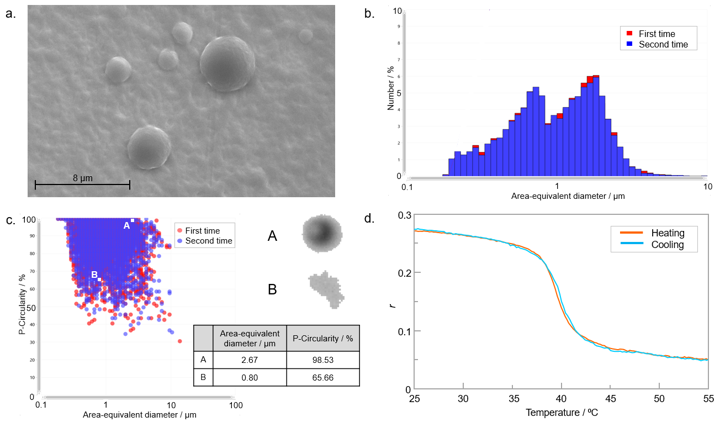
Fig. 3 a) SEM image of liposomes, b) particle size distribution (relative number vs. area-equivalent diameter), c) P-circularity vs. area-equivalent diameter, d) Temperature dependence of fluorescence anisotropy of DPH in liposome solution.
Conclusion
The shape and size distribution of liposomes were examined using a desktop SEM and an imaging particle size analyzer. A transition between the gel and fluid phases was observed by fluorescence anisotropy using a spectrofluorometer, and the transition temperature was estimated. For fluorescence anisotropy measurements, the use of automatic polarizers and the air-cooled Peltier thermostatted cell holder made it easy to obtain the data. This convenient system can potentially be applied to early-stage screening of a large number of LNP candidates for drug delivery systems.
Appendix – Fluorescence Anisotropy –
Fluorescence anisotropy
Fluorescence anisotropy is known to reflect the rotational mobility of a fluorescent molecule during excitation and emission. In principle, if the molecule does not rotate in the time period between excitation and emission, the polarization of the fluorescence emission will remain the same as that of the excitation light. On the other hand, if the molecule rotates in this time period, the emission light will be depolarized. The more the molecule rotates, the greater the reduction in polarization. Exploiting this phenomenon, fluorescence anisotropy is used to determine the rotational mobility of fluorescent molecules. The rotational mobility depends on the molecular size, factors such as the viscosity of the environment surrounding the molecule, and the molecular shape. In biology, this information is utilized to analyze the molecular size, the degree of binding, and conformational changes of biopolymers such as proteins and nucleic acids.
Principles of fluorescence anisotropy
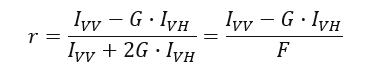
When a fluorescence molecule is excited by vertically polarized light, the total fluorescence intensity (F) is:

G: G factor
IVV: vertically-polarized fluorescence intensity
IVH/: horizontally-polarized fluorescence intensity
The fluorescence anisotropy (r) is defined as the normalized fluorescence intensity difference between vertically and horizontally polarized light after vertically polarized excitation:
Evaluation of G factor
The sensitivity of the emission monochromator in a spectrofluorometer differs depending on the polarization direction. Therefore, it is necessary to determine the correction factor G to take this into account when detecting the emission light. The G factor is evaluated by exciting the sample with horizontally polarized light, and is expressed as the ratio of the intensity of vertically polarized emission (IHV) to horizontally polarized emission (IHH):

Measurement of IVV, IVH
When measuring fluorescence anisotropy, the sample is excited by vertically polarized light, and the fluorescence intensity of the vertically and horizontally polarized emission is detected.

Fig. A Fluorescence anisotropy measurement a) G factor, b) IVV, IVH
References
- Editorial: Nat. Rev. Mater. 6, 99 (2021). DOI: 10.1038/s41578-021-00281-4
- R. Tenchov, R. Bird, A. E. Curtze, Q. Zhou: ACS Nano 15, 16982 (2021). DOI: 10.1021/acsnano.1c04996
- P. Tran, T. Weldemichael, Z. Liu, H. Li: Pharmaceutics 14, 342 (2022). DOI: 10.3390/pharmaceutics14020342
- C. Poojari, N. Wilkosz, R. B. Lira, R. Dimovac, P. Jurkiewiczd, R. Petkab, M. Kepczynskib, T. Róga: Chem. Phys. Lipids 223, 104784 (2019). DOI: 10.1016/j.chemphyslip.2019.104784
- P. Neves, S. C. Lopes, I. Sousa, S. Garcia, P. Eaton, P. Gameiro: J. Pharm. Biomed. Anal. 49, 276 (2009). DOI: 10.1016/j.jpba.2008.11.026


