Introduction
HPLC is widely used for quantitative analysis and quality evaluation of sugars in food. Depending on the type of sugar which is separated, various chromatography such as hydrophilic interaction chromatography (HILIC), size exclusion chromatography (SEC), ion-exchange chromatography and ligand-exchange chromatography are used. Since the sugar does not have the absorption in the UV region, refractive index detector (RI detector) or evaporative light scattering detector (ELSD) are used generally. Or, the sugars can also be detected by derivatization for attaching fluorophore or chromophore. This article shows the fluorescence detection example by post-column derivatization.
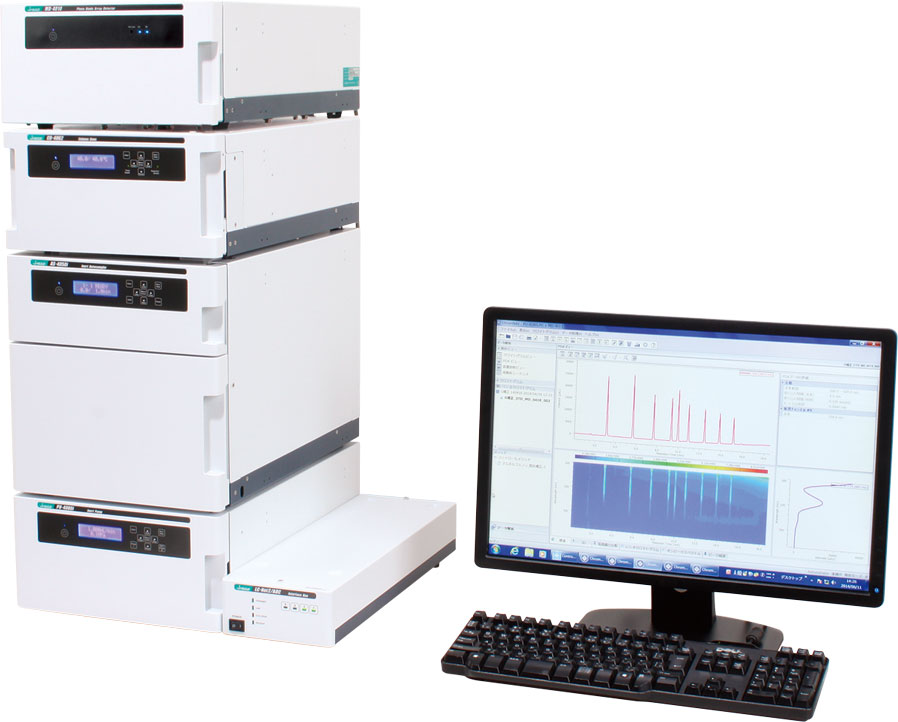
LC-4000 HPLC system
Experimental
In the case that the sample includes the contaminants during the HPLC analysis of sugars, proper qualitative and quantitative analysis cannot be performed because RI detector measures the contaminants as well as the target components. In addition, even when the amount of target component is very small, it cannot be performed because the sensitivity of its detector is not enough.
Although sugars do not own the chromophore, it can be turned to the derivative with fluorophore by reaction of guanidine and metaperiodic acid. Applying its properties to HPLC enables to perform highly sensitive and selective detection. This article shows the fluorescence detection result of sugars by post-column derivatization (the method that the sample is derivatized after injecting it to the column), whose reproducibility is good. The anion exchange column was used because its column can separate more sugars.
Chromatographic conditions
Column: Finepak GEL SA-121 (6.0 mmI.D. × 100 mmL)
Eluent A: 0.25 M borate buffer (pH 8.0)
Eluent B: 0.60 M borate buffer (pH 9.0)
Gradient: Low pressure gradient elution
Eluent flow rate: 0.5 mL/min.
Column temperature : 80 ºC
Reagent: 100 mM borate + 50 mM guanidine hydrochloride + 0.5 mM sodium metaperiodate (pH 8.0, adjust with NaOH) / acetonitrile (80/20)
Reagent flow rate: 0.5 mL/min
Reaction temperature : 150 ºC
Detection: Fluorescence detector (excitation: 310 nm, emission: 415 nm)
Results
Figure 1 shows the chromatogram of standard sugars, and Figure 2 and 3 show the chromatograms of extract of vegetable stew and the condensed noodle soup, respectively. Each component could be separated with good resolution.
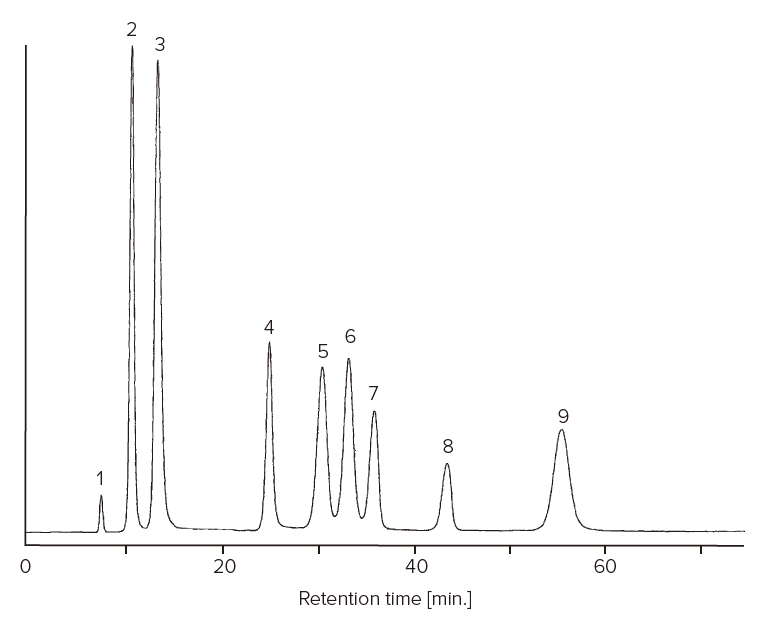
Figure 1. Chromatogram of standard sugars (1: Sucrose, 2: Maltose, 3: Lactose, 4: Mannose, 5: Fructose, 6: Galactose, 7: Sorbitol, 8: Mannitol, 9: Glucose)
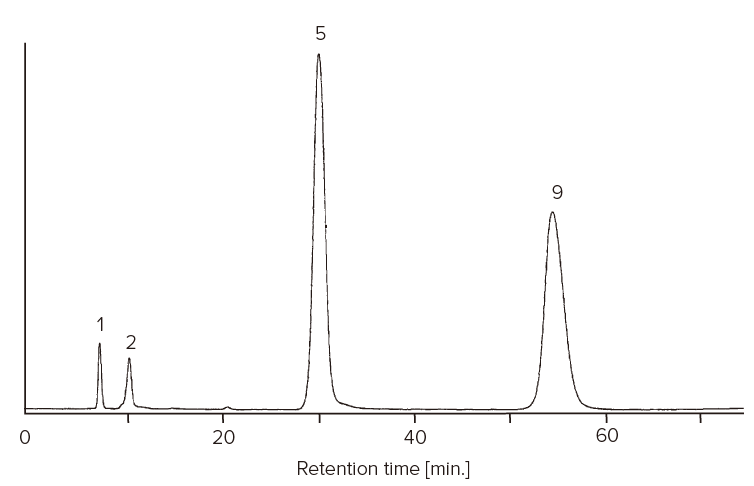
Figure 2. Chromatogram of extract of vegetable stew (Peak numbers is the same as in Figure 1.)
Preparation:
Extract was filtrated with 0.45 μm membrane, an then it was diluted 5 times with water. After that, 20 μL was injected to HPLC.
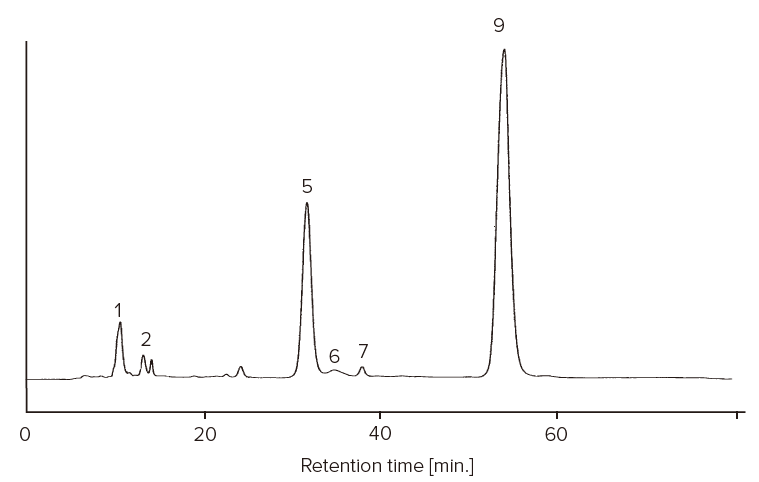
Figure 3. Chromatogram of the condensed noodle soup (Peak numbers is the same as in Figure 1.)
Preparation:
The condensed noodle soup was added to hot water (60 °C), and it was ultrasonicated for 1 minutes. After it was warmed in hot bath (65 °C) for 5 minutes, it was left for 30 minutes at room temperature. And then, the supernatant (10 mL) was collected, and it was applied to centrifugal separation (4000 rpm, 10 minutes). 6 % perchloric acid (1 mL) and chloroform (1 mL) was added to the obtained supernatant (1 mL), and it was stirred. After that, the obtained supernatant was filtrated with 0.45 μm membrane, and 20 μL was injected to HPLC.


