Introduction
JASCO can provide microscopic spectrophotometer, which is capable to analyze micro sample/area by both transmission/reflection measurement in the region from UV to Near IR. It can be applied to characterization of micro sized sample/area and also impurity analysis.
Recently, this type of technology is getting very popular in bioscience field such as the analysis of localized constituents in living cells.
Volvox which has localized cellular density due to its internal daughter colonies, was measured to obtain absorption spectra and fixed-wavelength mapping.
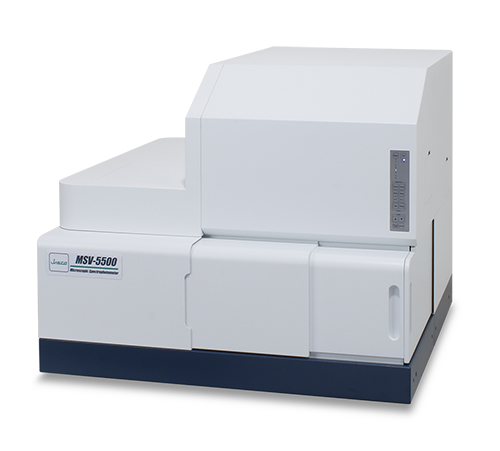
MSV-5500 UV/VIS microscopic spectrophotometer
Experimental
Sample
Water containing Volvox was dropped onto a microscope slide glass and dried. (Figure 1)
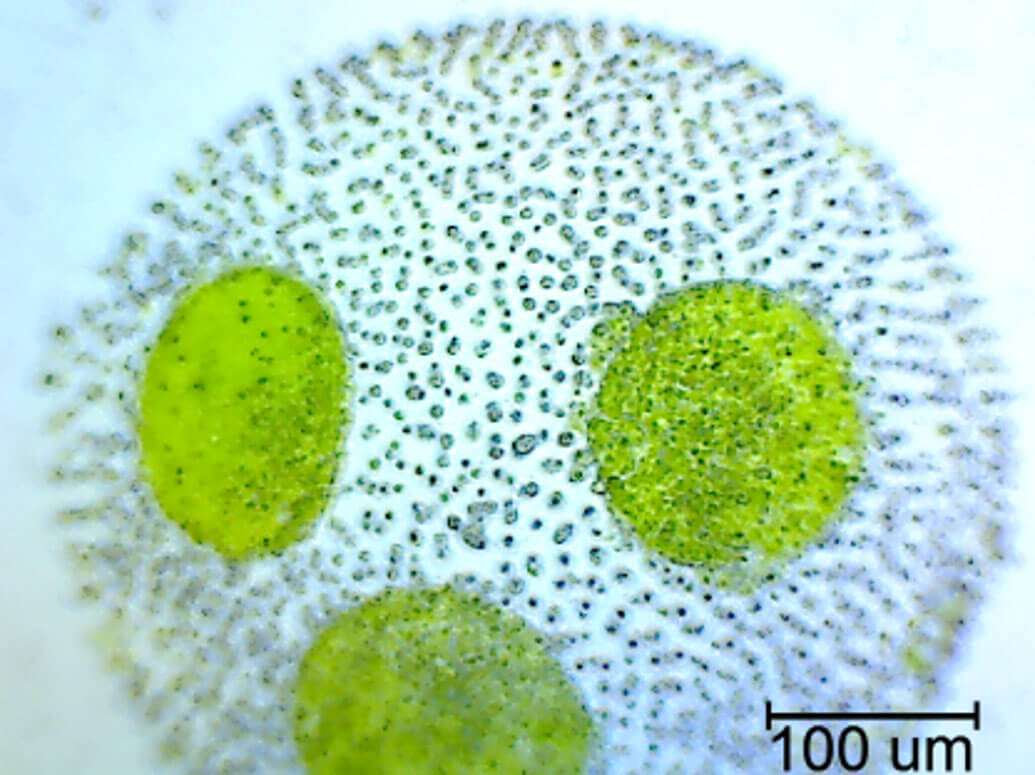
Figure 1. Observation Image of dried Volvox
Keywords
microscopic measurement, biochemical, spectrum imaging (mapping)
Results
Spectra measurement
One of the daughter colonies inside of mother colony is measured to obtain absorption spectrum.
<Measurement parameters>
Spectral bandwidth (UV/Vis): 5.0 nm
Scanning speed: 1000 nm/min
Response: Quick
Data pitch: 1 nm
Cassegrain objective: 16×
Aperture: 50 µmφ
<Results>
Measured absorption spectrum is shown in Figure 2.
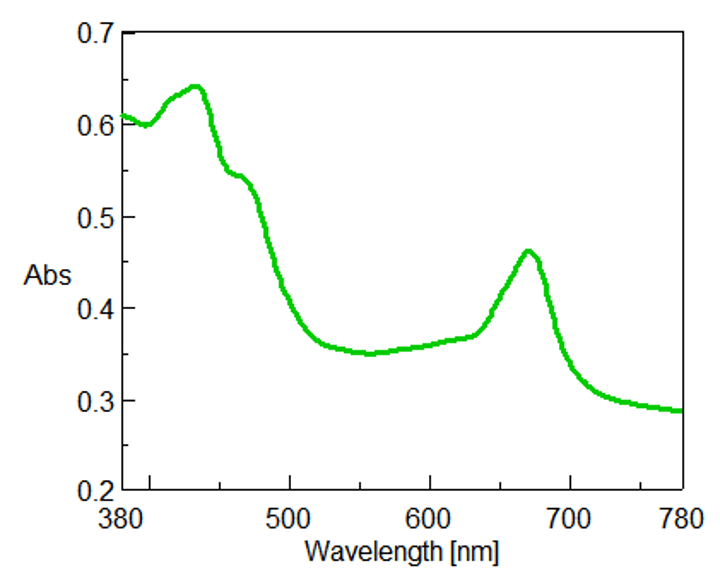
Figure 2. Absorption spectrum of Volvox
Chlorophyll a and chlorophyll b are well known as major chlorophylls included inland plants and green alga 1),2) and those absorption spectra are shown in Figure 3.2)
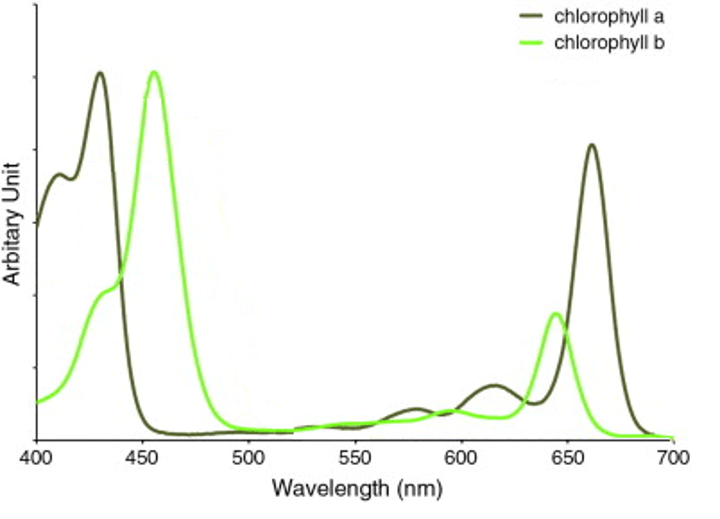
Figure 3. Absorption spectra of chlorophylls2) (with Acetone solvent )
This published data on the literature is measured under acetone solvent condition, and the peak positions of those chlorophylls are slightly different depending on the solvent used, but it’s only approx. 2-7 nm difference in wavelength. Comparing the spectra of chlorophylls with Volvox spectrum, it is assumed that chlorophyll a and b are included in Volvox.
Fixed Wavelength Mapping Measurement
Fixed wavelength mapping measurement was executed at 672 nm since the peak was observed at this 672 nm by the absorption spectrum measurement. Mapping measurement at specific fixed wavelength makes it possible to generate high speed mapping data.
<Measurement parameters>
Measurement Mode: Lattice measurement
Measurement wavelength: 672 nm
Response: Fast
Spectral Bandwidth: 2 nm
Cassegrain objective: 16×
Aperture: 30 µmφ
Measurement interval: 30 µm
<Results>
Observation image and its color-coded diagram by mapping measurement are shown as below and it is confirmed that the area with higher cellular density in observation image is exactly in good agreement with the area of higher absorbance in color-coded diagram.
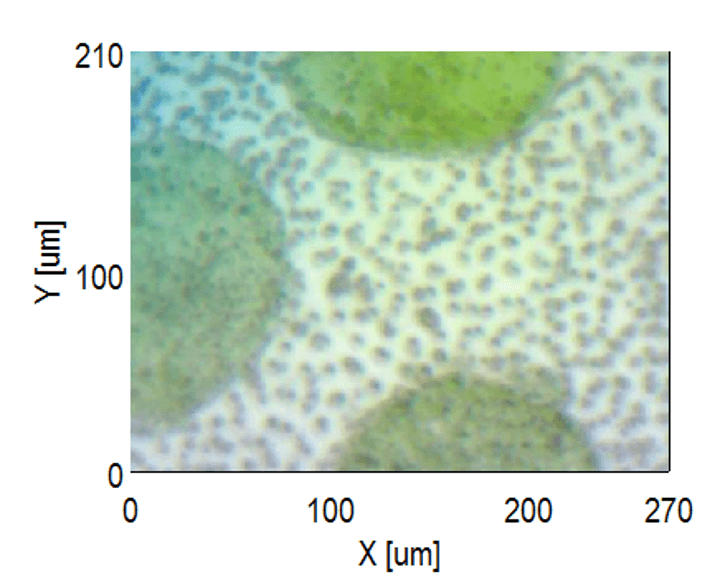
Figure 4. Observation Image
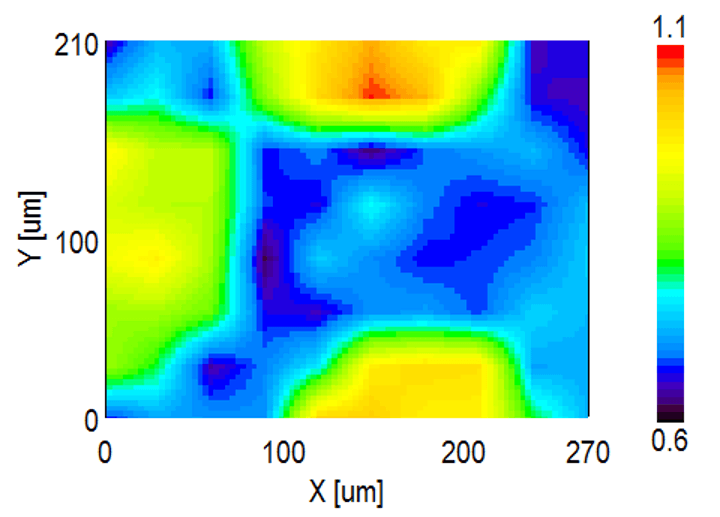
Figure 5. Color-coded diagram of mapping measurement
References
1) Hiroshi Terayama ed., Kisoseikagaku (Revised Edition). Shoukabou, 1970, p.130-131.
2) Biochimica et Biophysica Acta (BBA) – Bioenergetics. 2011, 1807, 968-976.
Related Posts:
 Evaluation of Reflectance of Microlens Surface using…
 Vibrational Circular Dichroism Spectrometer based on…
 Measurement of alanine powder using DRCD with…
 Fluorescence Observation and Foreign Materials…
 GPC/SEC measurement of Polystyrene Oligomers using…
 Evaluation of Spectral Characteristics of Dichroic…