Introduction
In recent years, biodiesel fuel made from vegetable oils or cooking oil waste by a transesterification process has been receiving much attention as an alternative energy to processed fossil fuels. The chemical process of transesterification from vegetable oil to FAME is shown in Figure 1.

Figure 1. Reaction pathway from vegetable oil to FAME
The ASTM International and the EN European standards stipulate the determination of fatty acid methyl ester (FAME) in diesel fuel oil and many countries use either neat or blended FAME as biodiesel fuels in accordance with these standards. Since the guidelines differ from country to country for the ratio of FAME blended in diesel oil and other conditions, a simple quantitative analysis method for the determination of FAME in diesel fuel is imperative. The test method of FAME by FT/IR for both the ASTM and the EN standard are as below.
Standard test method of FAME by FTIR (ASTM D7371)
Measurement method: ATR method
Wavenumber range: 4000-650 cm-1
Software: PLS quantitative program
Instruments: JASCO FT/IR-4600 FT/IR Spectrometer
Resolution: 4 cm-1
Accumulation: 32 times
Accessory: ATR PRO ONE (ZnSe)
Standard test method of FAME by FTIR (EN14078)
Measurement method: Transmittance using liquid cell (window: CaF2, pathlength: 0.5 mm)
Wavenumber range: 4000-400 cm-1
Software: Quantitative analysis program
Instruments: JASCO FT/IR-4600 FT/IR Spectrometer
Resolution: 4 cm-1
Accumulation: 32 times
The ASTM standard requires the ATR method and the EN test method specifies a transmission method. FAME derived from soybean oil used in European industry was used as a sample and a calibration curve model compliant with each standard method was derived. The measurement results are as below.
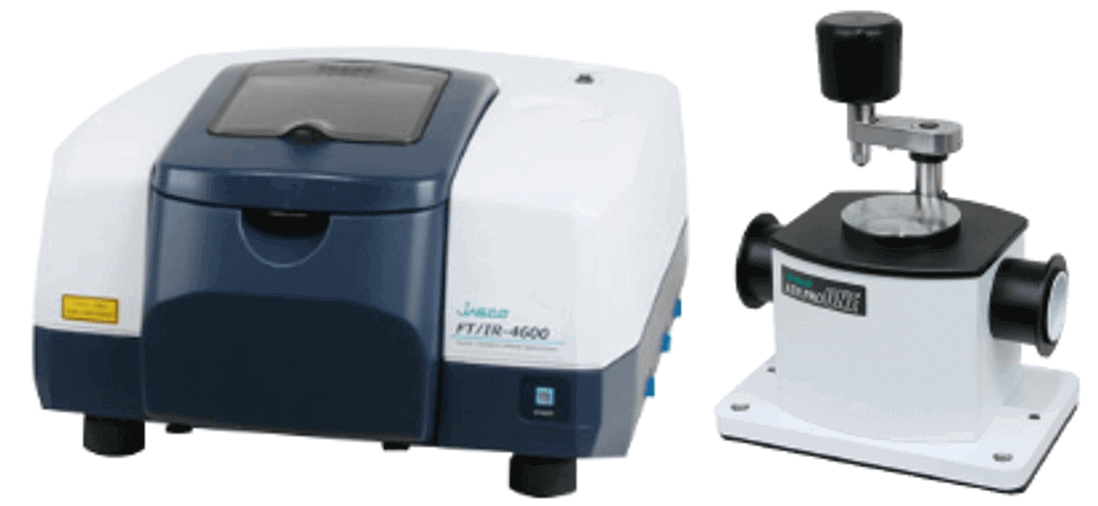
FTIR spectrometer with ATR accessory (FT/IR-4600 + ATR PRO ONE)
Results
Quantitative Analysis of FAME for ASTM
Figure 2 (left) outlines the infrared spectra of FAME and diesel fuel measured with the ATR method. The PLS calibration curve derived from the standards are shown in Figure 2 (right). The PLS calibration curve was constructed according to the conditions outlined by ASTM using standards that contained the FAME component in the range of 1-10 % and using the ATR method. The results demonstrate that PLS and the ATR method is a good combination, which makes reliable results possible without diluting the sample.
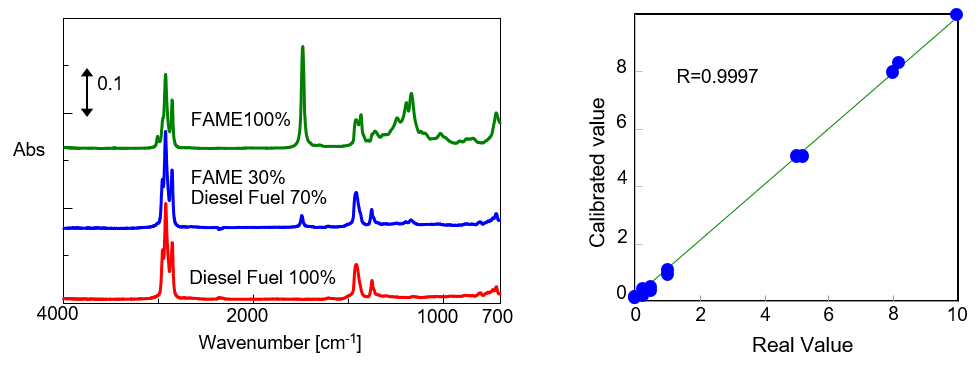
Figure 2. IR spectra of FAME and diesel oil (left) and PLS calibration curve of FAME (right, calculation range: 1800-1692, 1327-940 cm-1, number of factors: 3)
Quantitative Analysis of FAME for EN
Figure 3 (left) shows the overlaid peaks for FAME around the 1750 cm-1 band from the spectra of the standards obtained by the transmittance method. The standard samples were prepared by mixing 0 – 10 % FAME with diesel oil and then diluted 10X in cyclohexane. The calibration curve for the FAME concentration was made by measuring the peak at 1750 cm-1 with the standard Quantitative Analysis program as outlined in Figure 3 (right). The results indicate that a linear calibration model was created for the EN standard although the method for the EN standard requires dilution of the sample in cyclohexane.
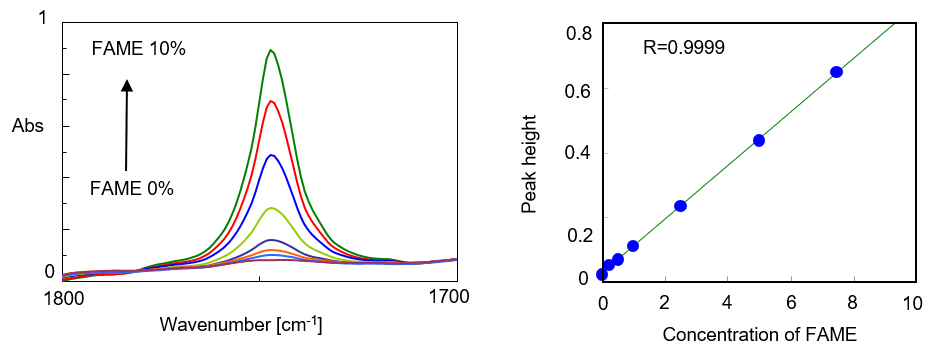
Figure 3. Peaks of FAME (left) and EN calibration curve of FAME (right)
Related Posts:
 Base Material and Dye Analysis - Combined Raman and…
 Combined Analysis of Thermochromic Materials -FT-IR…
") Analysis of Ultraviolet Absorbers in Sunscreen Cream…
Analysis of Ultraviolet Absorbers in Sunscreen Cream… Development and Applications of Full-Vacuum FT-IR…
 Analysis of CBN-Binding DNA Aptamer using CD Spectroscopy") Higher-Order Structure (HOS) Analysis of CBN-Binding…
Higher-Order Structure (HOS) Analysis of CBN-Binding… Polarized Raman Analysis of Polymer Chain…