Introduction
Infrared spectroscopy is an effective technique for component analysis and interaction analysis of biological samples such as proteins, sugars and lipids. FTIR spectroscopy can be used to measure solid and liquid samples for the estimation secondary structure analysis in proteins.
In this application note we result from the ATR PRO PENTA, an optimal system for measuring low concentration aqueous solutions. The ATR PRO PENTA has been designed with an optimum number of reflections so that water absorption is not saturated. Furthermore, the use of an FTIR spectrometer with highly sensitive MCT detector allows measurement of samples with very low sample concentrations, which were previously difficult to measure accurately.
Features of ATR PRO PENTA
– ATR easy sampling accessory.
– Unique pentagonal prism shape.
– Germanium prism with 14 reflections (Figure 1).
– High sensitivity measurement in combination with an MCT detector.
– Sample volume of only a few microliters.
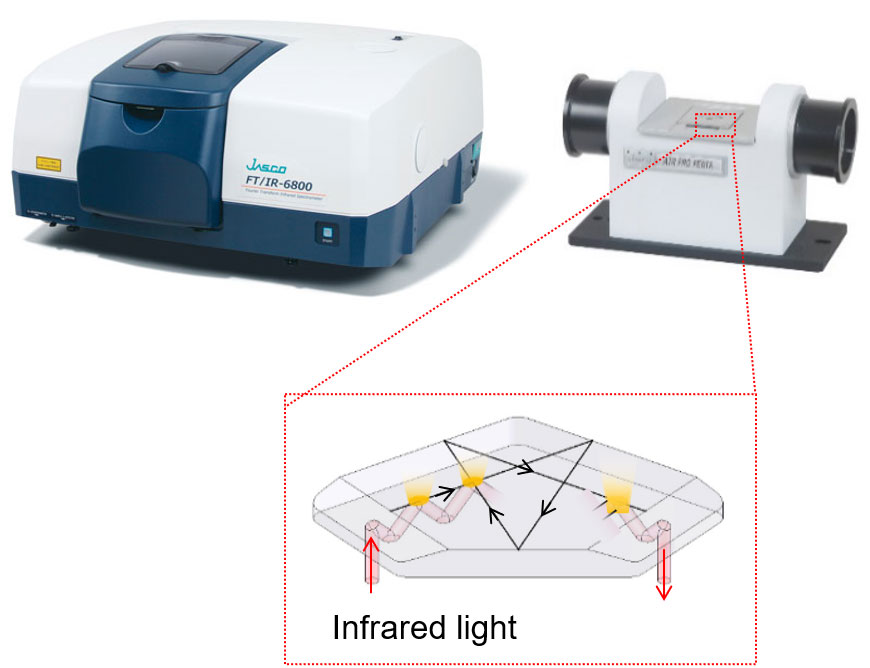
Figure 1 FT/IR-6800 and ATR PRO PENTA (Overview and Prism image)
Experimental
The following three protein aqueous solutions (0.01% w / v) were prepared, and IR spectra measured using an ATR PRO PENTA. Secondary structure estimation (SSE) was performed by taking the difference spectrum with water.
Samples
1: Lysozyme (Chicken Egg White)
2: Concanavalin A
3: Trypsin inhibitor Kunitz
Measurement conditions
Main unit: FT/IR-6800
Accessory: ATR PRO PENTA
Detector: MCT (PV type)
Resolution: 4 cm-1
Accumulation: 90 times
Results
Figure 2 shows the IR spectrum of 0.01% Lysozyme aqueous solution and the difference spectrum with water. In the difference spectrum, protein amide I and amide II bands were clearly observed.
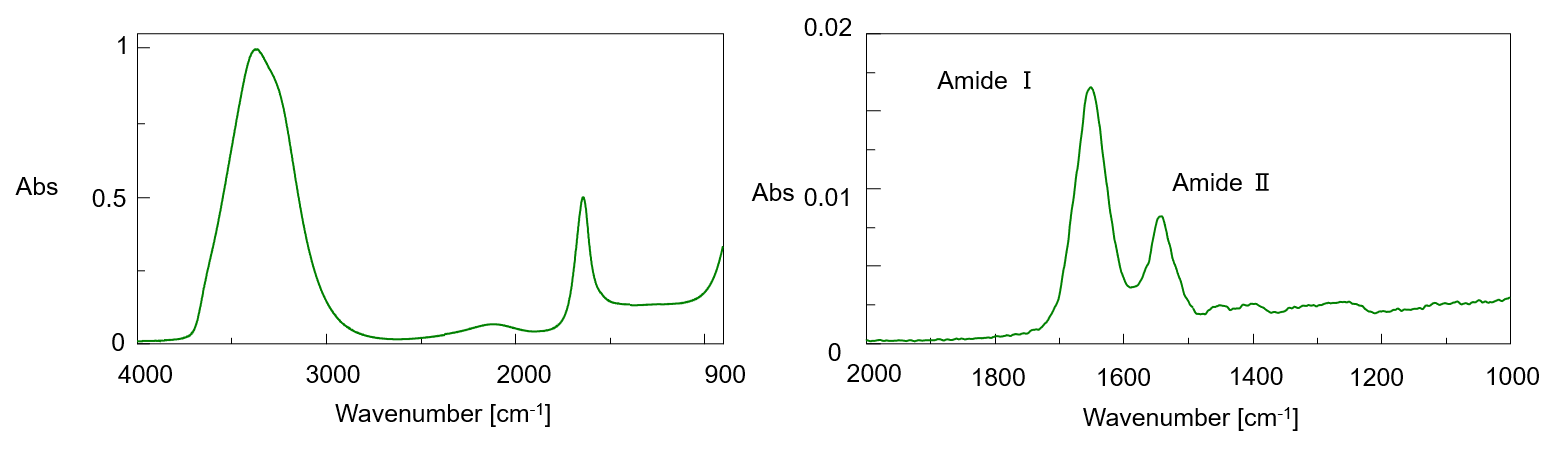
Figure 2 IR Spectrum of 0.01% aqueous Lysozyme (left), difference spectrum (before ATR correction) (right)
The SSE result of the amide I band of the ATR-corrected difference spectrum and the reference value*1 by X-ray diffraction are shown. Each sample was measured in triplicate and all were in good correlation with the reference value. From this result, it was shown that the ATR PRO PENTA is effective*2 for analysis of low concentration protein aqueous solutions.
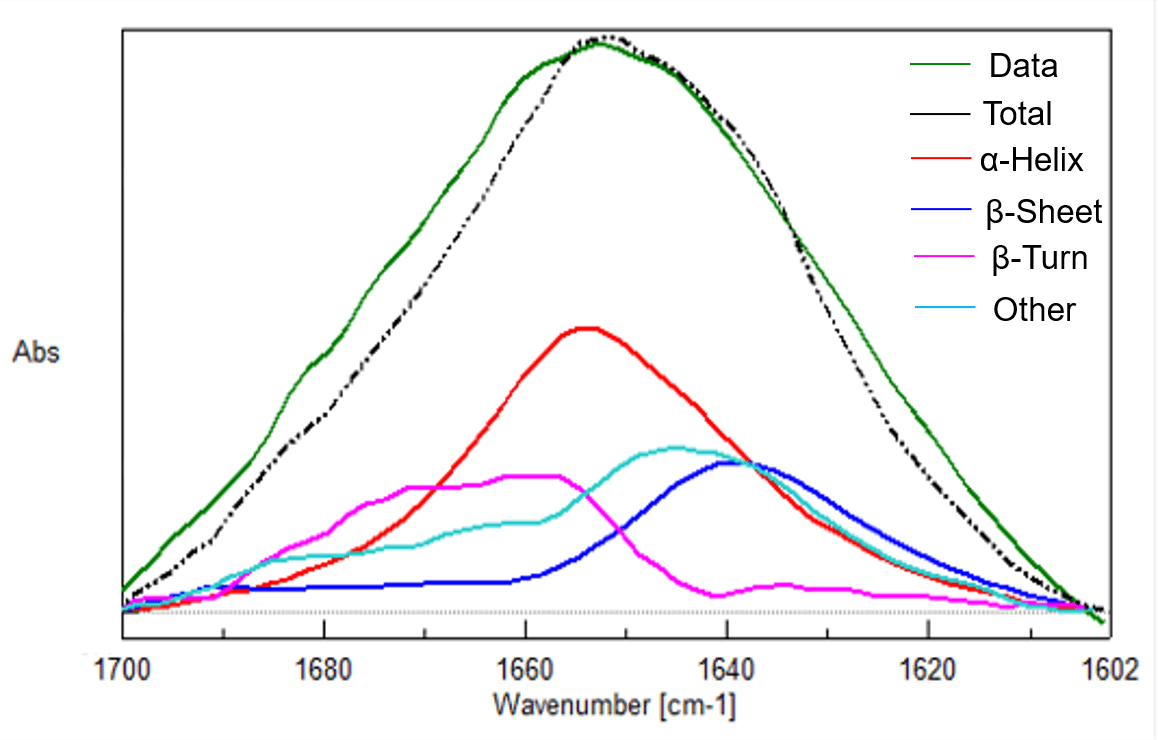
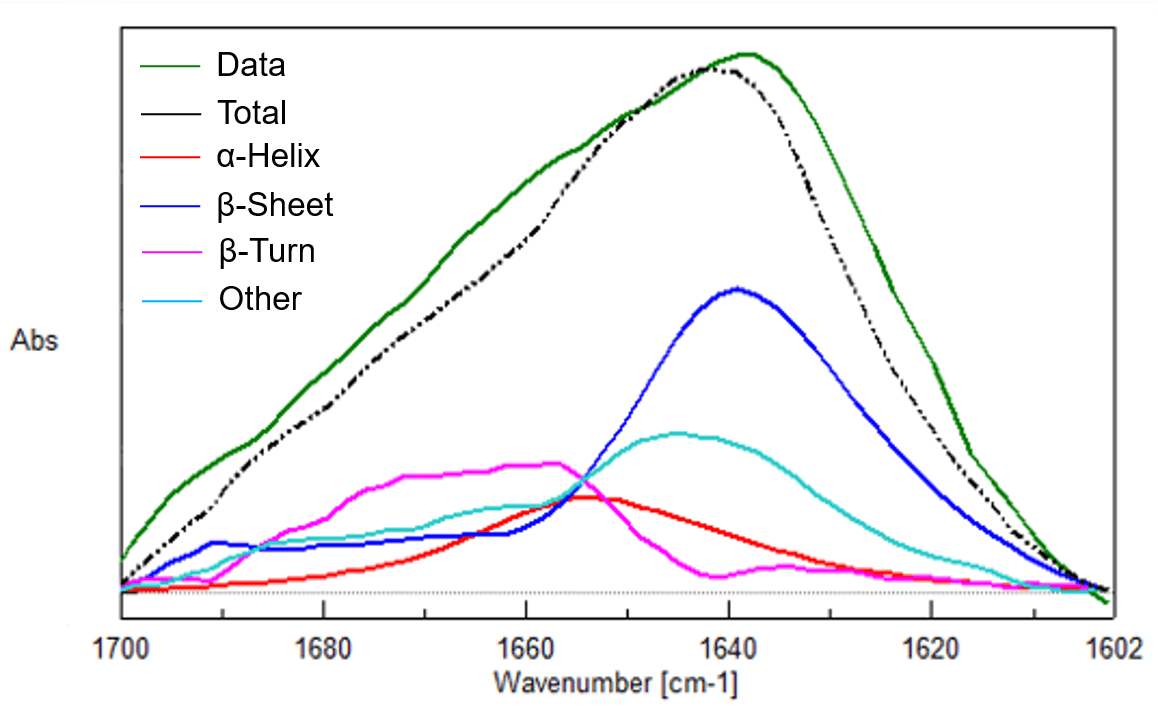
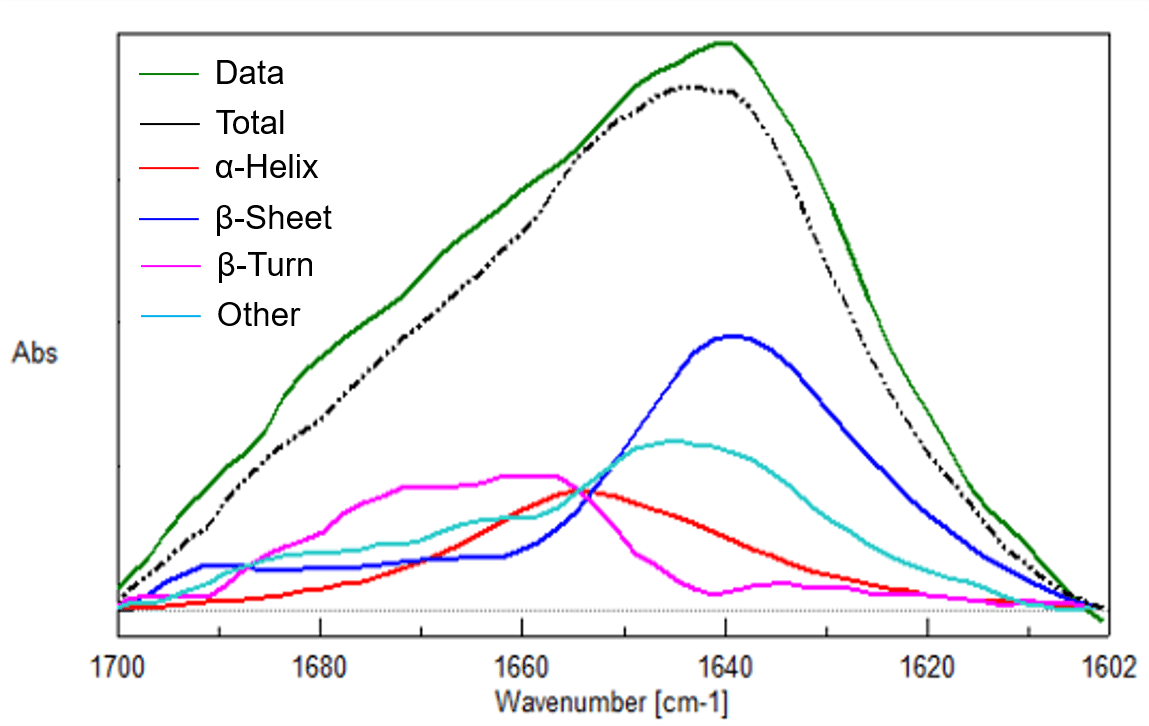
Figure 3 Spectra of three protein aqueous solutions (0.01% w/v, Top: Lysozyme (Chicken Egg White), Middle: Concanavalin A, Bottom: Trypsin inhibitor Kunitz)
Table 1. Results of SSE analysis of three protein aqueous solutions
Lysozyme (Chicken Egg White)
| α-Helix | β-Sheet | β-Turn | Other | |
|---|---|---|---|---|
| IR-1 | 36 % | 16 % | 24 % | 24 % |
| IR-2 | 34 % | 19 % | 23 % | 24 % |
| IR-3 | 33 % | 20 % | 23 % | 24 % |
| X-ray | 36 % | 10 % | 36 % | 19 % |
Concanavalin A
| α-Helix | β-Sheet | β-Turn | Other | |
|---|---|---|---|---|
| IR-1 | 11 % | 43 % | 22 % | 24 % |
| IR-2 | 12 % | 42 % | 22 % | 24 % |
| IR-3 | 10 % | 45 % | 22 % | 23 % |
| X-ray | 3 % | 44 % | 25 % | 28 % |
Trypsin inhibitor Kunitz
| α-Helix | β-Sheet | β-Turn | Other | |
|---|---|---|---|---|
| IR-1 | 15 % | 33 % | 25 % | 27 % |
| IR-2 | 15 % | 36 % | 23 % | 26 % |
| IR-3 | 15 % | 36 % | 23 % | 26 % |
| X-ray | 21 % | 26 % | 24 % | 29 % |
References
*1 Sarver, R. W., Krueger, W. C., 1991. Anal. Biochem., 194, 89-100.
*2 Depending on the type of protein, it may adsorb on the prism and affect the results
Related Posts:
 Quantitation of Glucose in Aqueous Solution using…
 Optical Rotation Measurement for High-concentration…
 Analysis of CBN-Binding DNA Aptamer using CD Spectroscopy") Higher-Order Structure (HOS) Analysis of CBN-Binding…
Higher-Order Structure (HOS) Analysis of CBN-Binding… Analysis of Electronic Structure and Orbital Angular…
 spectroscopy") Analysis of electronic structure of phthalocyanine…
Analysis of electronic structure of phthalocyanine… Higher Order Structure, Stability, and Similarity…