Introduction
Therapeutic antibodies have been dramatically expanding their market over the past decade and become one of the major therapeutics proteins. Since therapeutic antibodies show a high specificity to certain cells or proteins, they are expected to be an effective method for malignant tumors or other unmet medical needs.
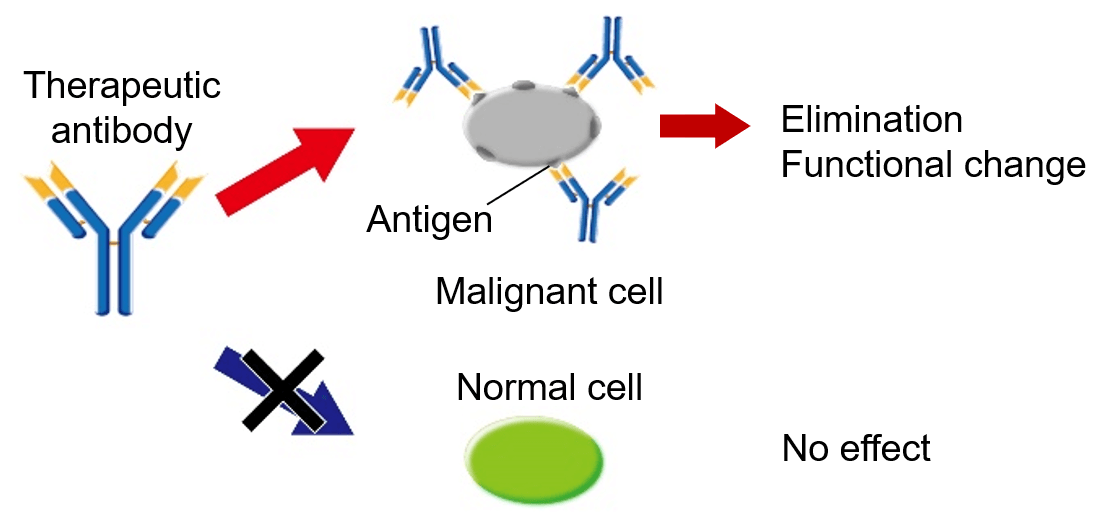
Figure 1. Schematic diagram of how therapeutic antibody works
Circular dichroism (CD) spectroscopy is known to be an easy and robust method to analyze the higher-order structure (HOS) of antibody. It is used to check the HOS comparability/homogeneity before and after a change in the manufacturing process as specified in ICH Q5E1), and to compare the HOS between innovators and biosimilars as described in FDA2), EMA3) and other guidelines4,5). In addition, CD spectroscopy is a well-known technique to evaluate secondary structure content.
Therapeutic antibodies are prescribed by injection in solution form, and most of them are highly concentrated (> 10 mg/mL). It is known that proteins that make up antibodies behave differently at high concentrations in comparison to dilute conditions6), and therefore there is a necessary to evaluate the physical properties of therapeutic antibodies that are prescribed at high concentrations. Here, this article reports the results of secondary structure analysis by measuring the CD spectrum and absorption spectrum in the far-UV region of 5.8 to 23.1 mg/mL rabbit serum IgG solution using a CD spectrophotometer capable of simultaneous measurement of CD/absorbance and a 0.01 mm pathlength cell.
J-1500 CD spectrometer
Experimental
<System>
– CD spectrometer: To perform secondary structure analysis with high accuracy, it is necessary to convert vertical axis of CD spectrum into mean residue ellipticity (MRE) or delta epsilon using accurate concentrations or absorbance. Here, the absorbance was obtained using a CD spectrometer with excellent photometric accuracy. In order to measure the absorbance with the same accuracy as this article, it is necessary to calibrate the device in advance. Please contact your local distributor, if desired.
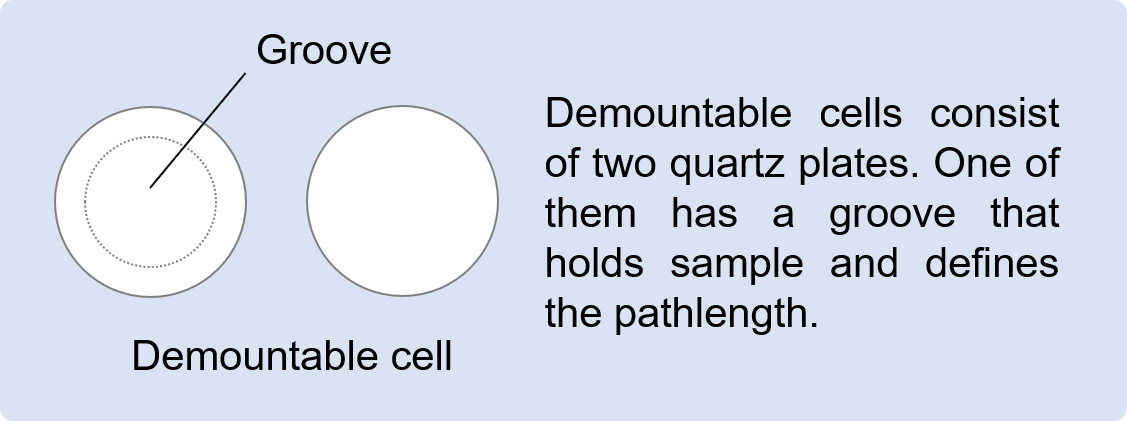
– 0.01 mm pathlength cell (demountable): To enable far-UV measurements of highly concentrated proteins, a short pathlength cell was required. In the case of short pathlength cylindrical cells, it is very difficult to take out the sample or cleaning solution from the inside of the cell due to surface tension. This is serious especially using aqueous solution, which shows relatively high surface tension, resulting in more than 30 minutes for cleaning. On the other hand, with demountable cells, cleaning is completed in a few minutes by just wiping off the samples using lab tissues containing ultrapure water or acetone.
– BeStSel: BeStSel (https://bestsel.elte.hu/) is a secondary structure analysis program developed by the research group of Dr. József Kardos at ELTE Eötvös Loránd University7,8). The algorithm deconvolves the β-sheet structure into four substructures, taking into account the twist between β-strands. This enables highly accurate secondary structure analysis of β-sheet-rich proteins such as protein aggregates, amyloid fibrils and IgG.
<Sample>
– IgG, from rabbit serum (Sigma Aldrich): 5.8, 11.4, 17.5 and 23.1 mg/mL
– 20 mM citric acid buffer (150 mM NaCl, pH 6.0)
<Measurement conditions>
Wavelength: 260–185 nm
Bandwidth: 1.0 nm
D.I.T.: 2 seconds
Scan Speed: 50 nm/min.
Data Pitch: 0.1 nm
Accumulation: 4
Path Length: 0.01 mm
Sample Volume: 2 μL (approx.)
Keywords
Therapeutic antibodies, higher-order structure (HOS), secondary structure, biosimilar, circular dichroism (CD)
Results
Using a CD spectrometer, far-UV CD and absorbance spectrum for rabbit serum IgG were obtained simultaneously (Figure 2a and 2b). The CD spectrum was converted into MRE spectrum using absorbance at 205 nm9,10) (Figure 2c).
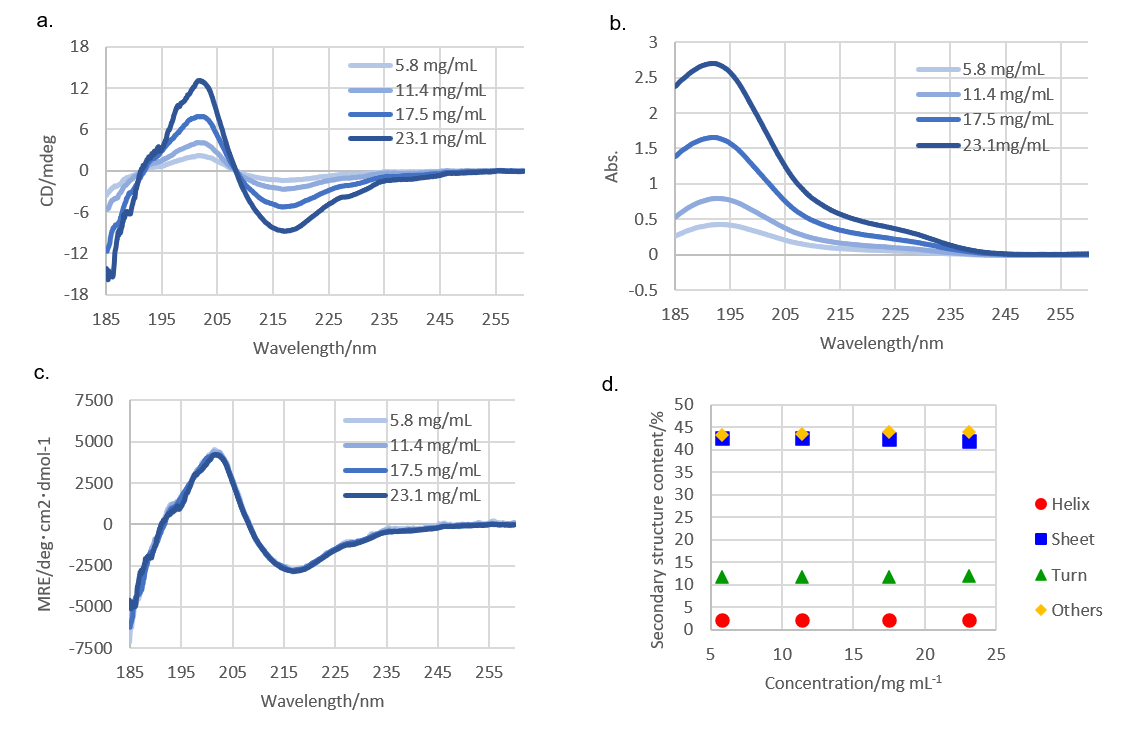
Figure 2. (a) CD spectra, (b) absorbance spectra, (c) MRE spectra, and
(d) secondary structure contents of rabbit serum IgG.
Secondary structure analysis was conducted using MRE spectrum and the BeStSel program (Figure 2d). The secondary structure content did not show significant differences among IgG concentrations of 5.8 to 23.1 mg/mL, suggesting that the IgG does not change its secondary structure in this concentration range.
Conclusion
Far-UV CD spectra of more than 5 mg/mL IgG were easily measured using a 0.01 mm demountable cell. CD spectra were normalized into MRE spectra using accurate absorbance, which was measured by CD spectrometer along with CD spectrum, for accurate secondary structure analysis. A combination of demountable short pathlength cell and a CD spectrometer realizes an efficient HOS evaluation of therapeutic antibodies.
*For better understanding of the importance of accurate spectral normalization (i.g. MRE conversion), we recommend the reading of the reference #10.
References
1) International Conference on Harmonisation (ICH) of Technical Requirements for registration of Pharmaceuticals for Human Use. ICH AUTHORIZED MANUFACTURING CHANGES FOR THERAPEUTIC MABS 833 Harmonised Tripartite Guideline Comparability of Biotechnological/ Biological Products Subject to Changes in their Manufacturing Process Q5E. 2004
2) US Food and Drug Administration. Development of Therapeutic Protein Biosimilars: Comparative Analytical Assessment and Other Quality-Related Considerations. 2019
3) European Medicines Agency. Guideline on similar biological medicinal products containing biotechnology-derived proteins as active substance: quality issues (revision 1). 2014
4) Department Biotechnol Govt. India. Guideline on similar biologics: Regulatory requirements for marketing authorization in India. 2012
5) Center for drug evaluation of China National Medical Product Administration. Technical guideline for development and evaluation of biosimilars. 2015
6) S. Uchiyama, E. Kurayuchina, K. Noda, Pharmaceutics (in Japanese), 2014, 74 12-18.
7) A. Micsonai, F. Wien, L. Kernya, Y.H. Lee, Y. Goto, M. Refregiers, J. Kardos, PNAS, 2015, 112, 3095-3103.
8) A. Micsonai, F. Wien, E. Bulyaki, J. Kun, E. Moussong, Y.H. Lee, Y. Goto, M. Refregiers, J. Kardos, Nucleic Acids Res., 2018, 46, 315-322.
9) Nicholas J. Anthis, G. Marius Clore, Protein Science, 2013, 22, 851-858.
10) A. Micsonai, E. Bulyaki, J. Kardos, Methods in Molecular Biology, 2020, 2199, 175-189.


