Introduction
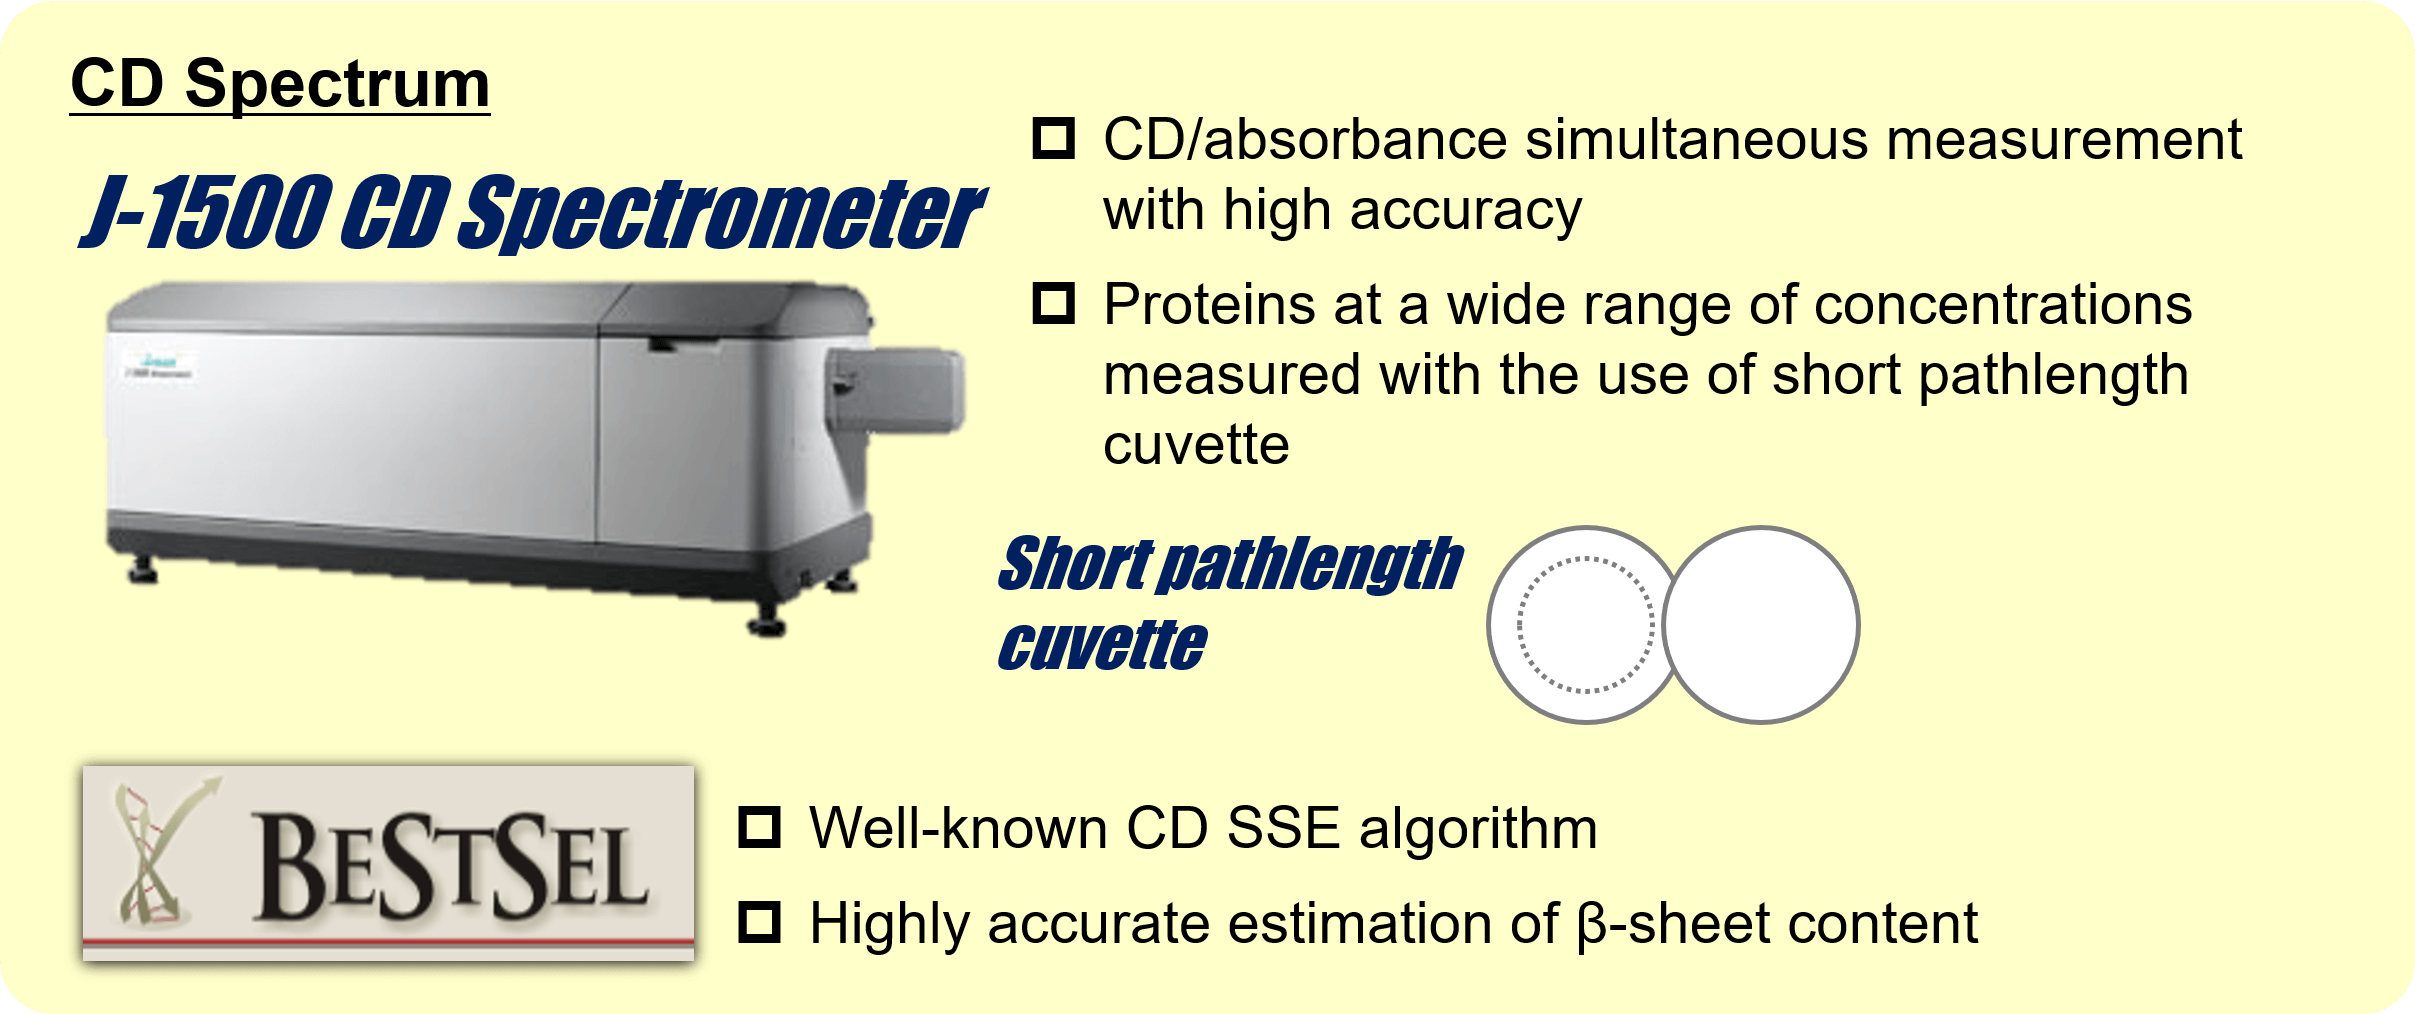
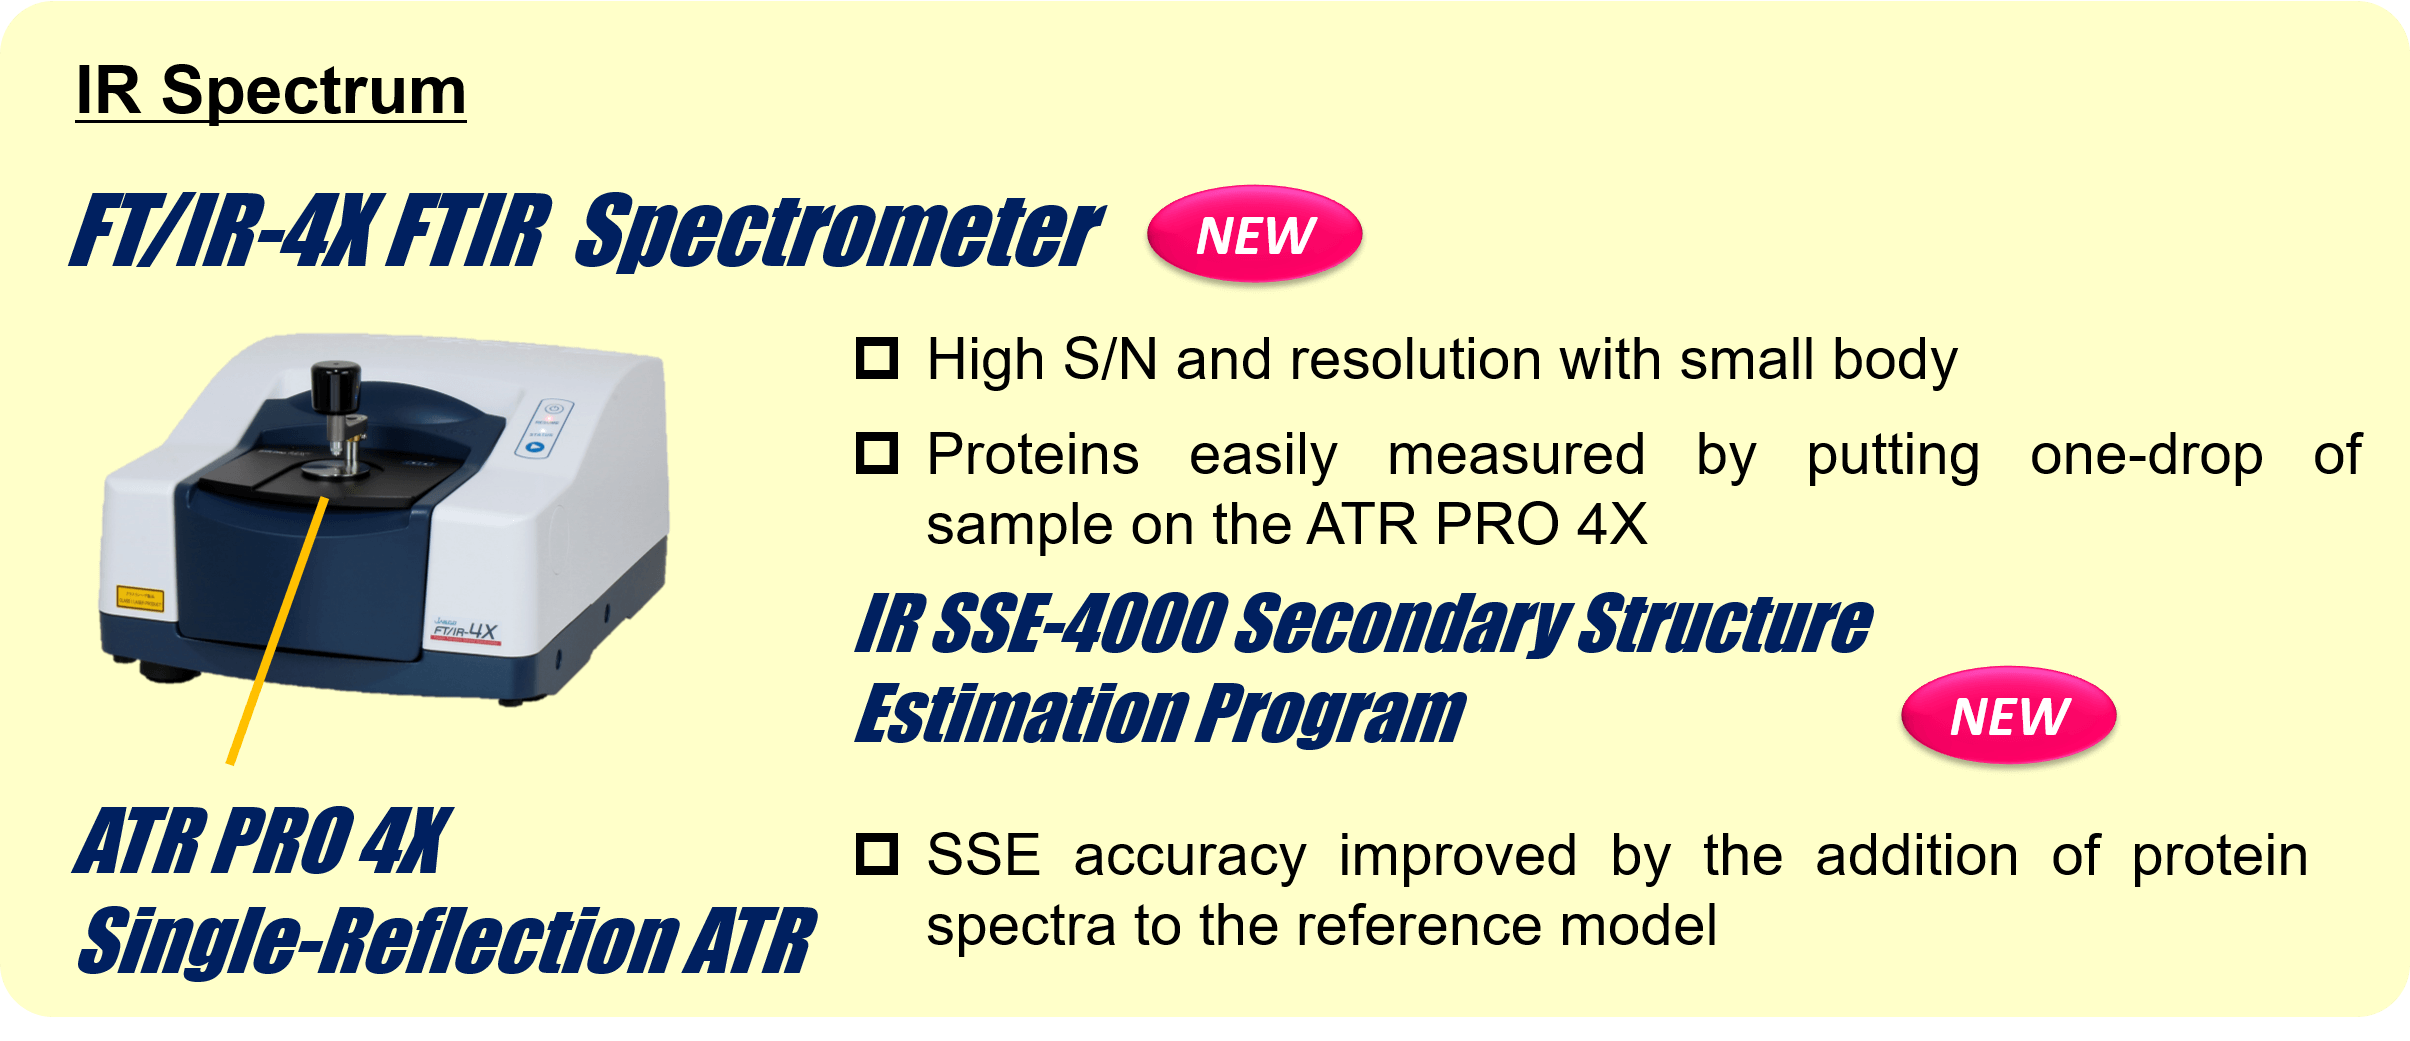
Therapeutic antibodies have been dramatically expanding their market over the past decade and become one of the major therapeutic proteins. Among different physical properties of therapeutic antibodies, higher-order structure (HOS) is an integral part of their characterization 1). One of the most well-known methods for HOS characterization is circular dichroism (CD) spectroscopy. It provides both secondary and tertiary structure information of relatively low-concentrated protein solution (< ≈10 mg/mL). Infrared (IR) spectroscopy is also a widely used method to analyze the secondary structure of proteins. It can measure not only high-concentrated protein solutions (100 mg/mL or higher), but also suspensions and solids. As different techniques for HOS analysis exist, orthogonal method using more than one technique has been suggested for full characterization of HOS 1,2). In this study, we estimated the secondary structure contents of rabbit serum IgG at concentrations of 5.8 to 23.1 mg/mL from its far-UV CD and IR spectrum. For CD secondary structure analysis (SSE), we used the J-1500 CD spectrometer which can measure CD and absorption simultaneously, and the BeStSel 3) algorithm which shows high accuracy of β-sheet estimation. For IR SSE, we used our latest FTIR spectrometer, FT/IR-4X, and our lately improved IR SSE software, IR SSE-4000. Furthermore, we also succeeded in acquiring near-UV CD spectrum of 5.8 to 156.2 mg/mL of IgG by selecting appropriate pathlengths for each concentration.
Experimental
Measurement and Analysis
Sample
- IgG, from rabbit serum (Sigma Aldrich): 5.8 to 156.2 mg/mL
- Buffer: 20 mM citric acid buffer (150 mM NaCl, pH 6.0)
Measurement conditions
1. Secondary Structure Estimation by Far-UV CD and IR Spectrum
Sample concentrations: 5.8, 11.4, 17.5, and 23.1 mg/mL
Pathlength: 0.01 mm (Far-UV CD)
Sample Volume: 1.8 µL (Far-UV CD), 10 µL (IR)
2. Near-UV CD spectrum measurement
Sample concentrations: 5.8, 11.4, 17.5, 23.1, 43.3, 61.7, 76.8, 114.9, and 156.2 mg/mL
Pathlength: 1 mm (5.8 and 11.4 mg/mL), 0.5 mm (17.5 and 23.1 mg/mL), 0.1 mm (43.3 or higher)
Sample Volume: 280 µL (5.8 and 11.4 mg/mL), 220 µL (17.5 and 23.1 mg/mL), 22 µL (43.3 or higher)
Results
1. Secondary Structure Estimation by Far-UV CD and IR Spectrum
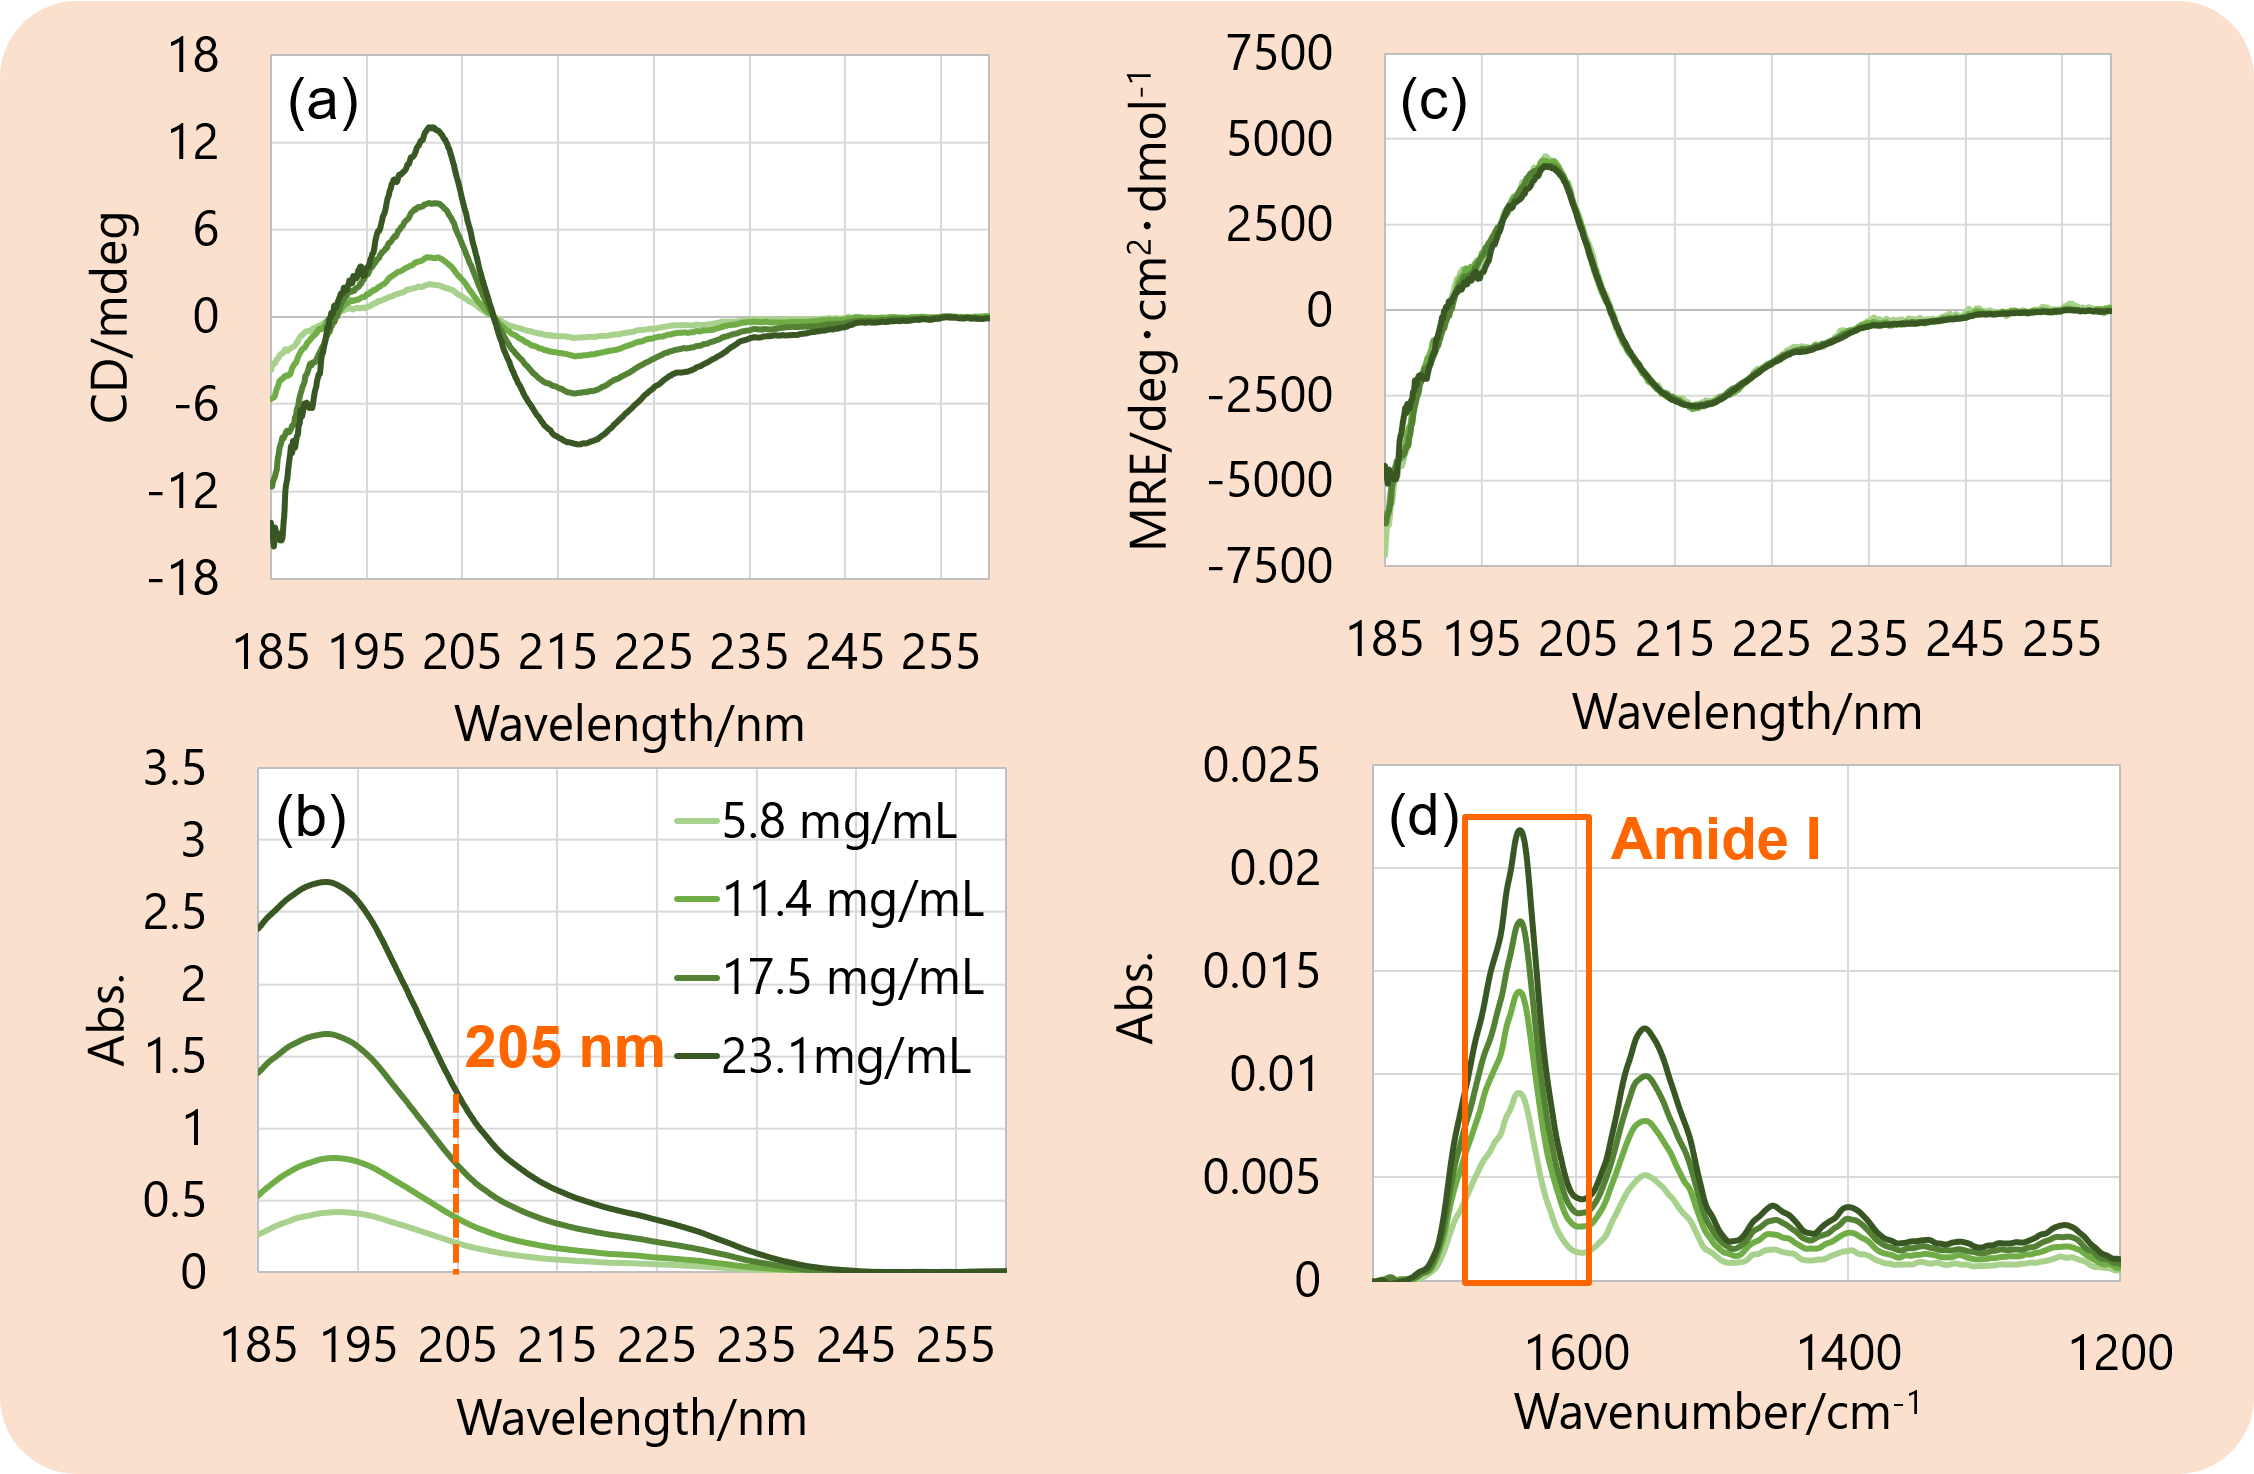
Figure 1. (a) CD spectra, (b) absorbance spectra, (c) MRE spectra at far-UV region, and (d) IR spectra of rabbit serum IgG.
Figure 1 shows the results of CD measurement and IR measurement. The concentration of each sample was calculated from the absorbance at 205 nm5,6) (b), then the CD spectra (a) were converted into MRE spectra (c) using the calculated concentration. The MRE spectrum did not change its shape despite the change in the concentrations.
The IR spectrum (d) did not seem to have a significant change in its shape regardless of the concentrations.
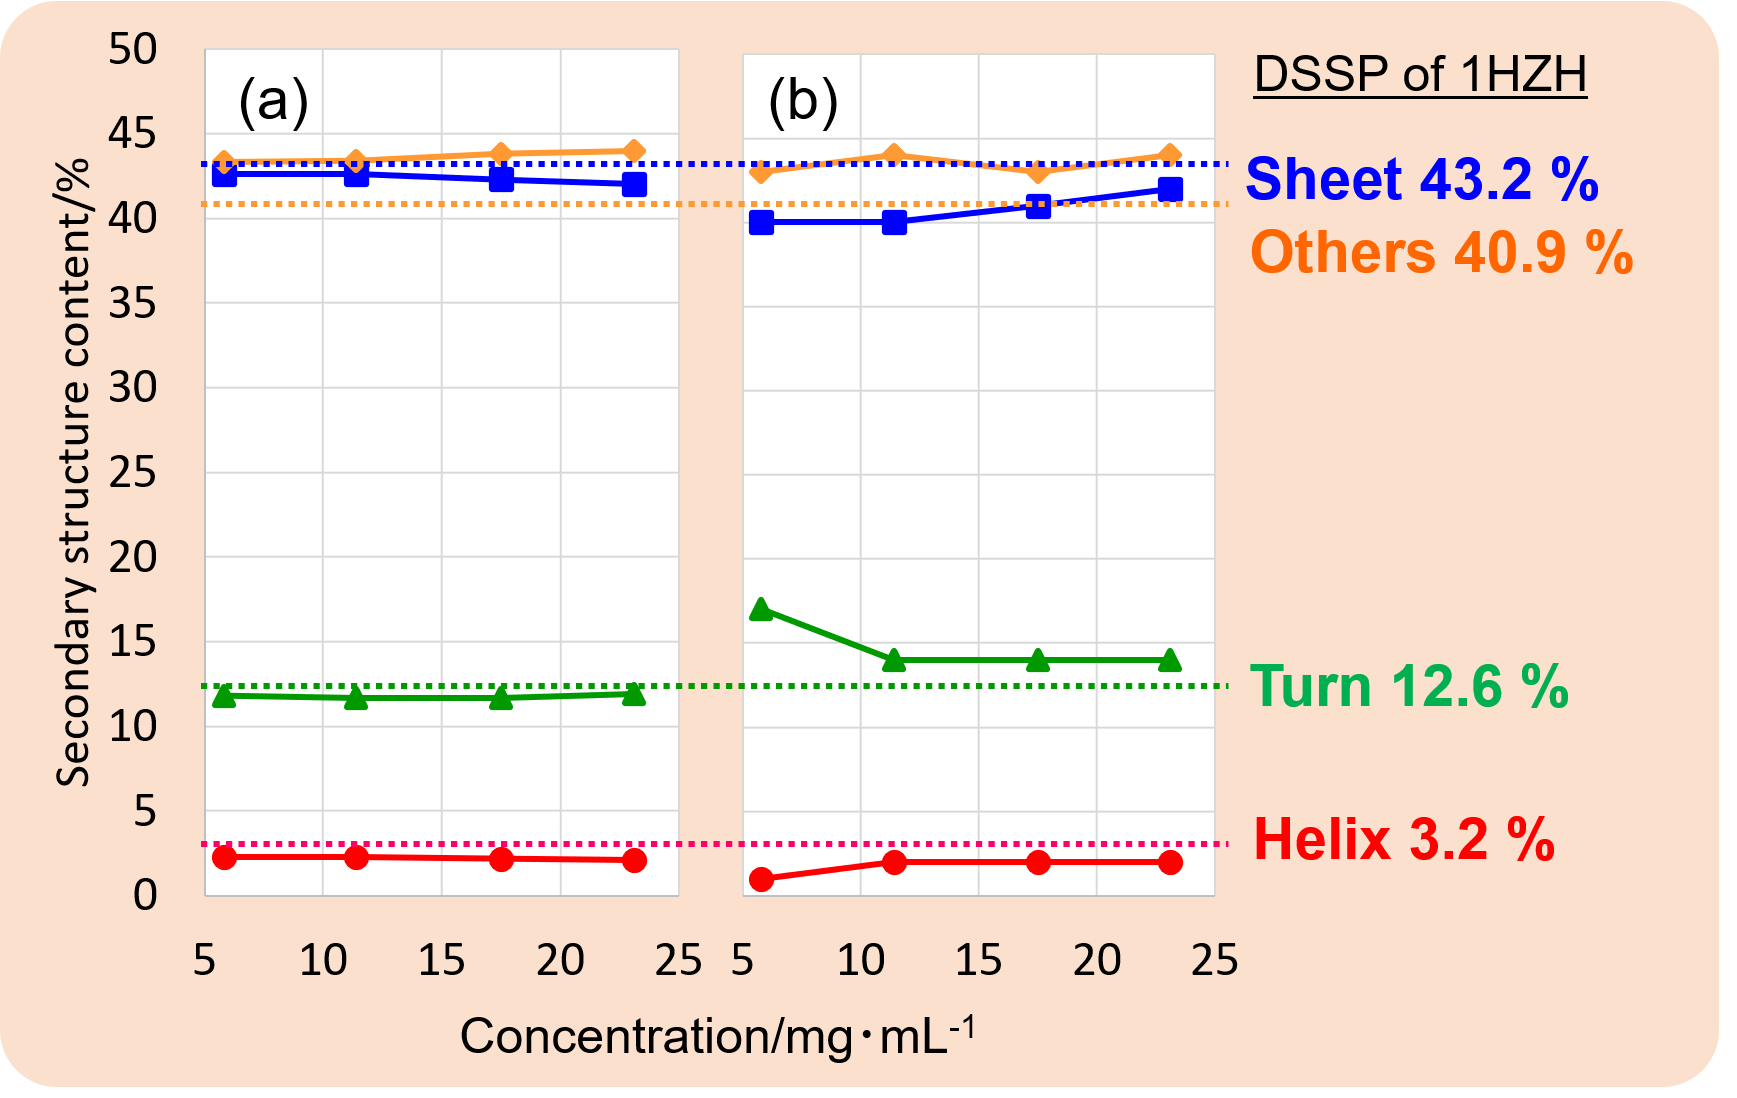
Figure 2. Secondary structure contents estimated from (a) MRE spectra and (b) IR spectra. Secondary structure contents were estimated from the MRE spectrum using the BeStSel program, and from the Amide I band (1700 to 1600 cm-1) on IR spectra using the IR SSE-4000.
Figure 2 shows the results of secondary structure estimation by CD and IR measurement results. Secondary structure content did not show significant differences among these concentrations. The results of both CD and IR SSE showed very close secondary structure contents.
2. Near-UV CD Spectrum Measurement
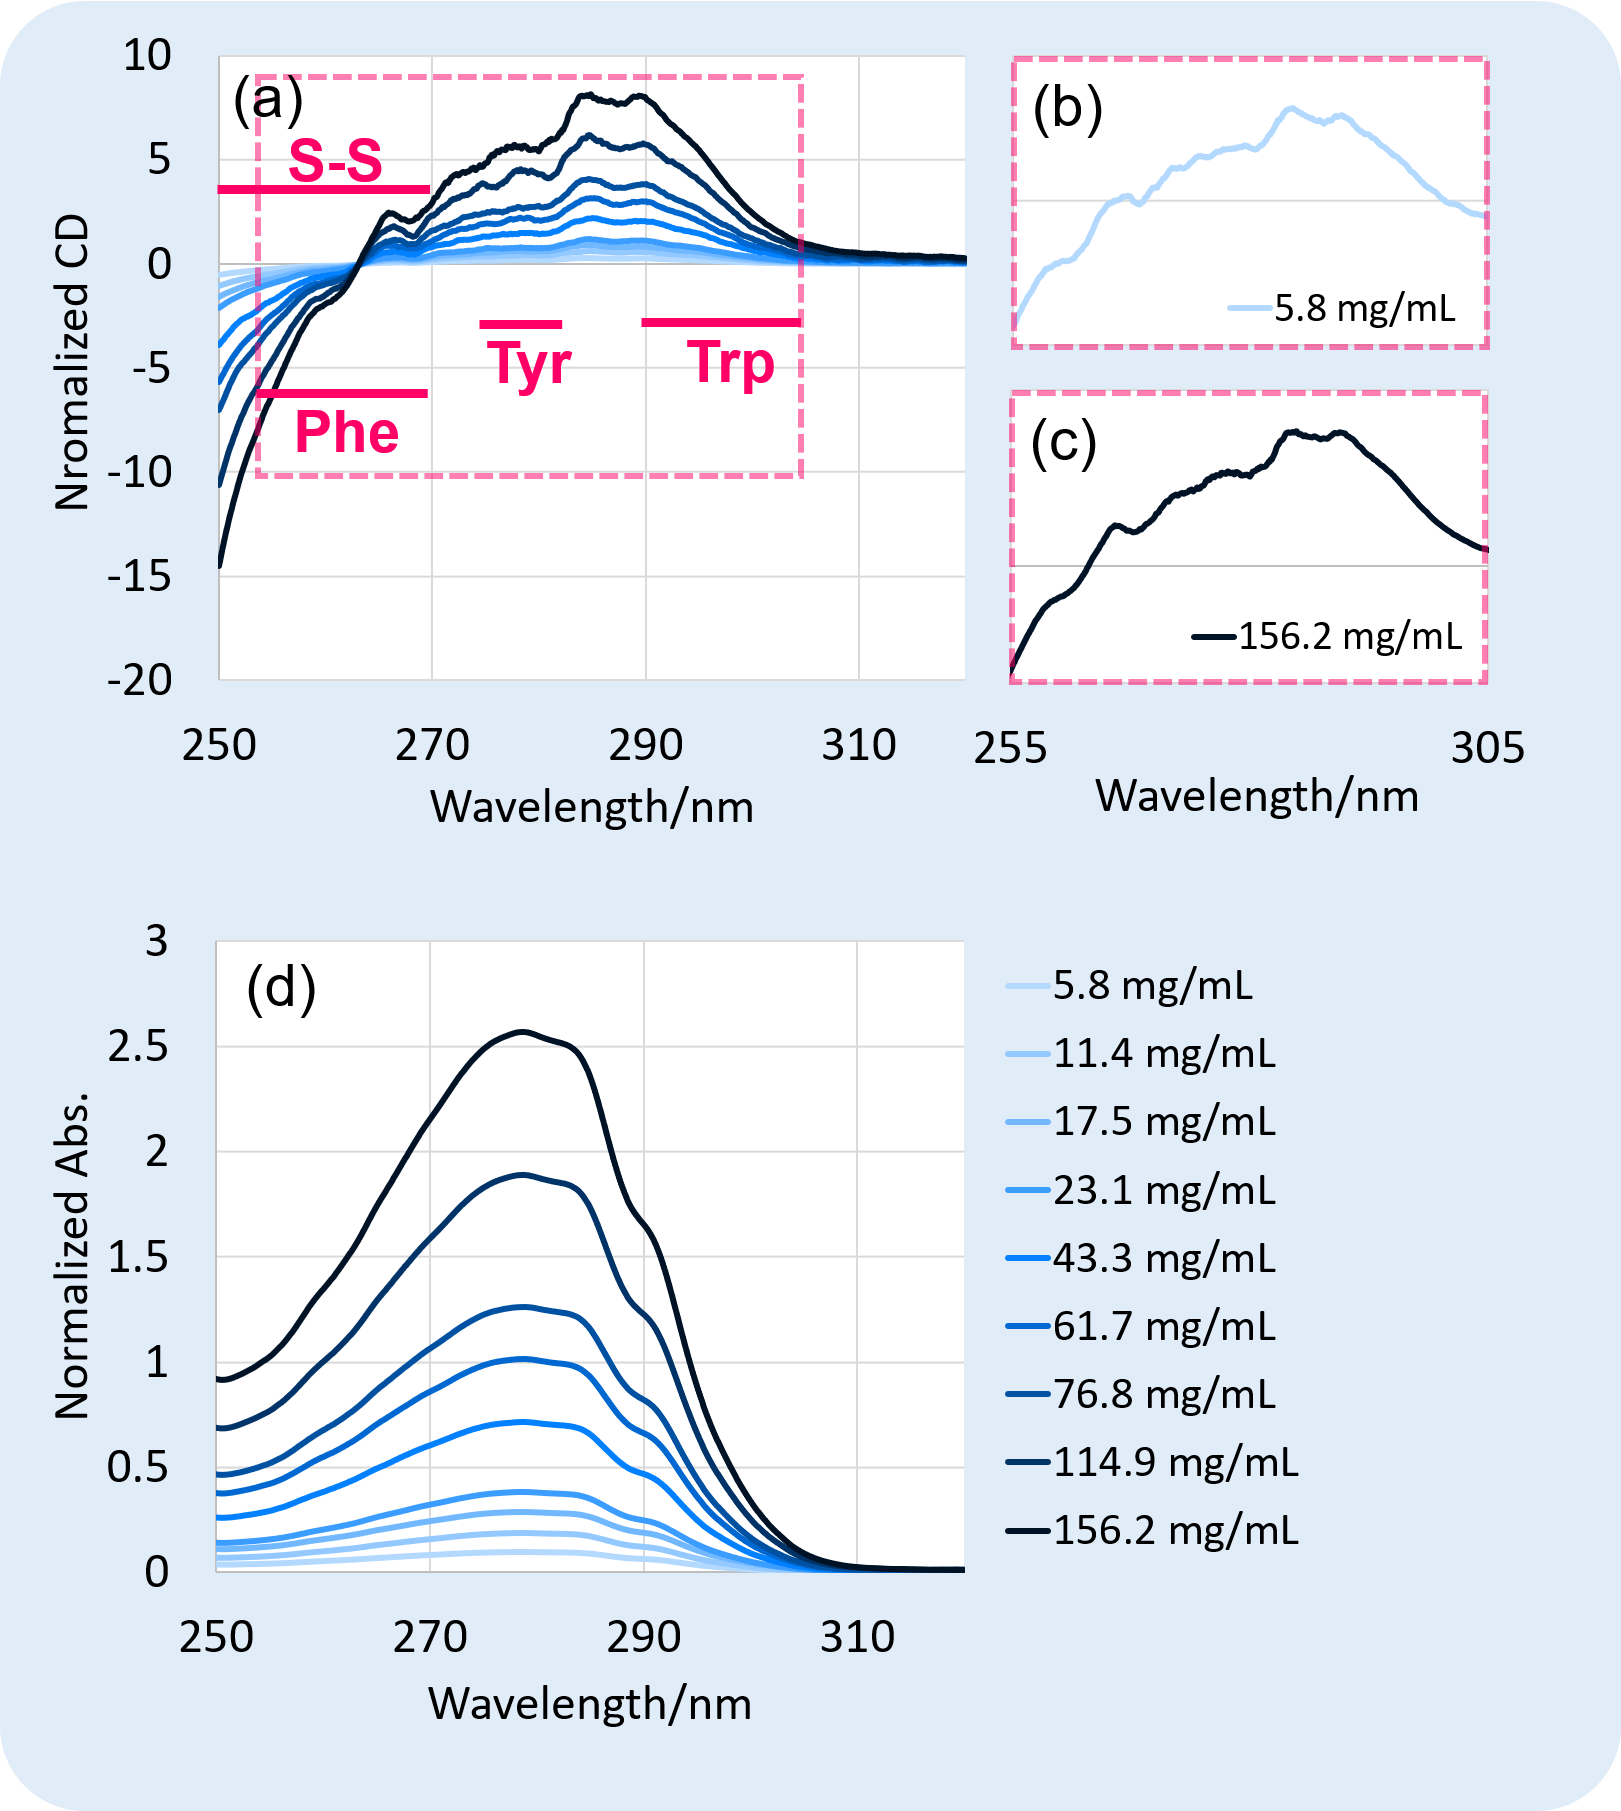
Figure 3. Normalized (a) CD spectra, and (d) absorbance spectra on near-UV region of rabbit serum IgG. Since each sample was measured with different pathlength, the measured CD and absorbance spectrum was normalized as if all the samples with different concentrations were measured with the same pathlength (0.1 mm).
Figure 3 shows the results of CD measurement at near-UV region. CD signals at 255 nm to 305 nm under both concentrations of (b) 5.8 mg/mL and (c) 156.2 mg/mL were well-detected, showing that IgG at a wide range of concentrations was successfully measured with good sensitivity at near-UV region.
Conclusion
- The agreement on CD and IR SSE results suggests their use on orthogonal analysis, or one of them can be selected properly. For example, the amide I band on IR spectrum can be overlapped with some type of buffer (e.g. citrate buffer), therefore CD is a better option in this case. On the other hand, while IR can handle protein with concentrations of 100 mg/mL or higher, those for far-UV CD measurement is limited up to several tens of mg/mL.
- Selecting an appropriate pathlength depending on the protein concentration enables near-UV CD measurement at a wide range of protein concentrations.
Acknowledgement
We are grateful to Prof. Kardos for useful discussions about secondary structure estimation of proteins and the use of the BeStSel program. (BeStSel URL: http://bestsel.elte.hu/index.php)
References
Poster Session at BPS 2022 (66th Biophysical Society Annual Meeting, February 19 – 23, 2022, in San Francisco, California, USA)
Ai Yamane1, Taiji Oyama1, Kohei Tamura1, Miyuki Kanno1, Shingo Norimoto1, Forrest Kohl2, Satoko Suzuki1, and Kenichi Akao1
1JASCO Corporation, Hachioji, Tokyo, 192-8537, Japan, 2JASCO Inc., Easton, MD, USA
1) US Food and Drug Administration. Regulatory Consideration for the Characterization of HOS in Biotechnology Products. 2016
2) WHO. Guidelines on the quality, safety, and efficacy of biotherapeutic protein products prepared by recombinant DNA technology. 2013
3) A. Micsonai, F. Wien, L. Kernya, Y.H. Lee, Y. Goto, M. Refregiers, J. Kardos, PNAS, 2015, 112, 3095-3103.
4) E.O. Saphire, P.W. Parren, R. Pantophlet, M.B. Zwick, G.M. Morris, P.M. Rudd, R.A. Dwek, R.L. Stanfield, D.R. Burton, I.A. Wilson, Science, 2001, 293, 1155-1159.
5) Nicholas J. Anthis, G. Marius Clore, Protein Science, 2013, 22, 851-858.
6) A. Micsonai, E. Bulyaki, J. Kardos, Methods in Molecular Biology, 2020, 2199, 175-189.


 Analysis of CBN-Binding DNA Aptamer using CD Spectroscopy")
