Introduction
The analysis of the molecular structure of fiber materials is useful in the evaluation of new materials, quality control, forensics and in criminal investigation. Fibers are made by mixing different materials and dye compounds to meet the requirements for color and texture. Infrared spectroscopy (as required by JIS L 1030) is widely used in the molecular structure analysis of fiber materials; ATR is an excellent technique because it requires only minimal sample preparation, is non-destructive and easy to use. JASCO’s FTIR accessory, the ATR PRO 4X VIEW allows the user to perform measurements whilst observing the sample contact with the prism, and provides a clear full color image.
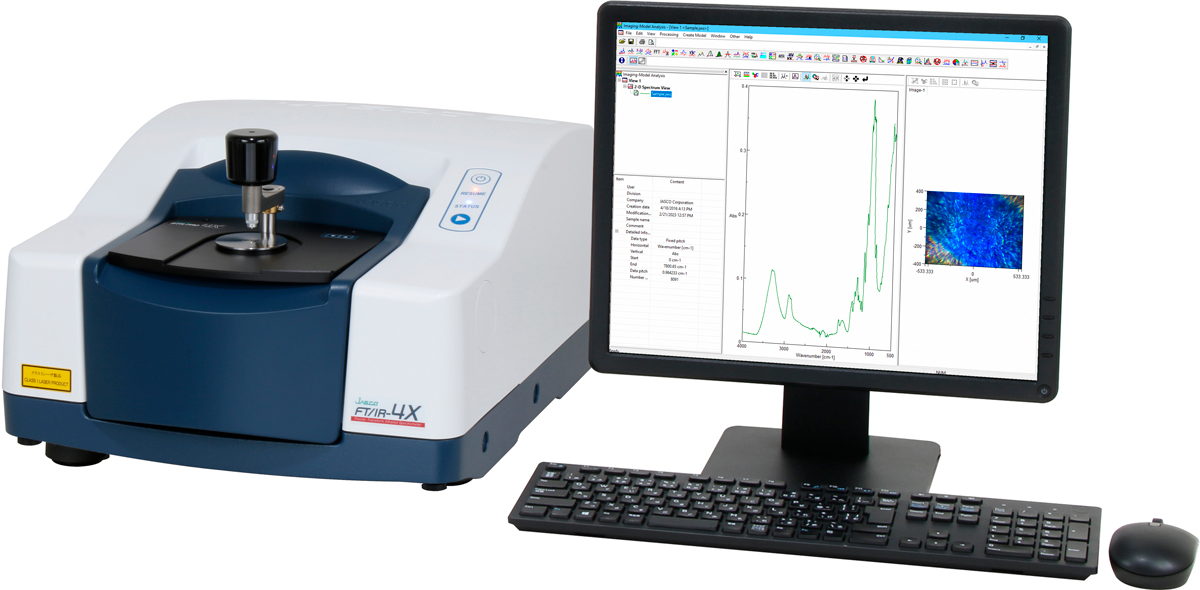
FT/IR-4X with ATR PRO 4X VIEW
The spectrum and image are saved together in Spectra Manager™ for a comprehensive record of the analysis. In this application note, the measurement of several fiber products are demonstrated using an ATR PRO 4X VIEW.
| Measurement | |
| Instruments | FT/IR-4X |
| Resolution | 4 cm-1 |
| Method | ATR |
| Detector | DLATGS |
| Accumulation | 50 times |
| Accessory | ATR PRO 4X VIEW |
| Prism | PKS-D1V |
| Specification of ATR PRO 4X VIEW | |
| Prism | Observation Diamond Non-Observation ZnSe, Ge (Option) |
| Sample Contact Area | f1.8 mm (Diamond) |
| Reflectance | One |
| Incident Angle | 45° |
| Pressure Resistance | 700 kg/cm2 (Diamond) |
| Measurement Wavenumber Range | 10000-300 cm–1* 10000-30 cm–1* (Option) |
| Observation (USB Camera) | View: 1.1 x 0.8 mm, LCD: 5 inch VGA |
| Software | SP data format with image, wavelength tool, image processing function |
| Size, Weight | 182(W) x 166(D) x 205(H) mm 2.0 kg |
| Accessory | Pressure tip (2 type) |
| * High performance diamond prism kit (PKS-D1V): 10000-300cm–1 * Wide range diamond prism kit (PKS-D1VF): 10000-30cm–1 |
|
Keywords
260-AT-0243, fiber, sample image, material analysis, ATR
Results
2.1 Fiber Image
Figure 2 is a digital image of a fiber captured using the ATR PRO 4X VIEW. A micro sample was set at the center of the prism and can be clearly observed in the 1.1 x 0.8 mm field.
The Spectrum Measurement software allows the measurement of sample dimensions and to save the IR spectrum with a captured image. This additional information is useful when collating data, including the sample image, and provides valuable information for a complete record and comprehensive reporting.
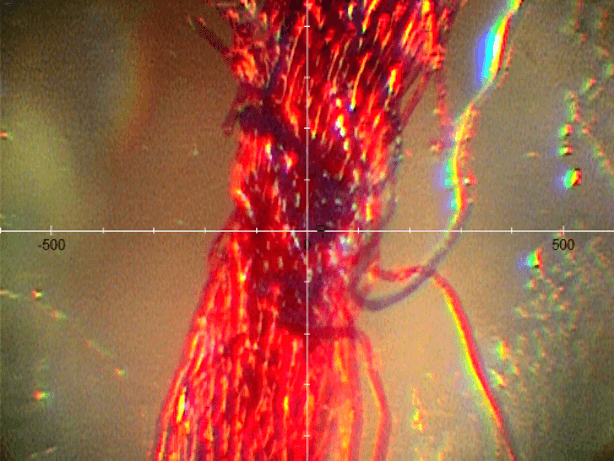
Figure 2. Fiber image captured by ATR PRO ONE VIEW
2.2 Blended Fiber Analysis
Figure 3 Images and IR spectra of a neutral colored cloth and a beige/green cloth. The peaks around 1640, 1550 cm–1 assigned as amide I, II are observed in spectrum (A). Peaks assigned as nitrile (2300 cm–1) and carbonyl (1720 cm–1) are observed in addition to the amide I, II peaks. These results indicate that (A) is pure wool and (B) is a mixture of acrylic and wool.
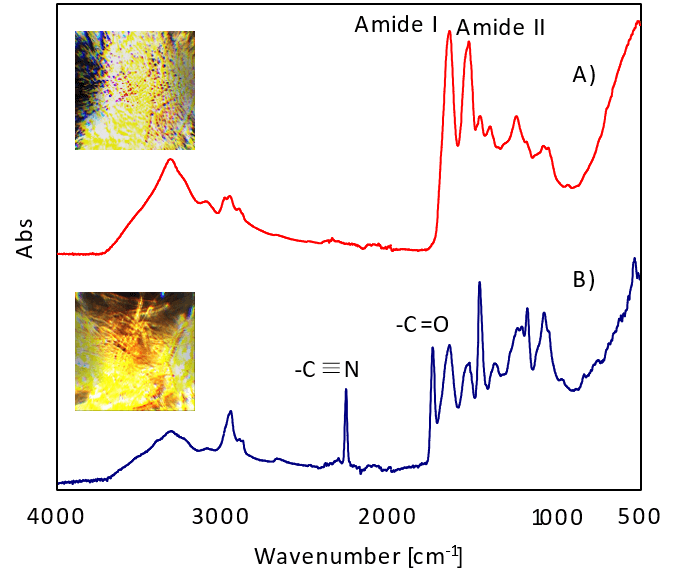
Figure 3. IR spectra and images of beige cloth (top) and red cloth (bottom)
Conclusion
As mentioned, using the ATR PRO 4X VIEW allows the sample position, chemistry, shape and color to be recorded in a single comprehensive data set. The ATR PRO 4X VIEW can be used in various fields including quality control and criminal investigation.
References
About the Author
Dr. Carlos Morillo received his Post Doc at Advanced Industrial Science & Technology in Fukuoka and was a Research Scientist at Kyushu University in Japan where he lived for several years. Carlos received his Doctor of Engineering from Kyushu University and his Masters and BS from Simon Bolivar University in Caracas Venezuela. He is an Applications Scientist at JASCO.
Related Posts:
 Microplastics Identification using Macro-ATR Unit…
 Analysis of pollen collected by Durham sampler…
 Base Material and Dye Analysis - Combined Raman and…
 Combined Analysis of Thermochromic Materials -FT-IR…
 Analysis of CBN-Binding DNA Aptamer using CD Spectroscopy") Higher-Order Structure (HOS) Analysis of CBN-Binding…
Higher-Order Structure (HOS) Analysis of CBN-Binding… Analysis of Styrofoam by GPC/SEC using mixed gel column