Introduction
It is important to know the components (or ingredients) in foods to solve the problems on the manufacturing process and quality control, and IR spectroscopy is effective tool to get such information. However, since many ingredients are included in food, IR spectrum which these information is added in is detected, and it is hard to extract the information which the user needs. In order to get the proper data from measurement data, chemometrics is used frequently. Examples of chemometrics technique are the principal component analysis (PCA) and the partial least squares (PLS) regression.
PCA is the technique that can perform the dimensionality reduction of the data during minimizing the information loss of high-dimensional data (such as spectra). Its technique enables to find the characteristics (latent variables) from multi-data (spectra), which can perform the identification and classification of data.
Although PLS regression can also perform the dimentionality reduction like PCA, it is the regression analysis utilizing the latent variables, which are found so that the relation (covariance) between the latent variable and the response variable is maximized. Its technique can create the robuster model than the general multiple regression analysis, and it is strong against the noise.
This article shows the component analysis result of dairy product by PCA. Measurement data were acquired by IR spectroscopy for these analyses.
FT/IR-4600 FTIR spectrometer
Results
IR spectra were acquired by using ATR. Figure 1 shows the IR difference spectra between milk and water. Milk consists mainly of 4 components (water, protein, sugar and fat), and approx. 90 % of milk is water. Subtracting water spectrum from milk spectrum could observe the specific functional group bands of each main component.
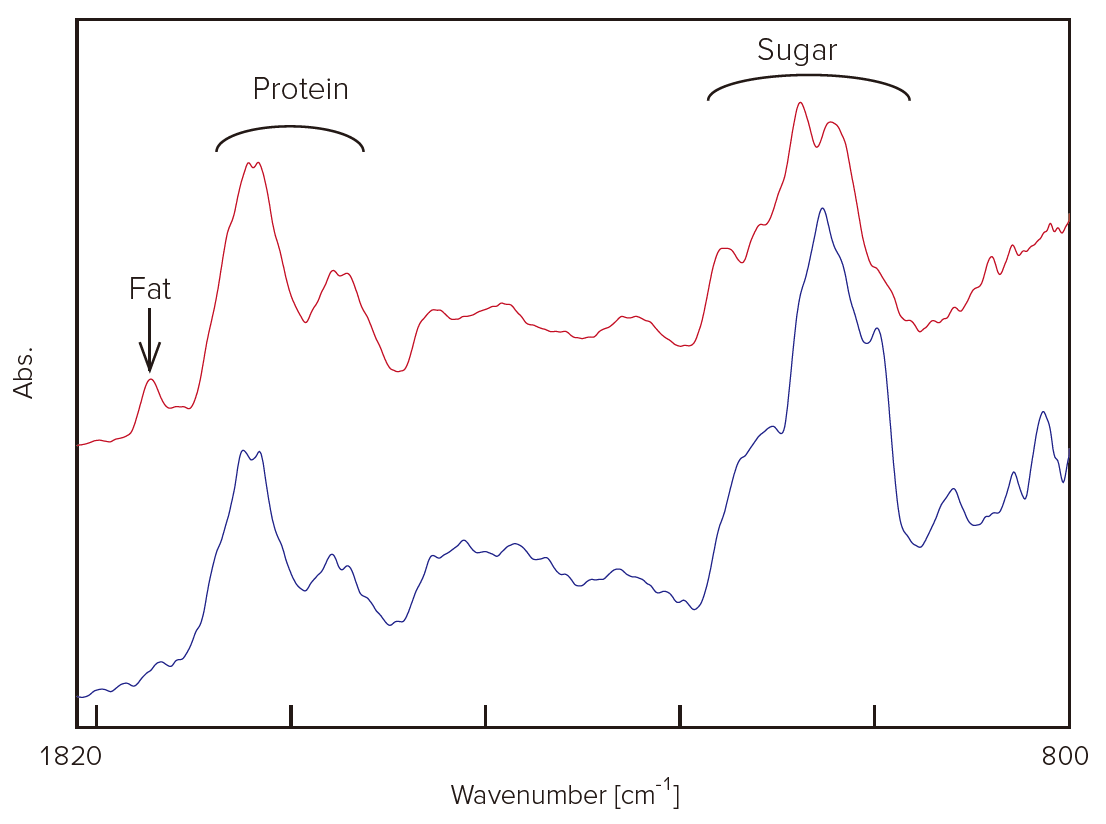
Figure 1. IR difference spectra between milk and water (red: milk, blue: coffee with milk)
Next, 7 kinds of commercial milk were measured, and classification of them were performed by using PCA (Figure 2). Figure 2 indicates that the component ratios of milk samples (No. 4 to 7) are almost the same. Regarding the coffee with milk (No.1 to 3), it indicates that the sugar ratios of them are almost the same, and they are largely different in the other component ratio.
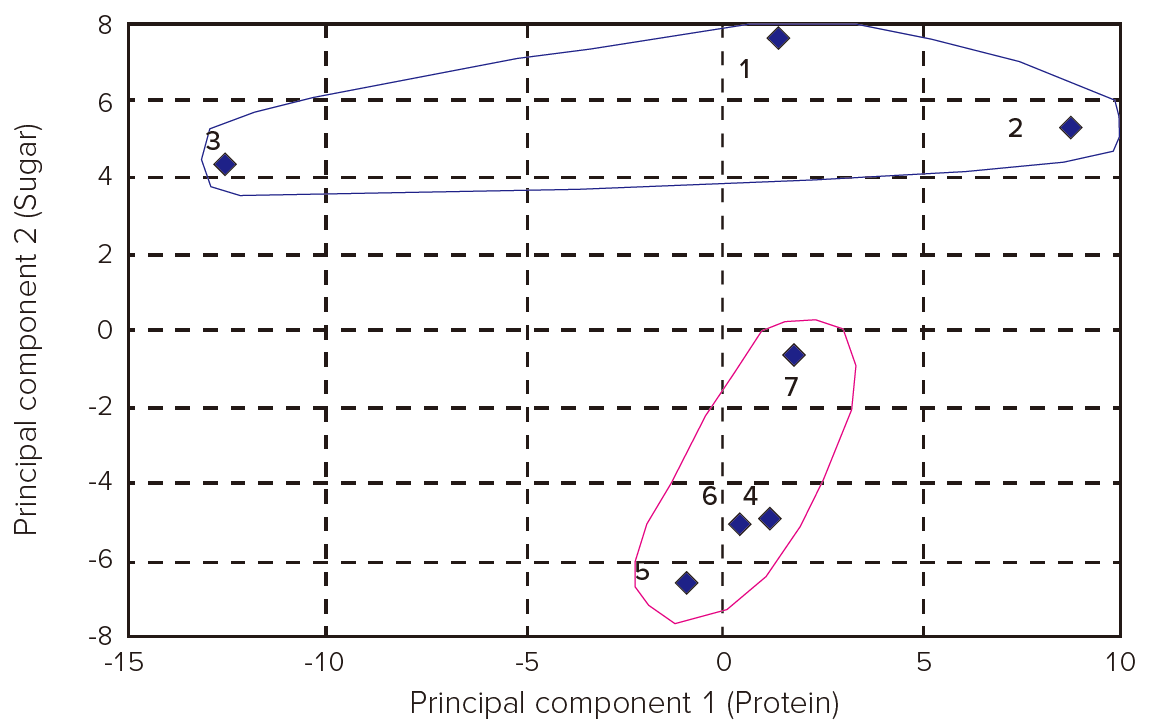
Figure 2. Principal component scores (1. Coffee with milk (A), 2. Coffee with milk (B), 3. Coffee with milk (C), 4.Milk (D), 5. Milk (E), 6. Milk (F), 7. Milk (G))
Related Posts:
 Application eBook - Food and Beverage Science
 Resonance Raman Scattering for Trace-Level Component…
 Base Material and Dye Analysis - Combined Raman and…
 Combined Analysis of Thermochromic Materials -FT-IR…
 Development and Applications of Full-Vacuum FT-IR…
 Analysis of CBN-Binding DNA Aptamer using CD Spectroscopy") Higher-Order Structure (HOS) Analysis of CBN-Binding…
Higher-Order Structure (HOS) Analysis of CBN-Binding…