Introduction
In 2008, Italian scientists published their results showing that oxybenzone, benzophenone and cinnamic acid, the major components of UV absorbers, are responsible for coral bleaching (i.e., death). In 2015, results showing that the chemicals affect coral DNA even at low concentrations were published in a scientific journal of Environmental Toxicology. An ordinance that bans the sale and distribution of sunscreens containing oxybenzone (HMB) and octinoxate (EMC) was enacted in 2018 and came into effect on January 1, 2021 in Hawaii. These ordinances and bills are set to come into effect at the same time in Key West, Florida and Bonaire, the Caribbean; thus, regulations have started to be taken around the world. In Japan, however, products using these components are still sold because of the absence of such regulations, and their use is not banned either. Nevertheless, we encourage to choose UV-absorber-free or environmentally friendly products when visiting such regulated areas.
Here, we report the results of our simultaneous analysis measuring 11 components of UV absorbers contained in a commercially available sunscreen cream.
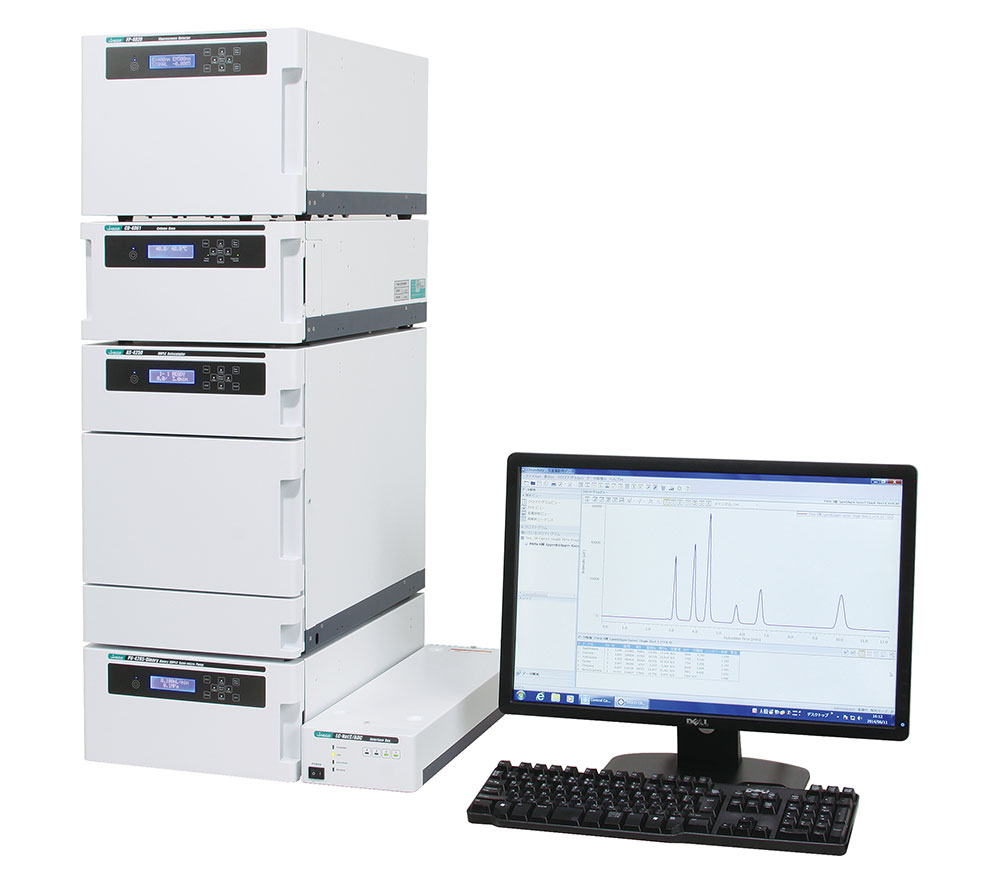
LC-4000 HPLC system
Experimental
HPLC Conditions
Column: CrestPak C8T-5 (4.6 mmI.D. x 250 mmL, 5 µm)
Eluent A: 1.5 % formic acid
Eluent B: Acetonitrile
Gradient: A/B = 60/40 (0.00 min) -> 0/80 (4.00 min) -> 10/90 (12.00 min) -> 5/95 (12.05 min) -> 5/95 (14.00 min) -> 60/40 (14.05 min), 1cycle; 22 min
Flow rate: 1.0 mL/min
Column temp.: 40 ºC
Wavelength: 200-500 nm
Injection volume: 5 µL
Standard: 11 ultraviolet absorbers mixture in acetonitrile
(Refer to the each data for concentrations.)
Sample: Sunscreen cream
(Pretreatment method is described later.)
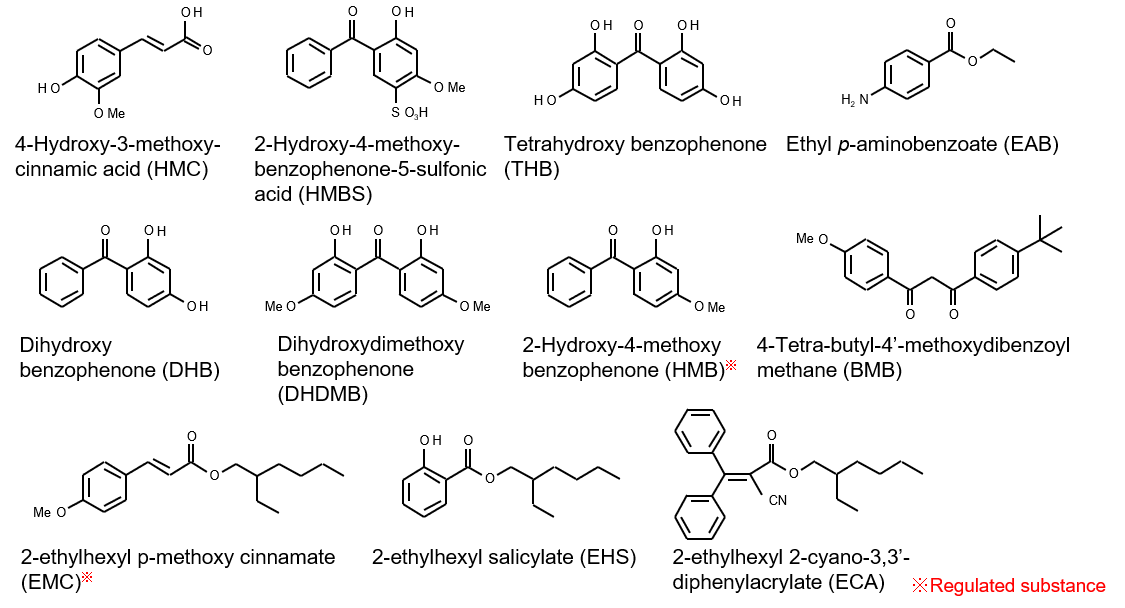
Structures
Keywords
HPLC, PDA detector, ultraviolet absorbers, sunscreen cream, C8, EXTREMA
Results
Figure 1-1 shows a chromatogram and a contour map for a mixture of 11 standard ultraviolet absorbers obtained using a PDA detector. Figure 1-2 shows spectra acquired at the top of different peaks.

Fig. 1-1 Chromatogram and contour map of ultraviolet absorbers standard mixture obtained by a PDA detector (50 µg/mL each).
(A) : UV chromatogram (280, 310 nm), (B) : contour map.
1: HMC, 2: HMBS, 3: THB, 4: EAB, 5: DHB, 6: DHDMB, 7: HMB, 8: BMB, 9: EMC, 10: ECA, 11: EHS
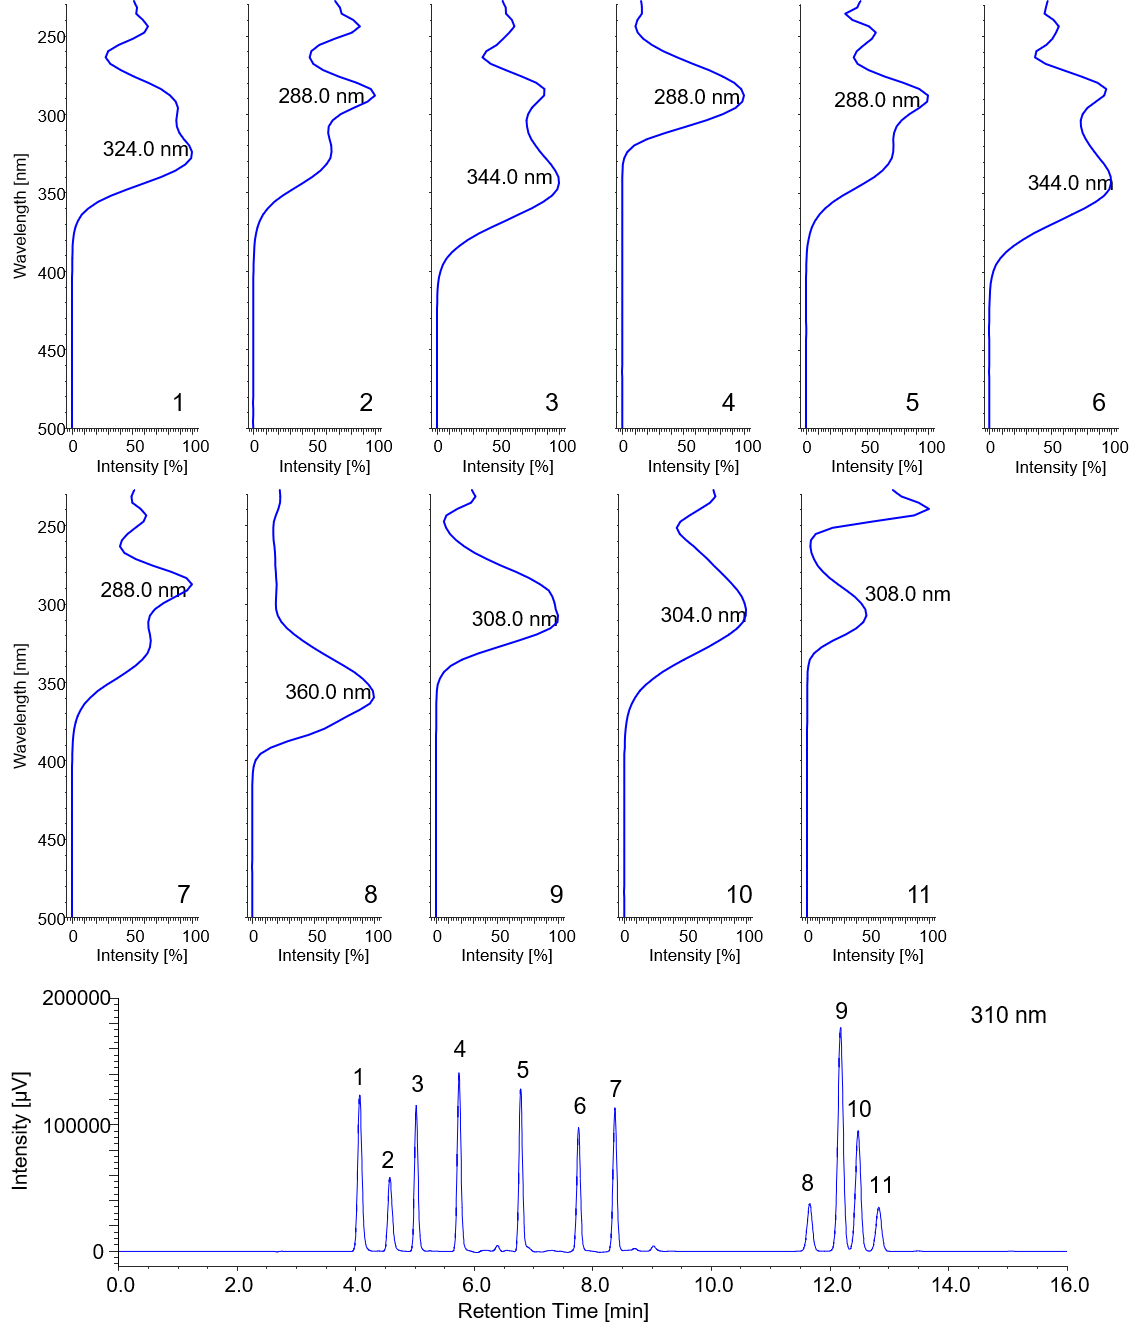
Fig. 1-2 On-peak spectra of eleven ultraviolet absorbers.
1: HMC, 2: HMBS, 3: THB, 4: EAB, 5: DHB, 6: DHDMB, 7: HMB, 8: BMB, 9: EMC, 10: ECA, 11: EHS.
Figure 2 shows a procedure for the extraction from a sunscreen cream.
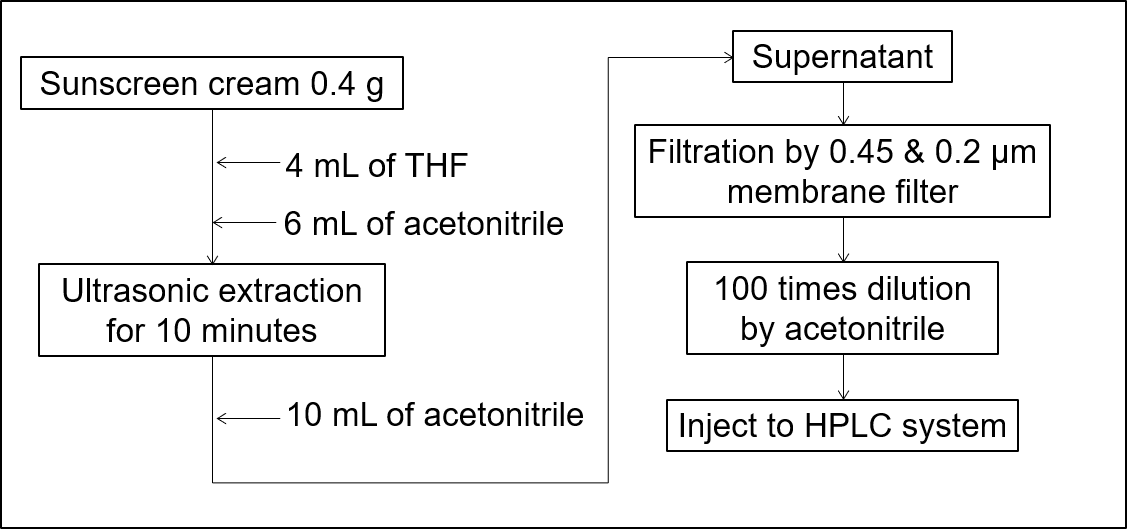
Fig. 2 Procedure for extraction from sunscreen cream
Figure 3 shows chromatograms for the extract from sunscreen cream. Figure 4 shows the result of a spectral search for the peaks from the extract of sunscreen cream. The spectrum obtained for the eluted peak from cream extract was compared with spectra in a spectral library, to which the spectra for 11 standard samples had been registered in advance. It revealed a high correlation coefficient of 0.999 with the spectrum of EMC.
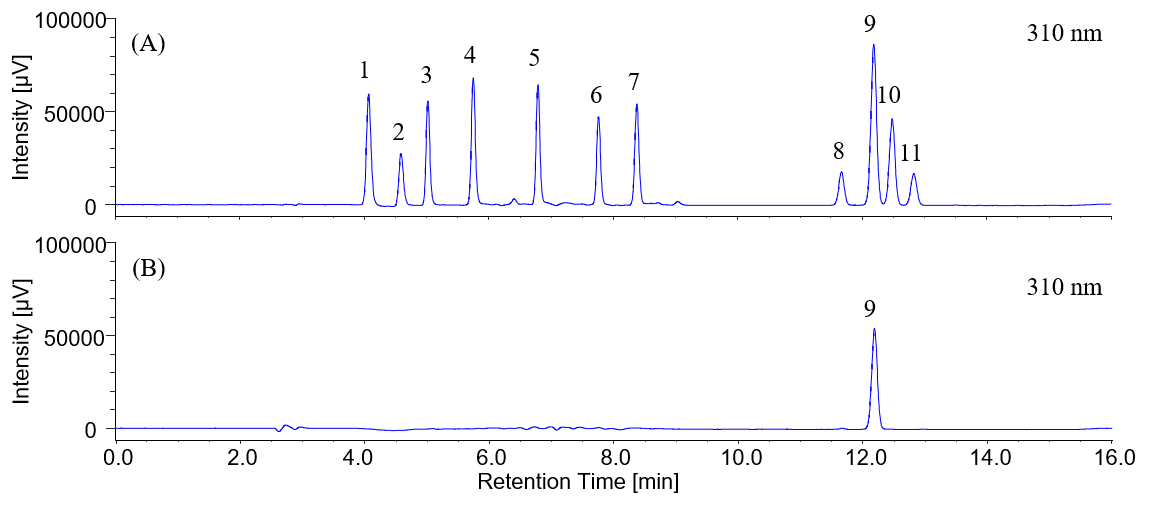
Fig. 3 Chromatogram of sunscreen cream
(A) Standard, (B) Extract.
1: HMC, 2: HMBS, 3: THB, 4: EAB, 5: DHB, 6: DHDMB, 7: HMB, 8: BMB, 9: EMC, 10: ECA, 11: EHS.

Fig. 4 Spectral search result for sunscreen cream extract.
(A): Spectrum of Peak 9, (B): Spectrum of EMC.
Related Posts:
") Analysis of Ultraviolet Absorbers in Sunscreen Cream…
Analysis of Ultraviolet Absorbers in Sunscreen Cream… Analysis of Glyphosate and Aminomethyl Phosphonic…
 Base Material and Dye Analysis - Combined Raman and…
 Combined Analysis of Thermochromic Materials -FT-IR…
 Development and Applications of Full-Vacuum FT-IR…
 Analysis of CBN-Binding DNA Aptamer using CD Spectroscopy") Higher-Order Structure (HOS) Analysis of CBN-Binding…
Higher-Order Structure (HOS) Analysis of CBN-Binding…