Introduction
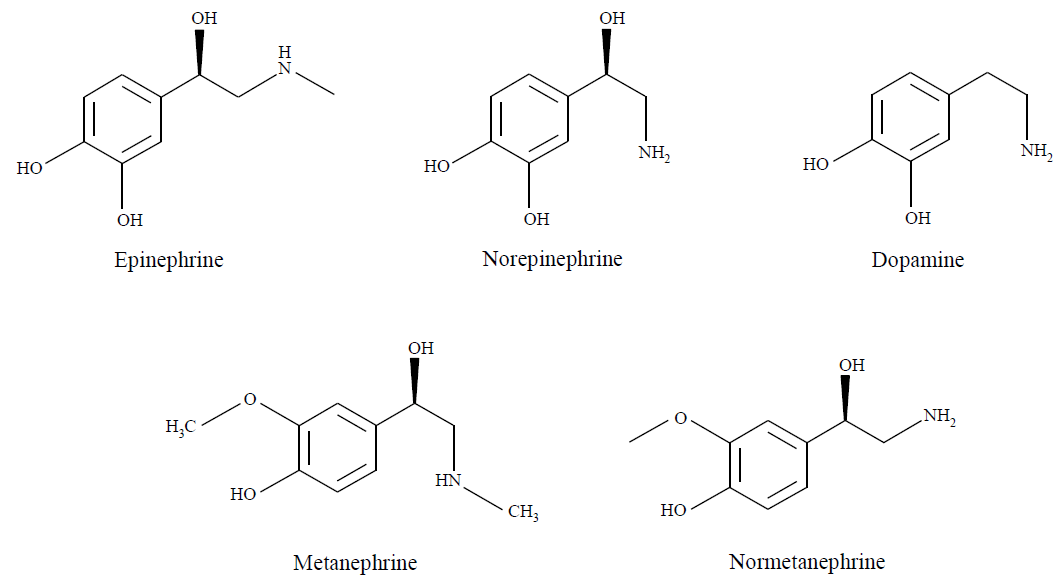
Catecholamine is the generic term for the chemical compounds with catechol and amine groups and functions mainly as a neurotransmitter in vivo. Epinephrine (also called adrenaline), norepinephrine (also called noradrenaline), dopamine and their metabolites such as metanephrine and normetanephrine are known as catecholamines. An analytical measurement of catecholamines in the urine or blood is employed to examine and diagnose a variety of clinical conditions like high blood pressure, phaeochromocytoma and neuroblastoma.
The article shows the separation and subsequent detection of five types of catecholamines by high performance liquid chromatography (HPLC) connected to the GL Sciences’s ECD, ED743.
Experimental
[Conditions]
Column: Unifinepak C18 (4.6 mm I.D. x 150 mmL, 5 μm)
Eluent: 10 mM hexanesulfonic acid sodium and 20 mM citrate acid in water/acetonitrile (90/10)
Flow rate: 1.0 mL/min
Column temp.: 35 ºC
ECD condition: 1200 mV vs. Ag/AgCl (Diamond Electrode)
Injection volume: 20 μL
Standard: Epinephrine, Norepinephrine, Dopamine, Metanephrine and Normetanephrine (Refer to the each data for concentrations.)
[Structures]
Keywords
Catecholamine, Unifinepak C18, HPLC, Electrochemical Detector
Results
Figure 1 shows the chromatograms of catecholamine standard samples. Five types of catecholamines were very well separated and detected.
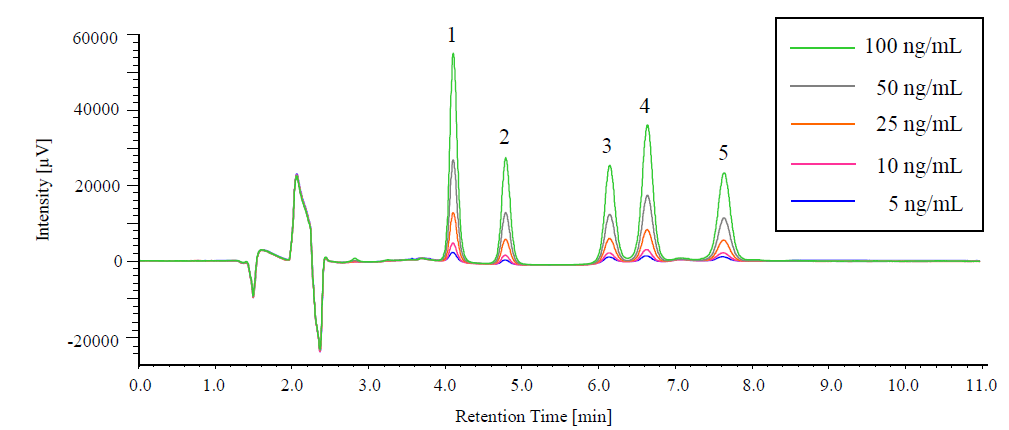
Figure 1 Chromatograms of Catecholamine Standard Samples (Each, 5-100 ng/mL)
1: Norepinephrine, 2: Epinephrine, 3: Normetanephrine, 4: Dopamine, 5: Metanephrine
Table 1 shows the calculation results of linearity, reproducibility, detection limits and limit of quantitation of catecholamine standard samples, while Figure 2 shows the calibration curves of these samples. In every type of catecholamines linearity, reproducibility and detection sensitivity were confirmed.
Table 1 Linearity, Reproducibility, Detection Limits and Limit of Quantitation
| Types of Catecholamines | Linearity (r)*1 | Relative Standard Deviation [%] (n = 6)*2 |
Detection Limits*3 [pg] (S/N = 3) |
Limit of Quantitation*3 [pg] (S/N = 10) |
|
| Retention Time | Peak Area | ||||
| Norepinephrine | 0.9999 | 0.08 | 1.59 | 31.1 | 103.7 |
| Epinephrine | 0.9999 | 0.07 | 1.55 | 61.7 | 205.7 |
| Normetanephrine | 1.0000 | 0.06 | 1.11 | 42.6 | 142.0 |
| Metanephrine | 0.9999 | 0.11 | 1.14 | 44.8 | 149.5 |
| Glucose | 0.9999 | 0.08 | 0.70 | 70.4 | 234.7 |
*1 Range of calibration curve: 5-100 ng/mL each
*2 Calculated from the measurement result of each 25 ng/mL standard solution
*3 Calculated from the measurement result of each 5 ng/mL standard solution
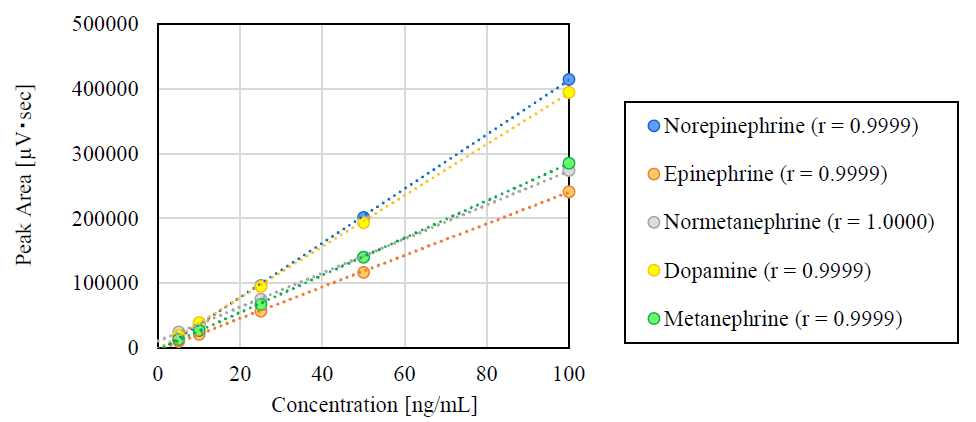
Figure 2 Calibration Curves of 5 Types of Catecholamines (each 5-100 ng/mL)
Figure 3 illustrates as reference data the chromatogram of a standard sample of catecholamine detected by a UV detector (UV-4075) under the same analytical condition. Table 2 shows the sensitivity comparison of an ECD and an UV detector. The ECD has proved to have 100 times higher sensitivity than the UV detector for all of 5 types of catecholamines.
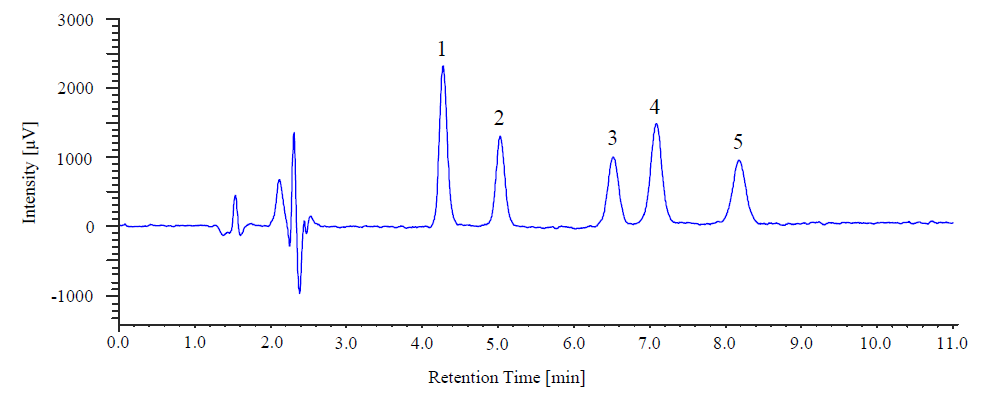
Figure 3 UV Chromatography of Catecholamine Standard Samples (each 1000 ng/mL, 280 nm)
1: Norepinephrine, 2: Epinephrine, 3: Normetanephrine, 4: Dopamine, 5: Metanephrine
Table 2 Sensitivity Comparison of ECD and UV Detector on 5 Catecholamines
| Norepinephrine | Epinephrine | Normetanephrine | Dopamine | Metanephrine | |
| ECD Detection Limits [pg] | 31.1 | 61.7 | 42.6 | 44.8 | 70.4 |
| UV Detector Detection Limits [pg] | 4170 | 7450 | 9720 | 6680 | 10500 |
| Sensitivity Comparison UV Detector / ECD | 134 | 121 | 228 | 149 | 149 |
Related Posts:
 Analysis of Water-soluble Vitamins by…
 Structural Analysis of Chiral Samples with Multiple…
 Analysis of pollen collected by Durham sampler…
 Base Material and Dye Analysis - Combined Raman and…
 Combined Analysis of Thermochromic Materials -FT-IR…
 Analysis of Ultraviolet Absorbers in Sunscreen Cream by HPLC