Introduction
α-Linolenic acid (ALA) is metabolized in the human body to produce eicosapentaenoic acid (EPA) and docosahexaenoic acid (DHA). The chemical structure of ALA is shown in Figure 1.
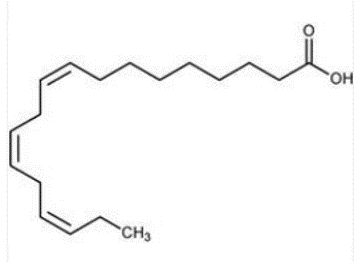
Figure 1 Structure of α-linoleic acid
EPA and DHA are referred to as essential fatty acids because they are not directly biosynthesized in the human body. Many convenient foods and supplements containing ALA are sold because this fatty acid helps to prevent hyperlipidemia and improve nerve development. Although edible oils are rich in ALA, due to deterioration or false labeling of ingredients, the components may be different from those stated on the labels. The composition of edible oils is often analyzed using techniques such as GC/MS, wet analysis, and rheometry. However, infrared (IR) spectroscopy offers the advantage of not requiring a complicated pretreatment step. In this study, IR spectroscopy using a single-reflection ATR system (JASCO ATR PRO ONE) was utilized to investigate the deterioration of ALA in perilla oil. Using this system (Figure 2), just a single drop of the sample is required for analysis
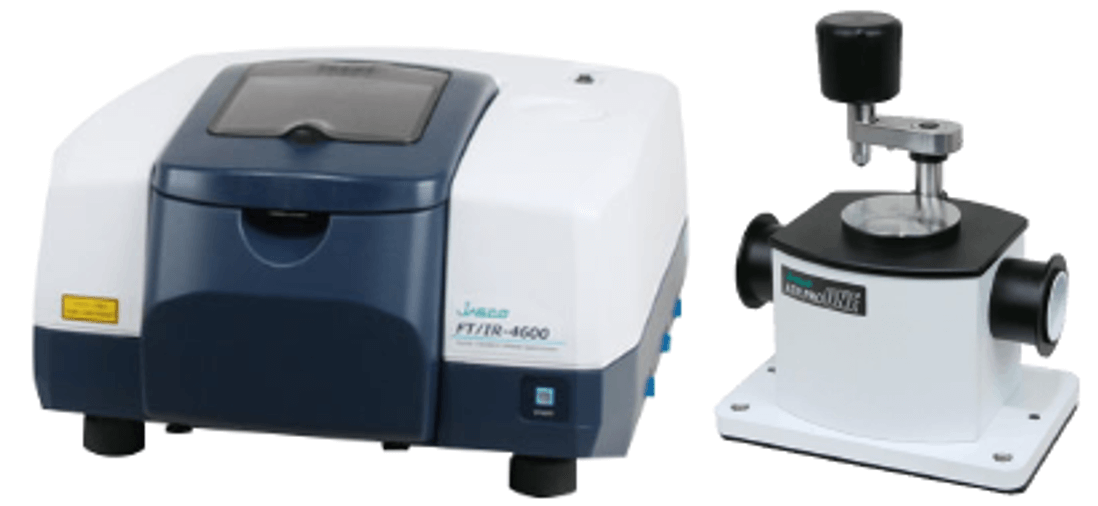
Figure 2 FT/IR-4600+ATR PRO ONE
Experimental
Measurement parameters
Instrument: FT/IR-4600
Resolution: 4 cm-1
Method: ATR
Detector: DLATGS
Accumulations: 32
Accessory: ATR PRO ONE (diamond prism)
Keywords
Edible oil, false labeling, perilla oil, deterioration, ATR
Results
Compositional Analysis
Perilla oil is rich in ALA, but quickly deteriorates and requires careful storage after opening, such as keeping it in a lightproof location at low temperature. Deterioration occurs due to oxidation resulting from heating or aging, and such oxidation can therefore be used to monitor the degree of degradation. In the present study, IR spectra were obtained for perilla oil just after purchase and following storage in a refrigerator at about 4 °C for one year, and the amount of deterioration was evaluated (Figure 3). In addition, since the fatty acid content of edible oils is sometimes falsely labeled, we compared the spectra with that of commercially available canola oil (Figure 4).
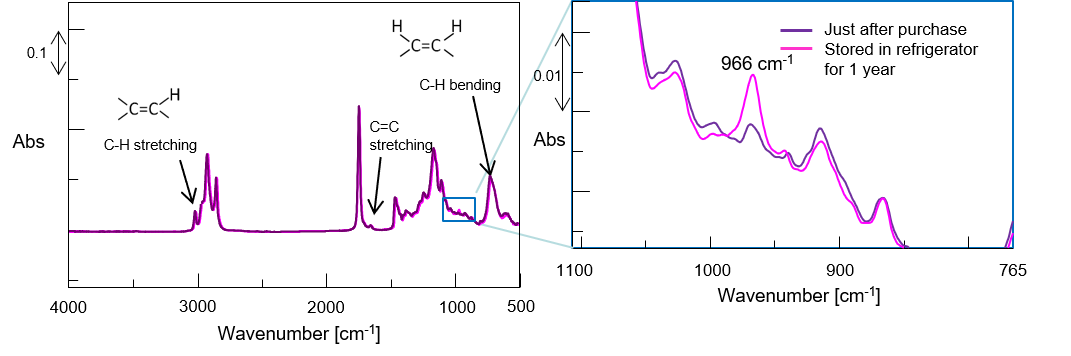
Figure 3 Perilla oil deterioration
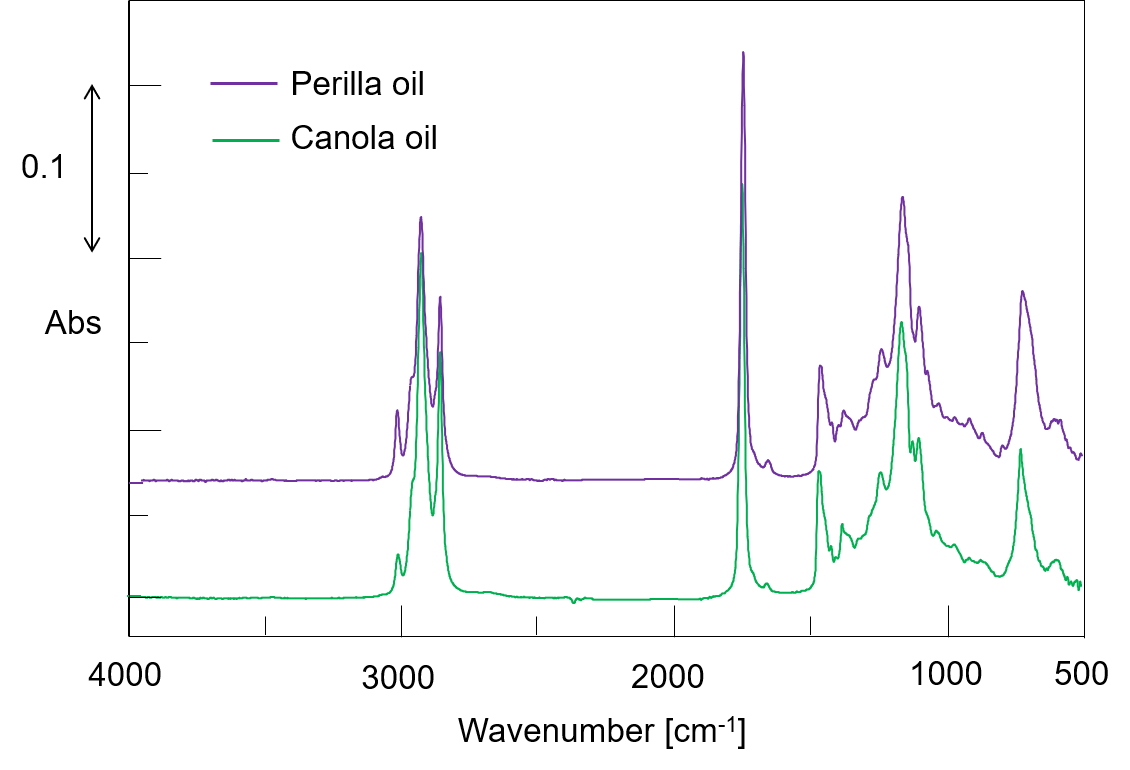
Figure 4 IR spectra for perilla and canola oils
As seen in Figure 3, following refrigerator storage, perilla oil exhibits an enhanced absorption band at about 966 cm-1 associated with the trans form of the unsaturated double bonds of ALA. This shows that cis-to-trans conversion occurred by oxidative degradation due to aging even at low temperature.
Also, for canola oil, perilla oil just after purchase and perilla oil stored in a refrigerator for one year, 15 samples of each oil were measured and the results were subjected to a principal component analysis (PCA) based on the absorption bands associated with unsaturated bonds. As seen in Figure 5, the PCA allowed the three oils to be clearly distinguished.
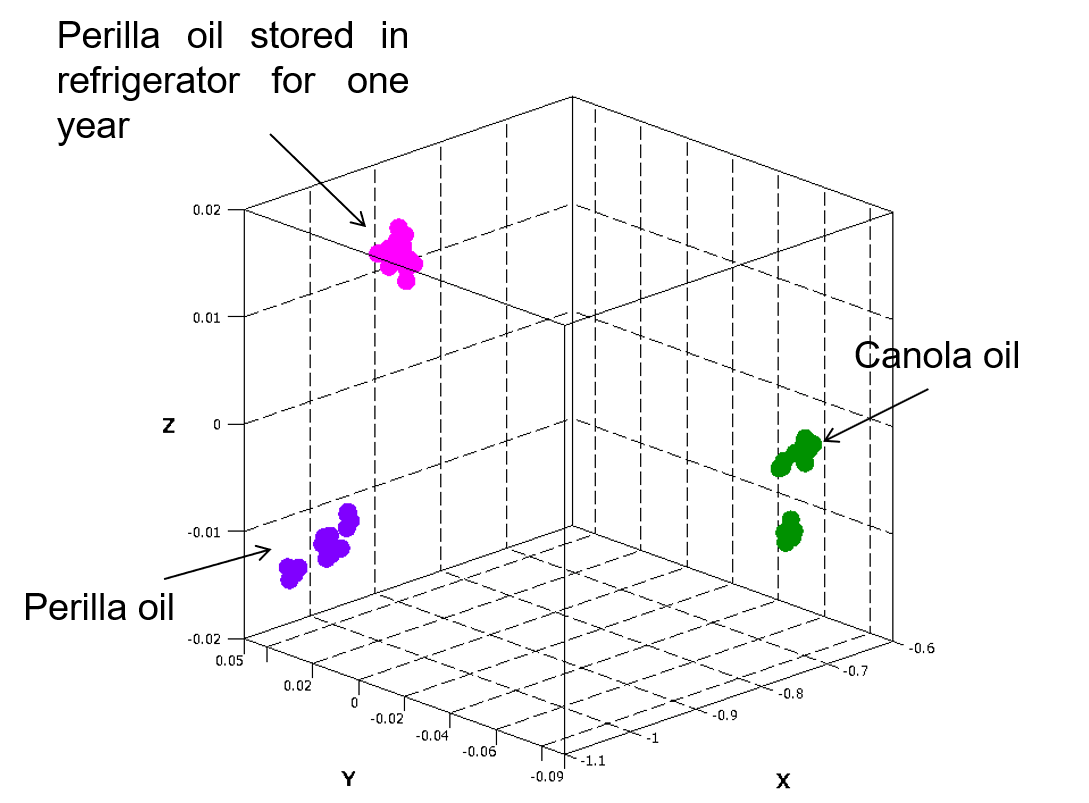
Figure 5 PCA results for perilla and canola oils
Unknown Sample Analysis
Using the PCA model for canola and perilla oils obtained in the above section, the similarity of six unknown samples was predicted based on their spectra (Figure 6). Three samples each were clearly identified as canola or perilla oil.
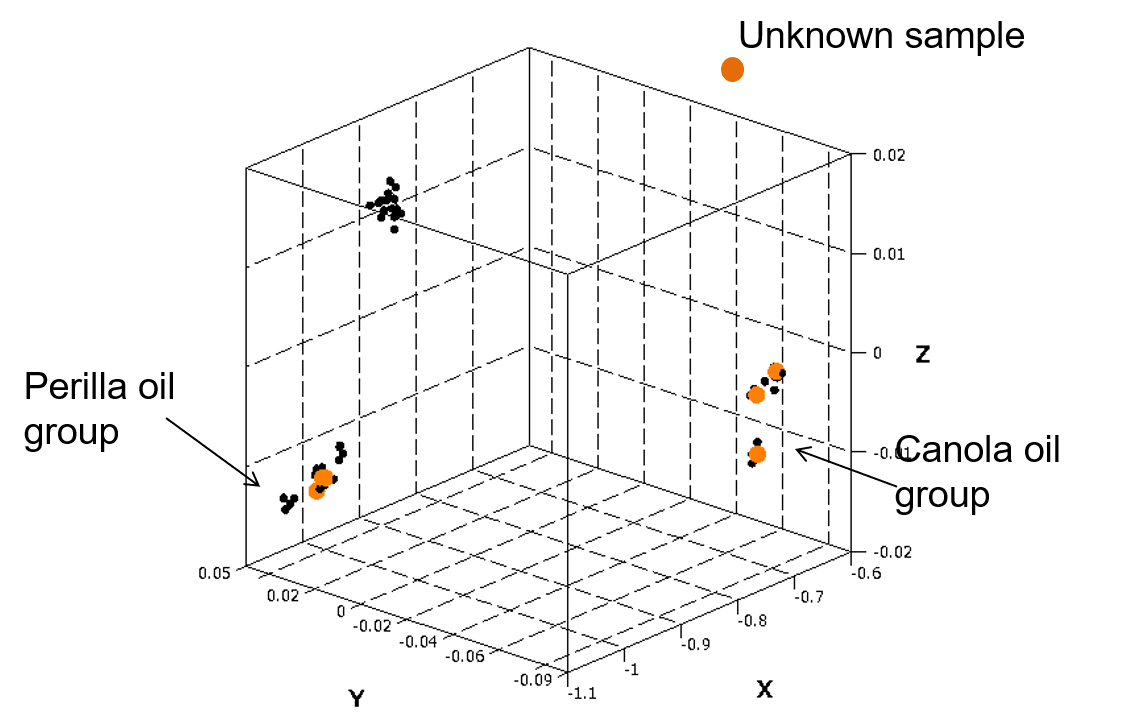
Figure 6 Prediction based on PCA model
Conclusion
Compositional analysis of edible oils could be performed by one-drop measurement using the ATR PRO ONE. A combination of the ATR PRO ONE, an IR spectrophotometer and the [Imaging Model Analysis] program with PCA model creation and prediction capabilities allows evaluation of the authenticity of edible products whose contents may be mislabeled or may have degraded. Since this is often impossible using simple visual inspection, this approach provides a simple, highly effective means of ensuring the safety and reliability of food.
Related Posts:
 Microplastics Identification using Macro-ATR Unit…
 Analysis of pollen collected by Durham sampler…
 Base Material and Dye Analysis - Combined Raman and…
 Combined Analysis of Thermochromic Materials -FT-IR…
 Analysis of CBN-Binding DNA Aptamer using CD Spectroscopy") Higher-Order Structure (HOS) Analysis of CBN-Binding…
Higher-Order Structure (HOS) Analysis of CBN-Binding… Analysis of Styrofoam by GPC/SEC using mixed gel column