Introduction
Circular dichroism is a renowned technique for probing biomolecular structure. The far-UV CD is sensitive to changes in the bond angles of a protein’s backbone chain and the near-UV monitors the tertiary structure, composed of aromatic amino acids residues and disulfide bonds. Slight changes to either the molecule or its environment can induce structural changes, altering its function. However, confidently identifying significant changes in the CD spectrum, and consequently the molecular structure, require statistical exploration. We have recently developed an algorithm that allows the comparison and quantification of differences between spectra by calculating a similarity and z-score, effectively eliminating operator bias.
[Spectrum QC Test] program
[Spectrum QC Test] program can statistically evaluate the similarity between a spectrum and a reference model. Figure 1 shows the reference mode window in [Spectrum QC Test] program. Since CD monitors the difference in the absorption of left- and right-handed circularly polarized light, the measured signal is extremely small, to account for noise in the CD spectrum weighted score calculations are performed for each wavelength using the relation between the noise standard deviation and the high tension (HT) voltage of the CD spectrometer.
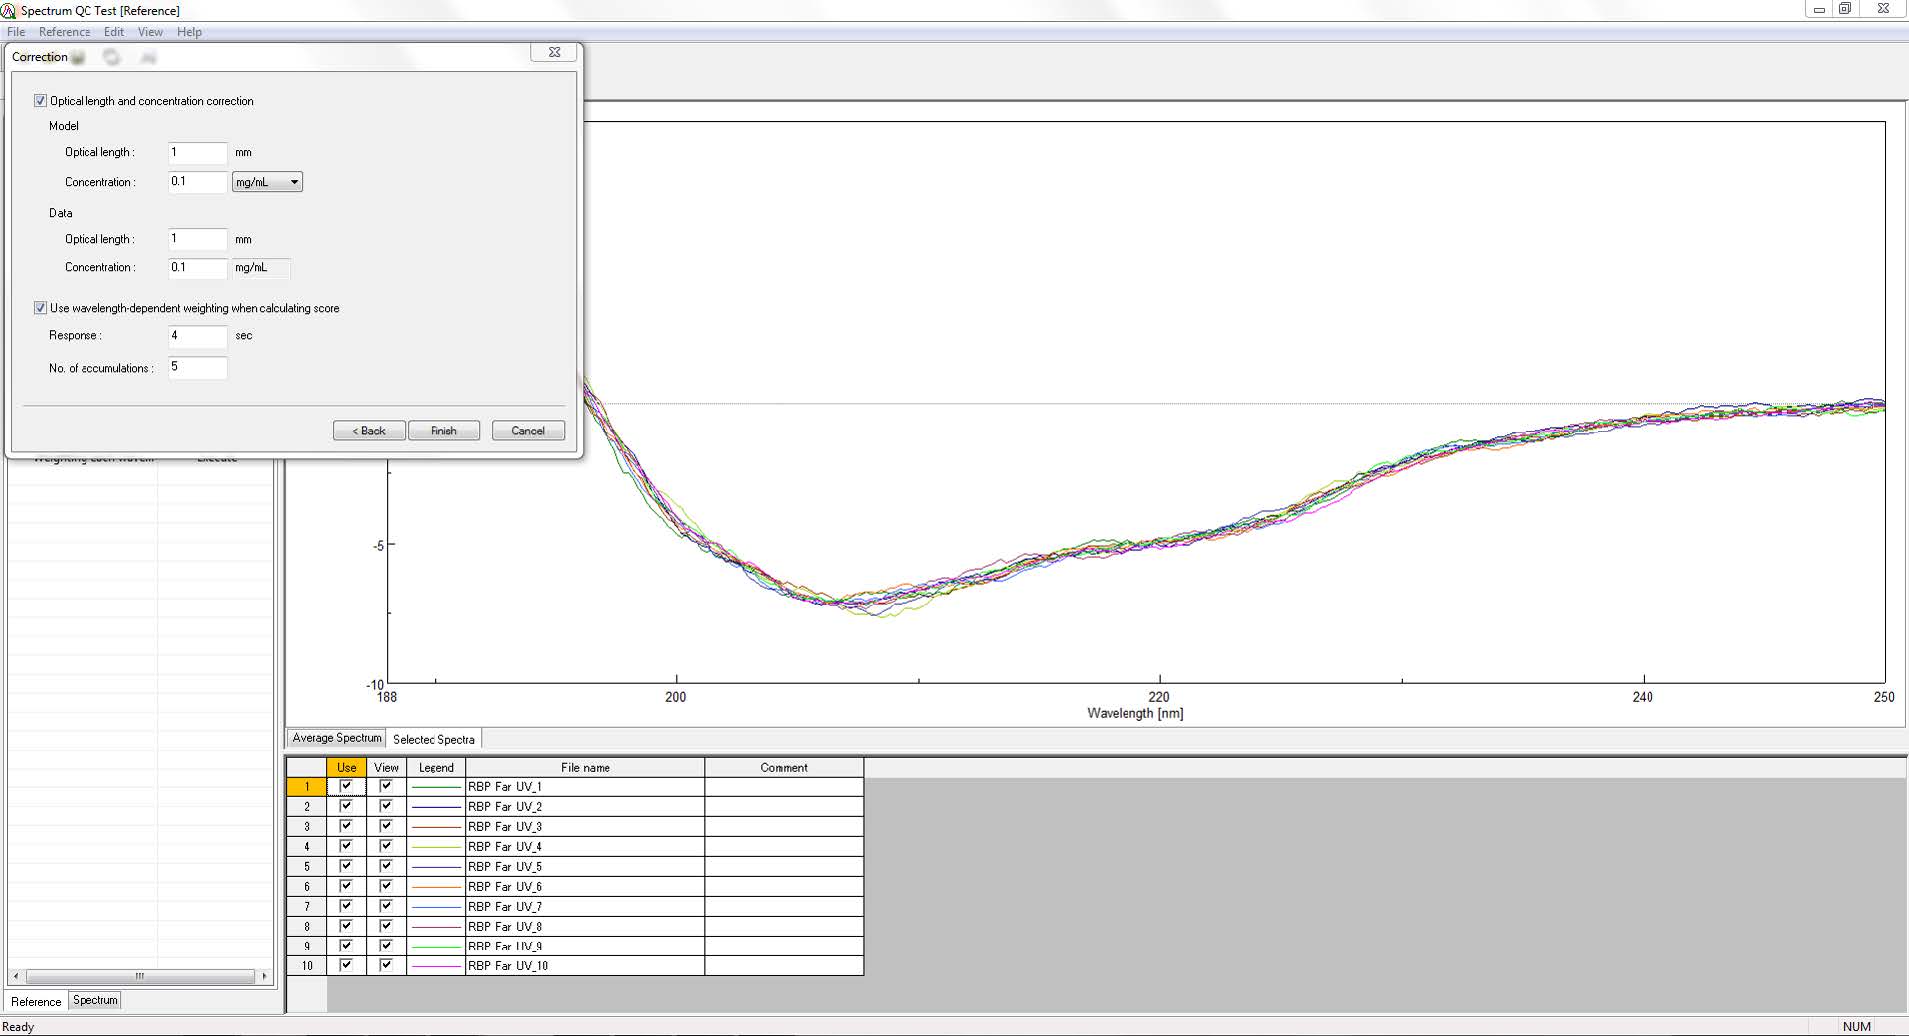
Figure 1. [Spectrum QC Test] program reference mode window
Figure 2 shows the compare mode window in [Spectrum QC Test] program. After calculating a reference model and its average similarity value and standard deviation, the program uses a comparison algorithm (eqn. 1) to determine the similarity between the reference model and sample spectrum.
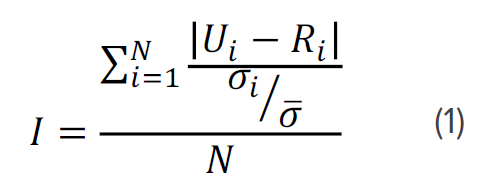
A z-score (eqn. 2) is then calculated to determine how many standard deviations the spectrum is from the average model distribution or whether there are statistically significant differences in the sample spectrum.
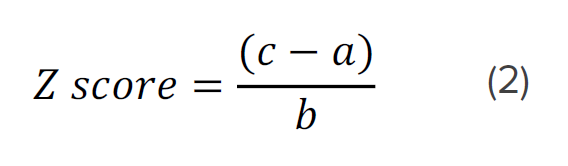
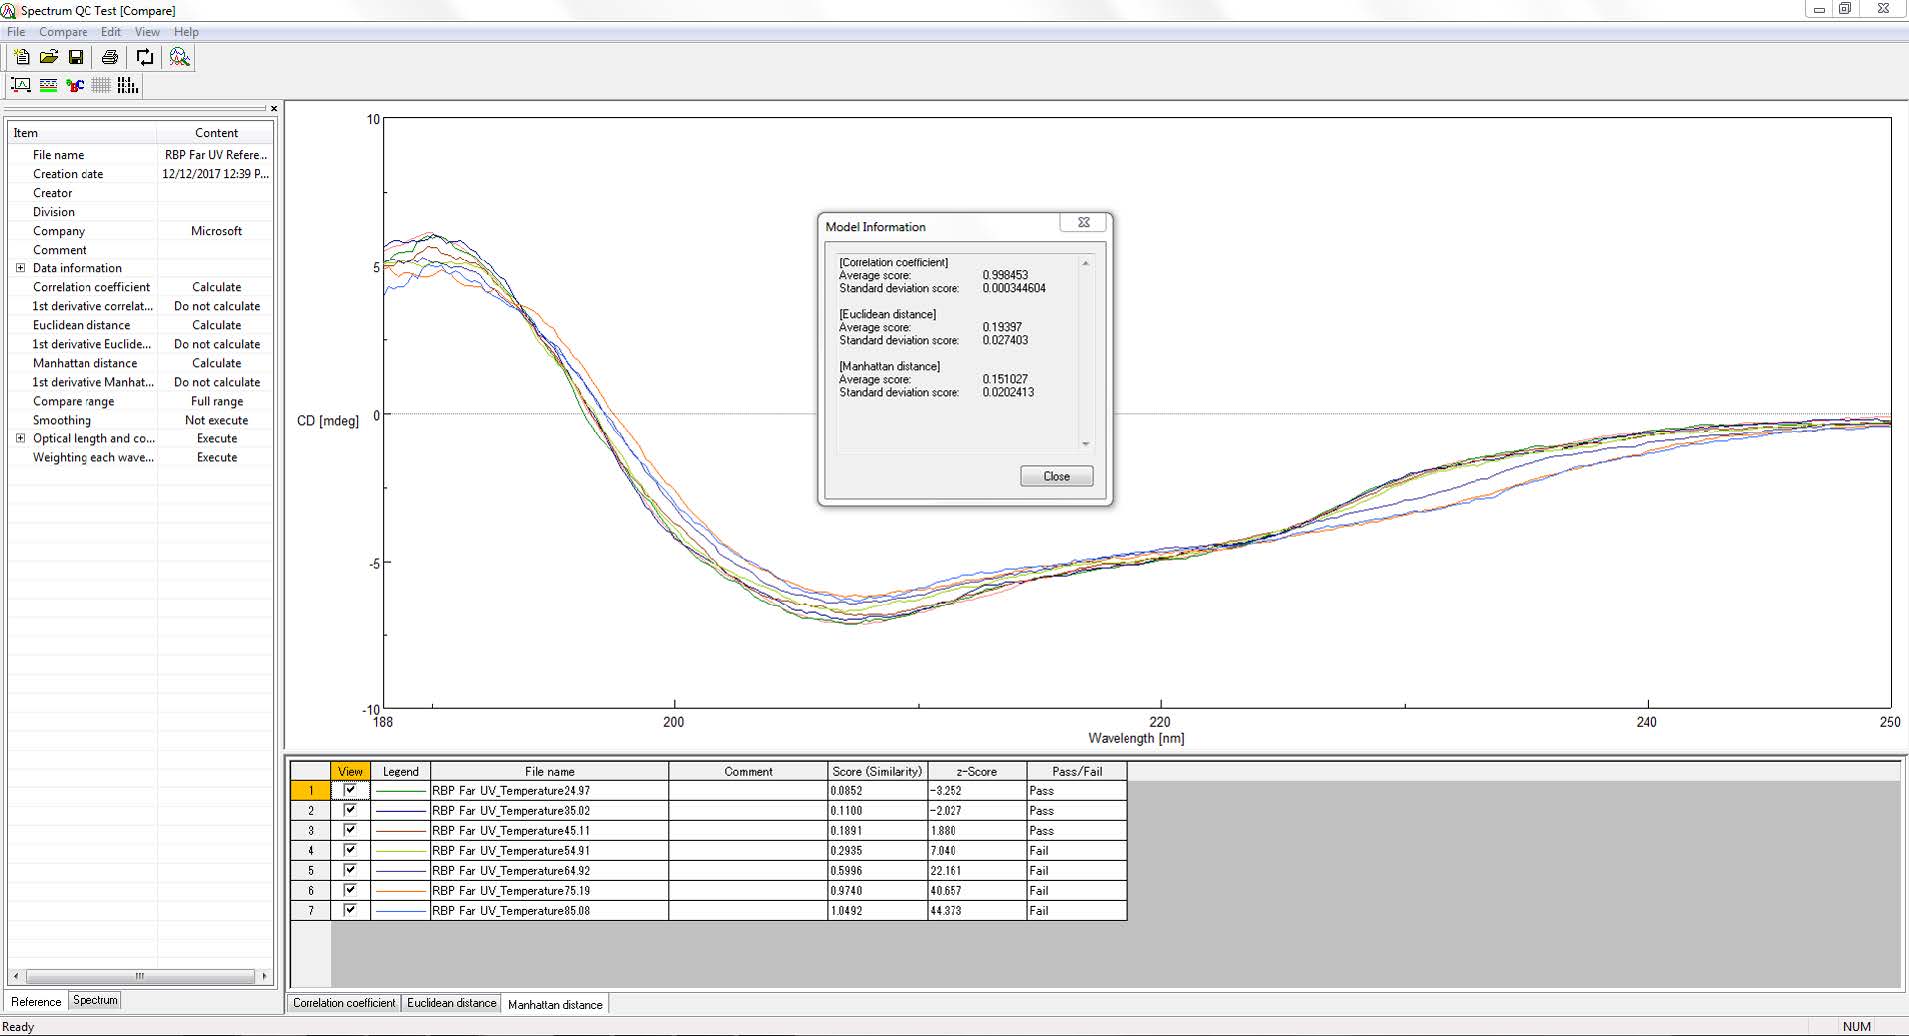
Figure 2. [Spectrum QC Test] program compare mode window
Evaluation example
The far- and near-UV CD spectra of riboflavin-binding protein (RBP) were measured at varying temperatures. Figure 3 shows Far-UV spectra of RBP at varying temperatures from 25 to 85ºC. Far-UV CD spectra probe protein secondary structure changes.
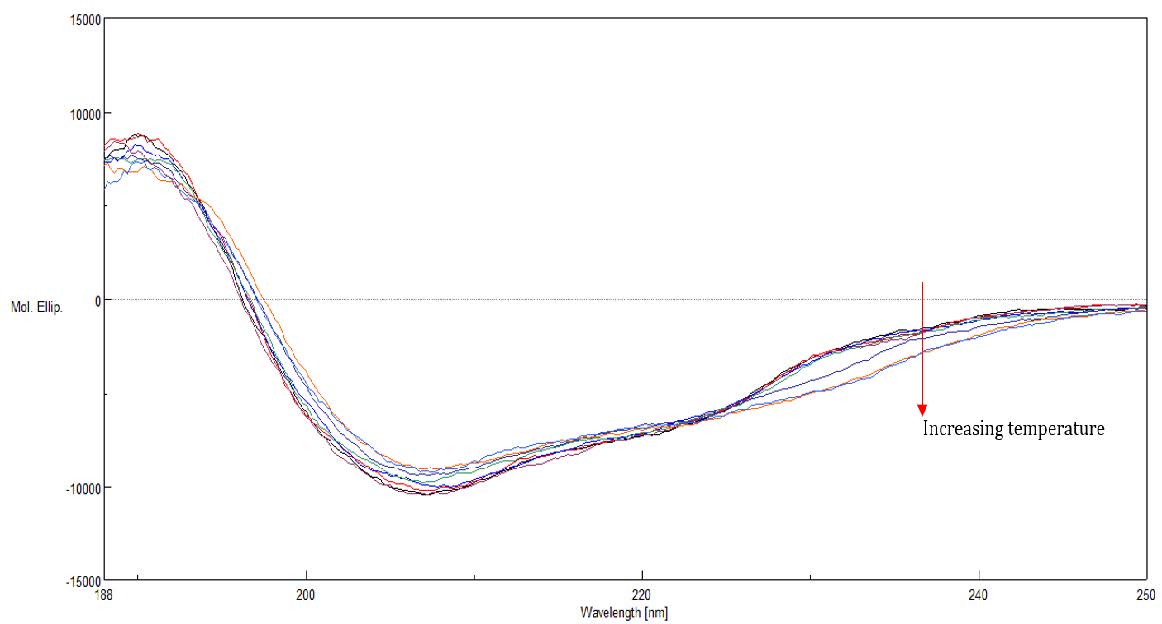
Figure 3. Far-UV spectra of RBP at varying temperatures from 25 to 85ºC
Figure 4 shows Near-UV spectra of RBP at varying temperatures from 25 to 85ºC. Near-UV CD spectra probe protein tertiary structure changes.
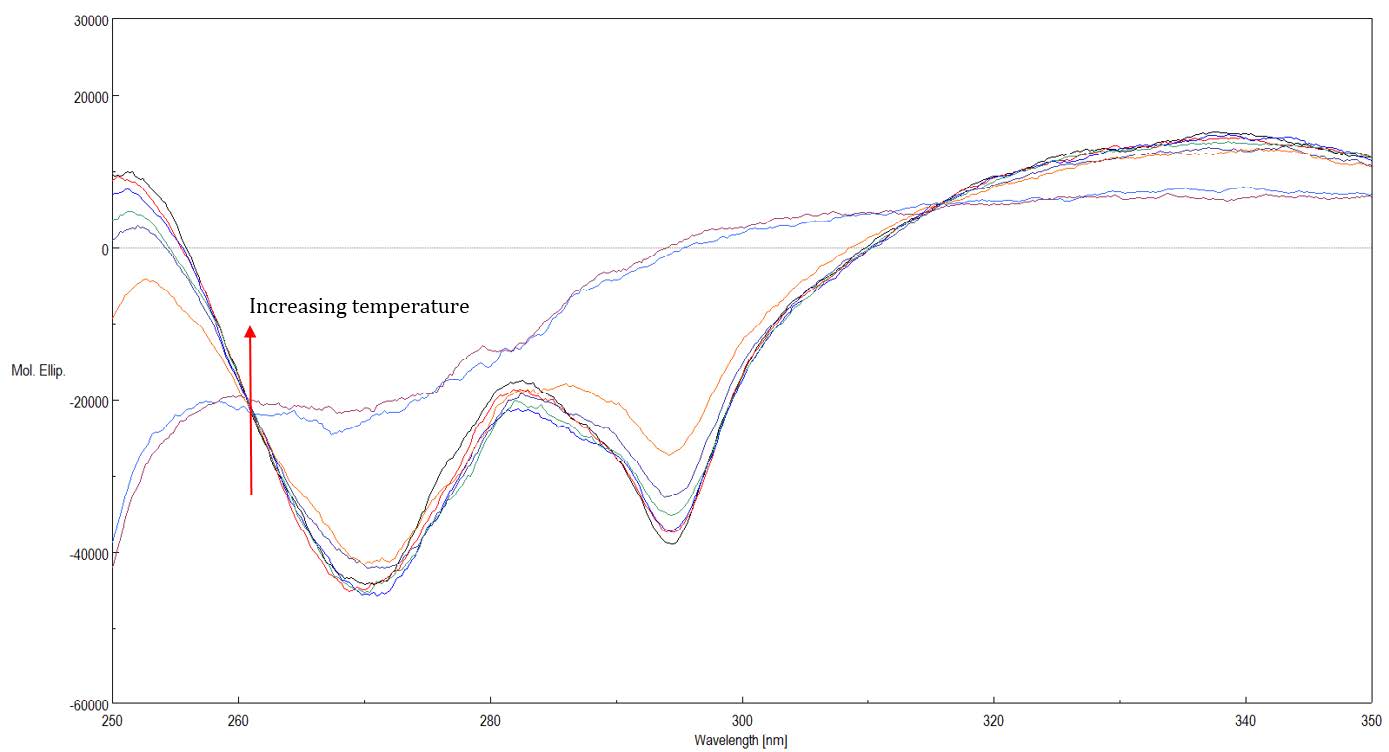
Figure 4. Near-UV spectra of RBP at varying temperatures from 25 to 85ºC
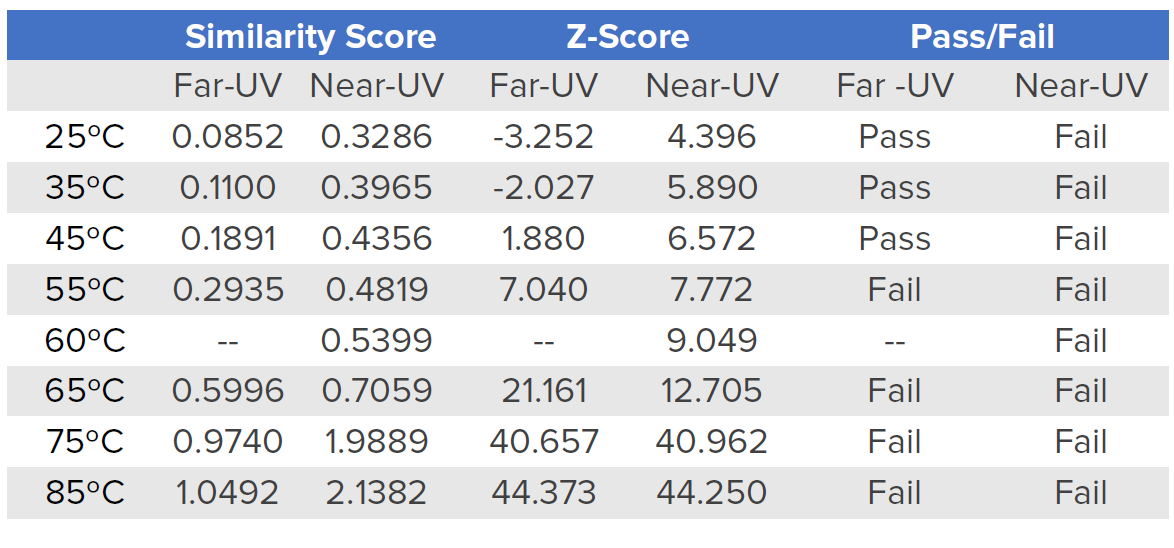
Table 1 shows Far- and Near-UV similarity scores of RBP at varying temperatures using the Manhattan distance algorithm and 2σ criteria. In the far-UV, the similarity and z-scores obtained from the comparability evaluation show that at 55°C and above, the secondary structure of RBP has undergone changes compared to the spectrum obtained at 20°C. However, in the near-UV, at all temperatures there are statistically significant differences in the spectra. These results indicate more substantial alterations to RBP’s tertiary structure than its secondary structure upon increasing the temperature.
Table 1. Far- and Near-UV similarity scores of RBP
References
Poster session at Biophysical Society meeting 2018.
Leah Pandiscia1 and Yoshiro Kondo2
1 JASCO, Inc., Easton, MD 21016
2 JASCO Corporation, Hachioji-shi, Tokyo 192-8537, Japan


