Absorption spectroscopy vs. emission spectroscopy
Fig. 4 shows the typical setup of a UV/Vis spectrometer and a spectrofluorometer. Both are the same in that a sample is irradiated with monochromatic light from a light source after passing through a monochromator. The UV/Vis spectrometer detects light that has passed directly through the sample (absorption spectroscopy). In contrast, a spectrofluorometer detects fluorescent light emitted in the 90° direction and passed through an emission monochromator (emission spectroscopy).
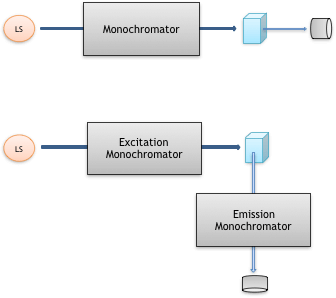
Fig. 4 UV/Vis spectrometer (top) and spectrofluorometer (bottom)
In the excitation spectrum, the emission wavelength (Em) is fixed, and the excitation wavelength (Ex) is scanned to measure the fluorescence intensity. The wavelength that gives the maximum fluorescence intensity is the maximum excitation wavelength. The shape of the excitation spectrum is similar to that of the absorption spectrum (Fig. 5). The fluorescence spectrum is acquired by fixing the excitation wavelength (Ex) and scanning the emission wavelength (Em). Although the fluorescence intensity varies with excitation wavelength, the spectral profiles are similar (Fig. 5).
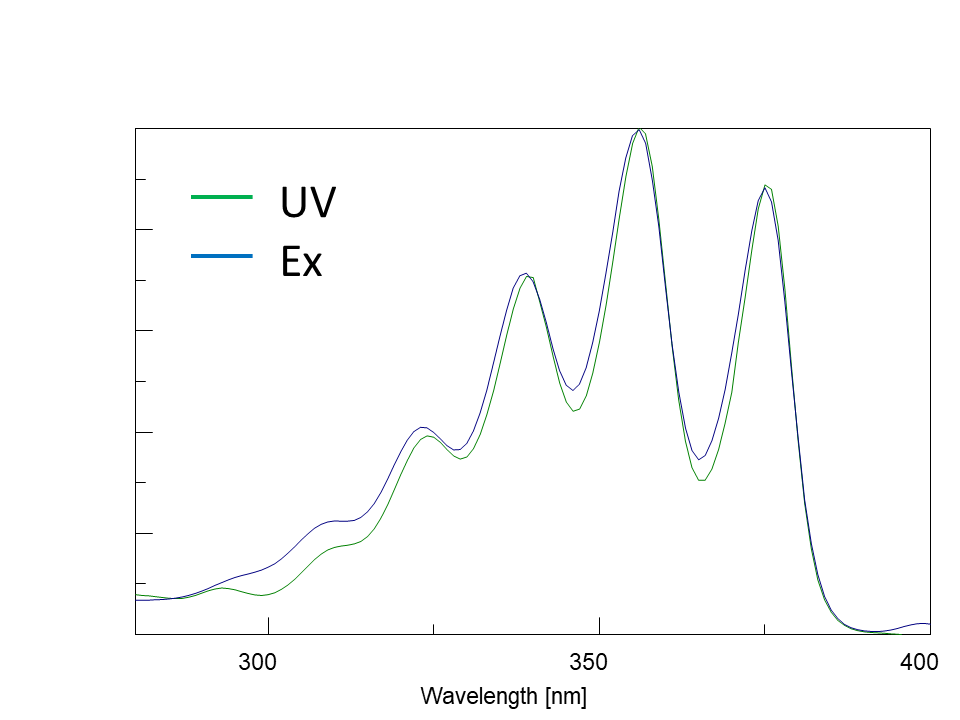
Fig. 5-1 Absorption spectrum and excitation spectrum
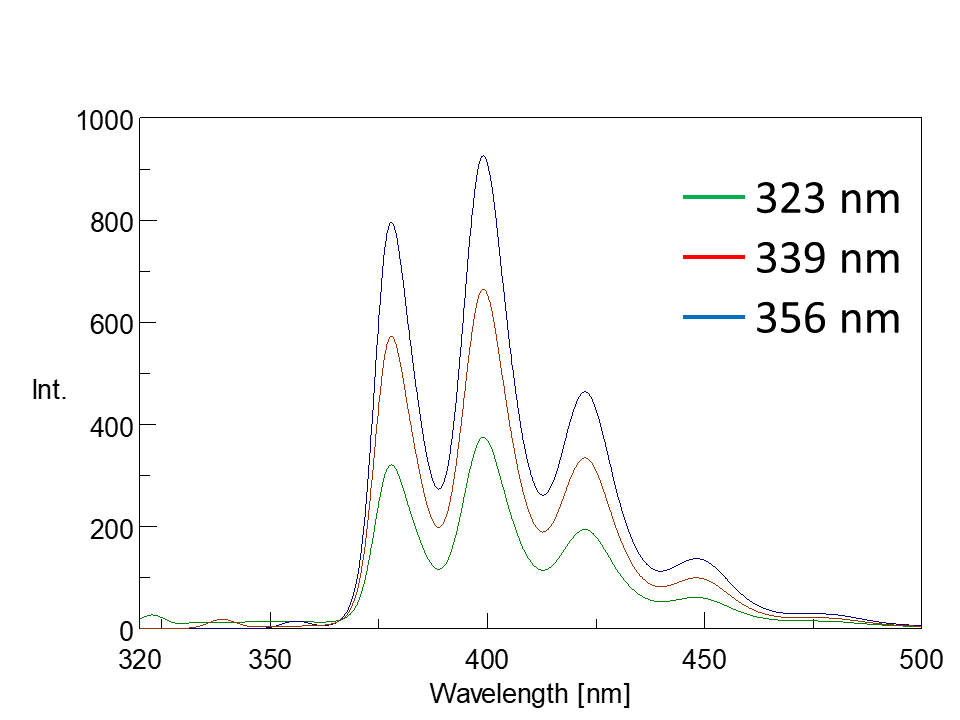
Fig. 5-2 Fluorescence spectra at different excitation wavelengths
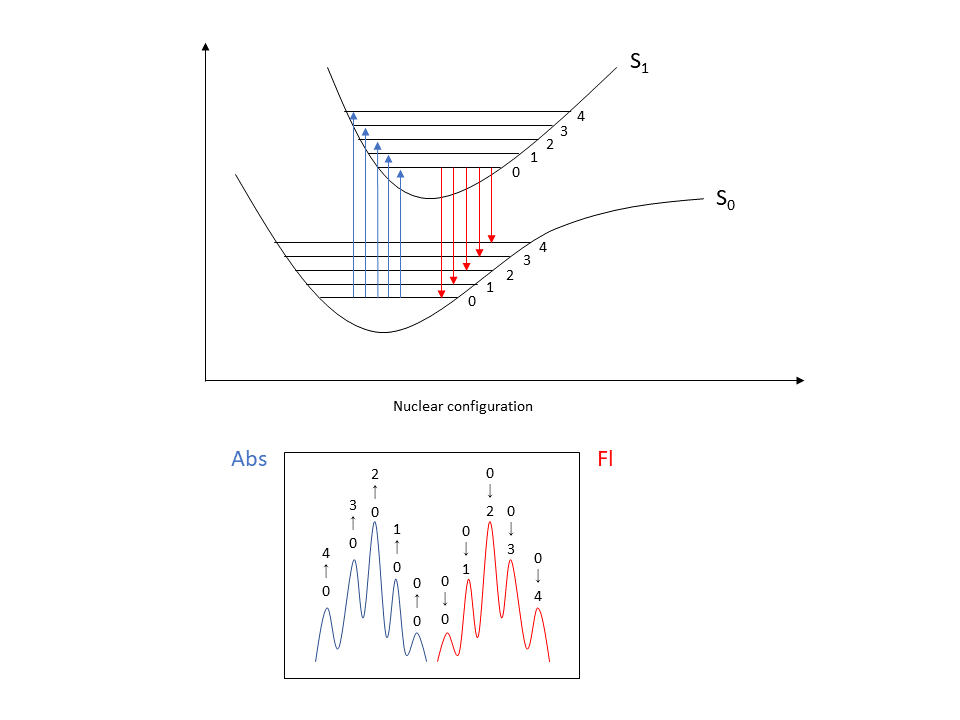
Fig. 6 Franck-Condon absorption spectrum: vibration levels in excited and ground states (top), mirror image relationship between absorption and fluorescence spectra (bottom)
Advantages of fluorescence spectroscopy
Fluorescence spectroscopy offers the following advantages:
○ High sensitivity
Absorption spectroscopy detects decreases in incident light intensity, whereas fluorescence spectroscopy detects the intensity of emitted light. It is highly sensitive because it detects the difference from zero light intensity.
○ High selectivity
Specific fluorescent labeling is possible by binding fluorescent molecules to the target molecules. This is why fluorescence analysis is considered highly selective.
○ High environmental dependency
The shape and intensity of the fluorescence spectrum are sensitive to the environment surrounding the fluorescent molecules (solution pH, temperature, solvent type, coexisting salt). This can be used to probe the surrounding environment.
Molecular information obtained by fluorescence spectroscopy includes the following:
- Amount and concentration of target substance
- Optimal excitation wavelength, fluorescence wavelength
- Environment surrounding fluorescent molecules (solution pH, temperature, type of solvent, coexisting salt)
- Fluorescence lifetime, phosphorescence lifetime
- Depolarization (ease of movement of molecules)
- Quantum yield (luminescence efficiency)


 properties of platinum complexes using a CPL measurement system and a spectrofluorometer")

