Introduction
Q. We want to conduct time-resolved measurements with FTIR. What is the level of time resolution available?
A. FT-IR spectroscopy has 3 methods of time-resolved measurements: interval, rapid-scan, and step-scan measurements. The minimum time resolution for these methods is 1 second, 50 milliseconds and 5 microseconds (optional: 10 nanoseconds), respectively.
Each method’s feature and an example measurement is provided here. Each method has a different type of scanning method of the moving mirror within the interferometer. The “Interval measurement” is performed with regular scanning at a controlled interval, the “rapid-scan measurement” is obtained with rapid scanning of the sample during a minimal time variation. For “step-scan measurements”, the moving mirror makes a stop at every data-sampling point and mirror perturbation is performed at the various data-sampling points.
Interval Measurement*1
Time Resolution: 1 second
Applications: structural transition of a sample, monitoring of gas concentrations
Measurement example: A transition of the CO2 concentration in room air was measured (Figure 1). Interval measurement is effective for extended monitoring of a gas concentration.
*1JASCO ‘Interval Scan Measurement’ program can provide a maximum of 60,001 data points or a 24 day measurement maximum.
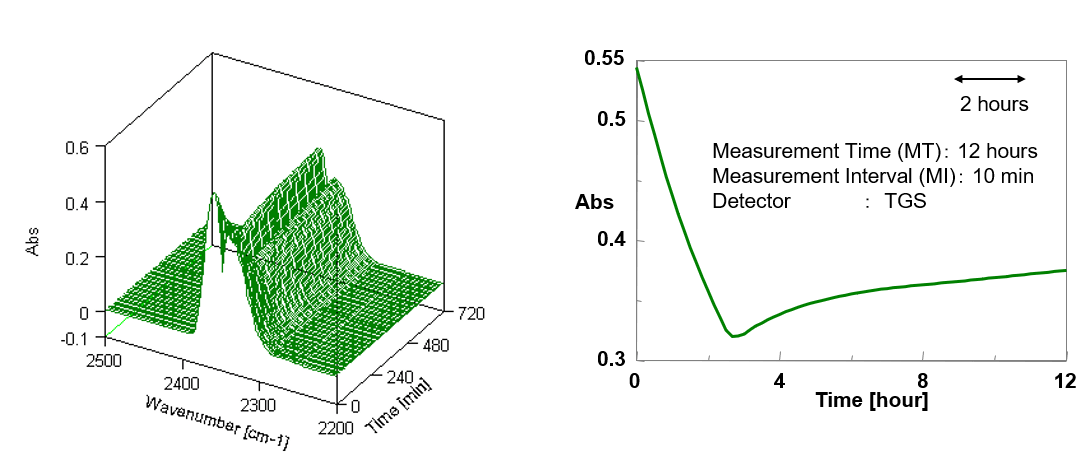
Figure 1. CO2 concentration transition (Interval measurement data, left: 3D spectrum, right: peak intensity transition of 2360 cm-1)
Rapid-scan measurement
Time Resolution: 50 milliseconds
Applications: photo-polymerization reaction, orientation relaxation of polymer film
Measurement example: The curing process of a UV cured resin was measured, which represents a photopolymerization reaction (Figure 2). The peak intensity of the C=C stretching peak at 1637 cm-1 (Figure 2) rapidly decreases responding to the UV irradiation, indicating the accurate observation of the initial reaction and the total reaction process.
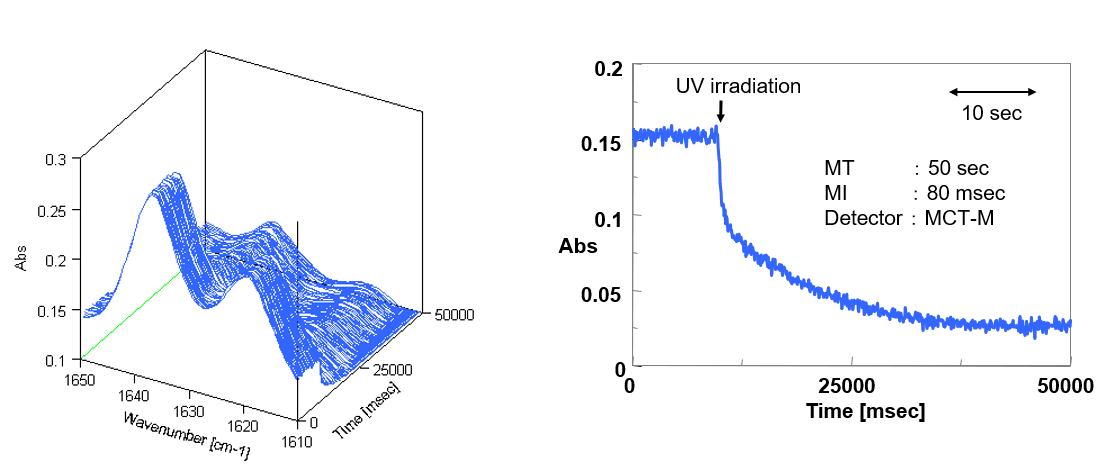
Figure 2. Cure process of UV cured resin (Rapid-scan measurement data, left: 3D spectrum, right: peak intensity transition of 1637 cm-1)
Step-scan measurement*2
Time Resolution: 5 microseconds *3
Applications: relaxation process of a liquid crystal orientation
Measurement example: The relaxation process of a liquid crystal orientation stimulated by an electric field was measured (Figure 3). Specifically, the peak intensity at 2925 cm-1, a C-H stretching vibration, is observed to respond to the applied voltage. The peak change also decreases in two phases, rapidly and then moderately, after the power is turned off. It is known that the liquid crystals near the electrode interface has a faster orientation relaxation than the bulk crystal and the difference between these sites is captured with this measurement.
*2 limited to materials with repetitive, reproducible reactions;
*3 a 10 nanosecond response system is available as an option
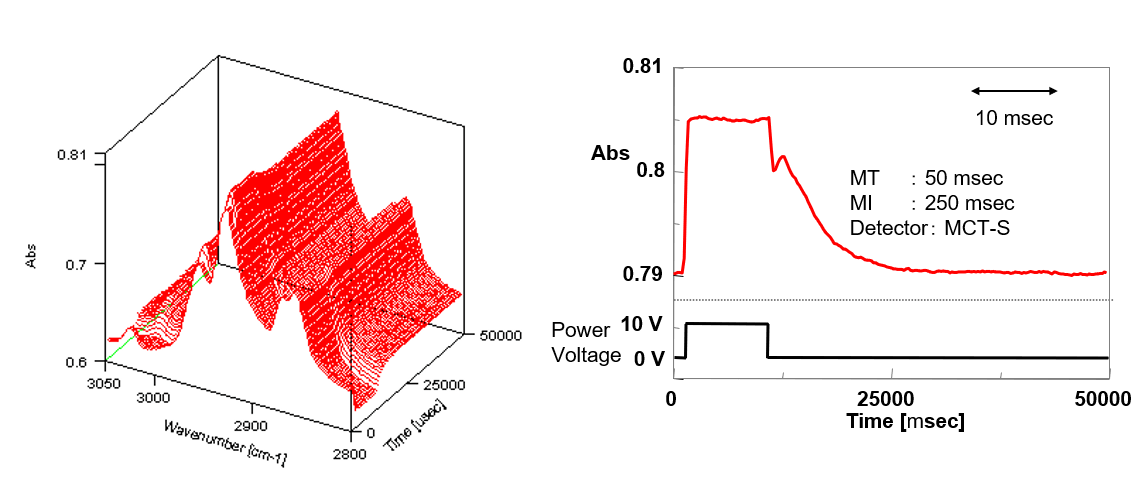
Figure 3. Relaxation process of a liquid crystal (Step-scan measurement data, left: 3D spectrum, right: peak intensity transition of 2925 cm-1)


