Introduction
The thermodynamic properties and secondary structure of proteins reveal important information regarding their structure and therefore, their function. While differential scanning calorimetry (DSC) and circular dichroism (CD) spectroscopy are both often used to measure the thermal denaturation of proteins, CD spectroscopy has several advantages over DSC. For example, CD spectra can be measured using lower protein concentrations at various pHs and in a wider range of solvent conditions. However, CD spectra cannot typically be measured at temperatures above 100°C because of the boiling point limit of aqueous-based solutions.
JASCO has developed the HTC-572 a sample chamber for measurements at temperatures greater than 100°C by applying elevated pressures. The HTC-572 allows CD spectra to be measured at temperatures up to 170°C by applying pressure to the sample (up to 1 MPa), using compressed N2 gas. CD measurements probing the thermal properties of super thermostable proteins can be made using the HTC-5721).
This application note describes the thermal denaturation analysis of super thermostable cellulase using the HTC-572 with Denaturation Analysis program.
J-1500 CD spectrometer
Experimental
Measurement Conditions
Data acquisition interval: 0.1 nm
Spectral bandwidth: 1 nm
Response time: 2 sec
Temperature interval*: 0.1°C
Path Length: 10 mm
Scan speed: 100 nm/min
Pressure: 0.8 MPa
Temperature slope*: 1°C/min
*For CD thermal denaturation curve monitored at 220 nm.
1.2 mg/mL of super thermostable cellulase in 20 mM Tris-HCl buffer (pH 8.0) was diluted with distilled water to the desired concentrations and measured using the J-1500 and HTC-572.
Keywords
Thermal denaturation, thermal stability, circular dichroism, J-1500, HTC-572, Denaturation Analysis, super thermostable cellulase
Results
The CD spectra of 0.01 mg/mL super thermostable cellulase was measured at 45, 80, 100 and 120°C and is shown in Figure 1. Super thermostable cellulase maintains its activity at temperatures up to 90°C, which is consistent with our data illustrating that the thermal denaturation of the protein can only be seen for temperatures above 100°C.
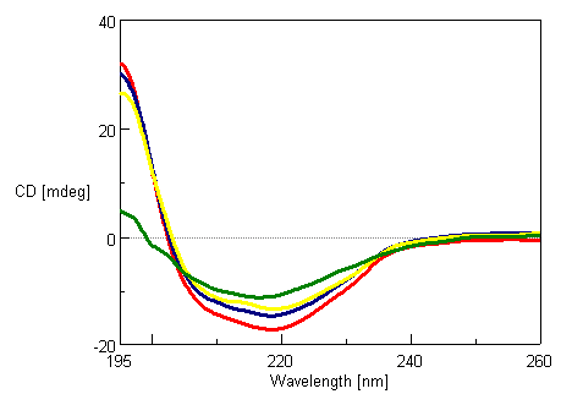
Figure 1. Far-UV (195-260 nm) CD spectra of 0.01 mg/mL of super thermostable cellulase at 45°C (red), 80°C (blue), 100°C (yellow) and 120°C (green).
CD measurements were also obtained at 220 nm to probe the thermal denaturation of super thermostable cellulase. The result and analysis using the Denaturation Analysis program are shown in Figure 2. Consistent with Figure 1, there is a sharp decrease in the CD value at temperatures over 100°C, indicating the loss of secondary structure and denaturation of the protein above 100°C. The melting temperature (Tm) of super thermostable cellulase was calculated by the Denaturation Analysis software and found to be 106.3°C.
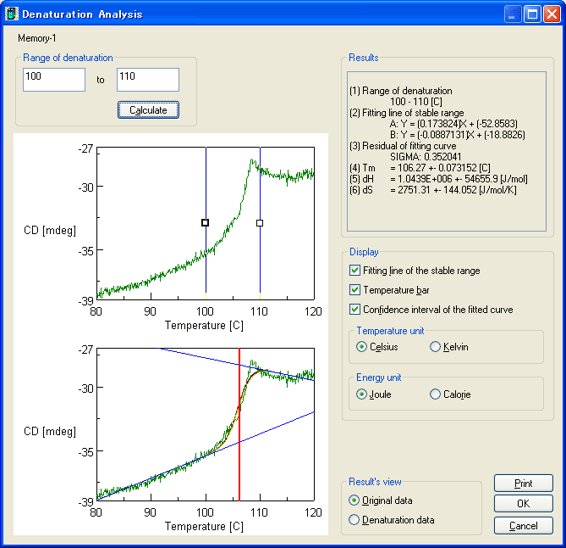
Figure 2. Thermal denaturation results for 0.025 mg/mL super thermostable cellulase
Conclusion
This application note illustrates that by using the HTC-572 with a J-1500 circular dichroism spectrometer, thermal denaturation curves can be measured at temperatures above 100°C to test thermostable proteins with high melting temperatures.
References
(1) S. Uchiyama, A. Ohshima, S. Nakamura, J. Hasegawa, N. Terui, S. J. Takayama, Y. Yamamoto, Y. Sambongi, and Y. Kobayashi, J. Am. Chem. Soc., 126, 14684-14685, (2004)


 spectrometer")

