Introduction
Circular dichroism (CD) spectral measurements are indispensable for structural analysis of chiral compounds. Electronic CD (ECD), which is associated with electronic transitions in the vacuum ultraviolet (VUV) to visible regions, is often used for secondary structure estimation of proteins, and for structural analysis of chiral molecules. On the other hand, in the mid-infrared (mid-IR) region, vibrational CD (VCD) due to vibrational transitions can be used to determine the absolute configuration and conformation of chiral compounds in combination with molecular orbital calculations.
In the near infrared (NIR) region, CD signals from metal complexes and colored proteins can be observed due to d-d transitions, and CD signals from the first and second overtones of vibrational transitions can also be observed1).
However, there is no commercial CD spectrometer that is capable of measuring CD spectra in the entire VUV to NIR region. To overcome this problem, JASCO has developed the J-1700 CD spectrometer which enables CD measurements in the VUV to NIR region. By combining this with JASCO’s FVS-6000 VCD spectrometer, full VUV-to-mid-IR (163-13333 nm) CD measurements can be performed. In this section, we describe the features of the J-1700 CD spectrometer and show example of CD spectra obtained using the J-1700.
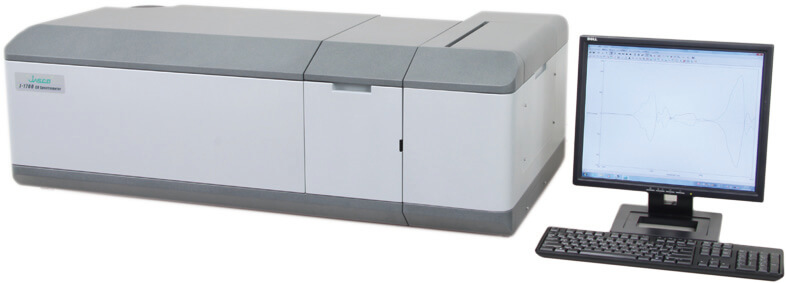
J-1700 CD Spectrometer
Unique applications of NIR CD measurements
-Structural analysis of metal complexes and colored proteins
-CD measurements of the first and second overtones of vibrational transitions
-Magnetic CD spectra measurements of transition metals
Features of J-1700 CD spectrometer
-Wavelength range is from 163 to 2500 nm.
-Light sources and detectors can be changed automatically.
Light sources: Xenon lamp and halogen lamp
Detectors: PMT and InGaAs detector (optional: InSb detector)
-Triple monochromator in NIR region for low stray light and high light intensity.
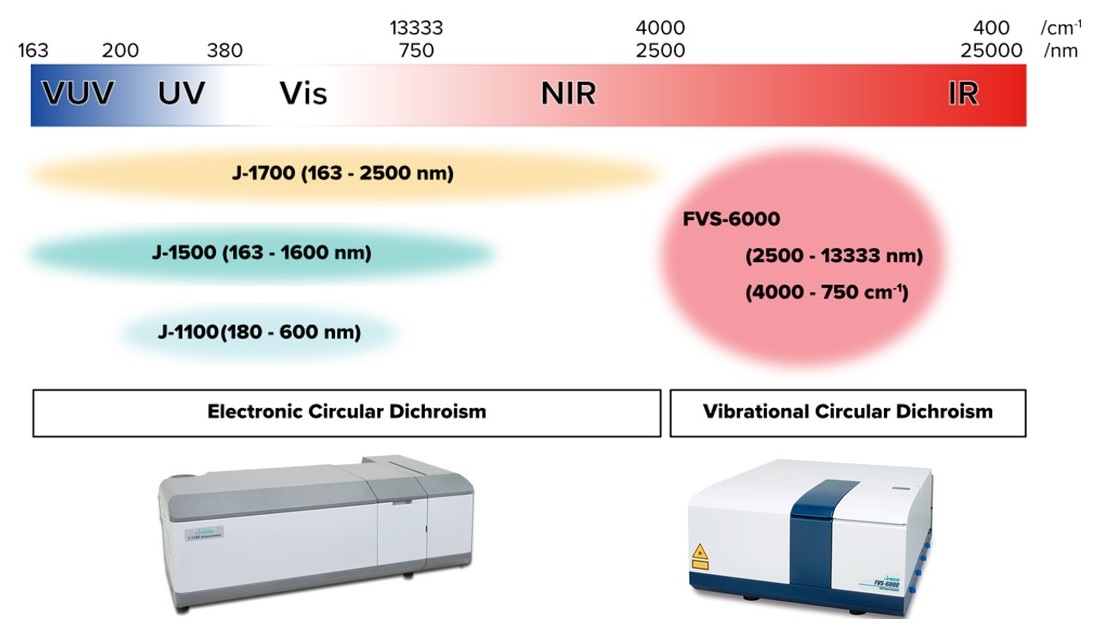
Wavelength ranges of JASCO CD spectrometers
Experimental
CD measurement of Nickel(II) Tartrate solution
Concentration: 0.12 mol/L
Solvent: D2O
Cell path length: 1 mm
Bandwidth: 1 nm (225 – 925 nm), 10 nm (925 – 1900 nm)
Data interval: 0.1 nm
Scan speed: 200 nm/min
Response: 2 sec
No. of scans: 4
CD measurement of D-Gluconic Acid Copper(II) solution
Concentration: 200 mg/mL
Solvent: H2O
Cell path length: 0.5 mm
Bandwidth: 1 nm (330 – 950 nm), 10 nm (950 – 1850 nm )
Data interval: 0.1 nm
Scan speed: 200 nm/min
Response: 2 sec
No. of scans: 4
Results
The CD spectra of Nickel(II) Tartrate solution and D-Gluconic Acid Copper(II) solution are shown in Figure 1 and 2 respectively.
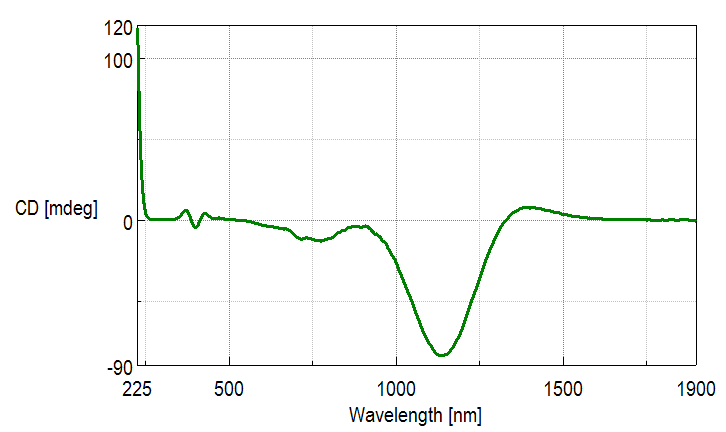
Figure 1. CD Spectrum of Nickel(II) Tartrate solution 2)
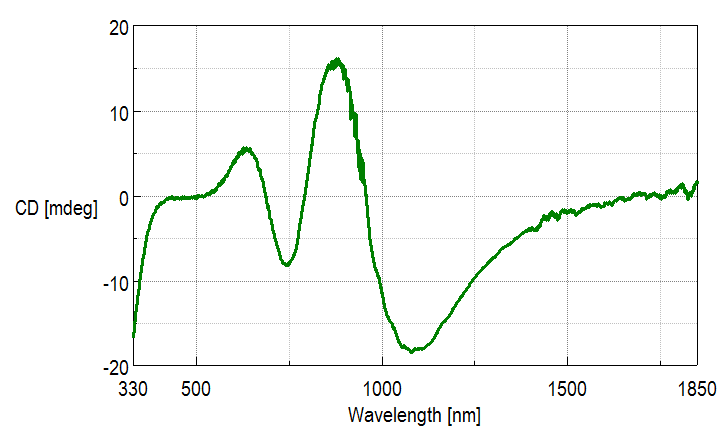
Figure 2. CD Spectrum of D-Gluconic Acid Copper(II) solution
It is possible to obtain structural information about central metal atoms in metal complexes and about colored proteins by measuring NIR CD spectra.
References
1)Sergio Abbate, Ettore Castiglioni, Fabrizio Gangemi, Roberto Gangemin and Giovanna Longhi, Chirality 21:E242-252, 2009.
2)Toshio Konno, Hiroshi Meguro, Tasuku Murakami and Masahiro Hatano, Chemistry Letters, pp. 953-956, 1981.
 properties of platinum complexes using a CPL measurement system and a spectrofluorometer")


